Active Pivot Levels
- Göstergeler
- Sürüm: 1.30
- Güncellendi: 4 Kasım 2021
- Etkinleştirmeler: 10

Pivot seviyeleri, her pazarda tanınan, iyi kurulmuş bir teknik seviyedir.
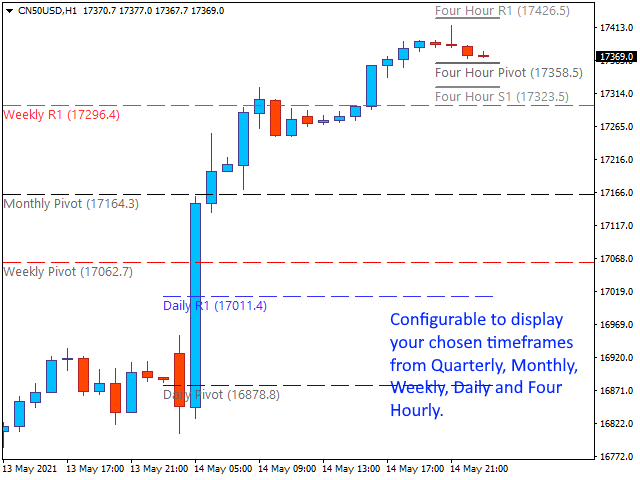
Bu gösterge, herhangi bir sembol için mevcut Üç Aylık, Aylık, Haftalık, Günlük ve dört saatlik pivotları grafik üzerinde çizecektir. Ayrıca her dönem için Destek ve Direnç seviyelerini gösterebilir ve 1 ile 4 arasındaki seviyelerden hangisinin görüntüleneceğini seçebilirsiniz.
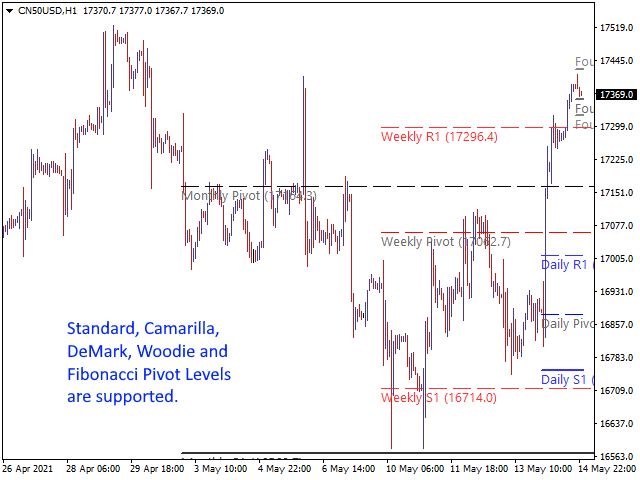
Şunlardan Pivot türünü seçin:
- Standart
- Camarilla
- DeMark
- Ormancı
- Fibonacci
Lütfen dikkat, DeMark pivotlarının orijinal spesifikasyona göre tek bir Destek ve Direnç seviyesi vardır.
Gösterge duvarı, çizgiye fiyat dokunmuşsa çizgilerin çizilme şeklini değiştirir. Bu çok yardımcı olabilir ve hatların desteğinin veya direncinin gücü dokunulduğunda önemli ölçüde azalır.
Her bir dönem için Öngörülen pivot düzeyini göstermeyi seçebilirsiniz. Bu, normal pivotlarla aynı hesaplamayı kullanacak, ancak şu anda tamamlanmamış zaman çerçeveleri üzerinde çalışacaktır. Bu nedenle, fiyatın zaten aralığının çoğunu kapsadığı dönemin sonuna doğru kullanılması en iyisidir.
Ayarlar
https://www.mql5.com/en/blogs/post/746511
Bu çok yapılandırılabilir bir Göstergedir, böylece istediğiniz gibi çalışmasını sağlayabilirsiniz.
Another great indicator form this author. Runs perfectly, does not slow down MT4 like other pivot indicators. Fully customizable for all styles of trading whether you only need 1 pivot line or if you need many pivot and SR lines. Pivot line changes style once touched by price, great feature. New toggle button keeps your charts clean when you don't need to see the lines. Author is very responsive and helpful.