Range Exhaustion
- Indicators
-
Robert Gerald Wood
 Professional software developer of 25+ years, now building tools for myself and sharing them to the wider community.
For more information on my products, visit https://www.bunnywood.co.uk - Version: 1.0
- Activations: 10
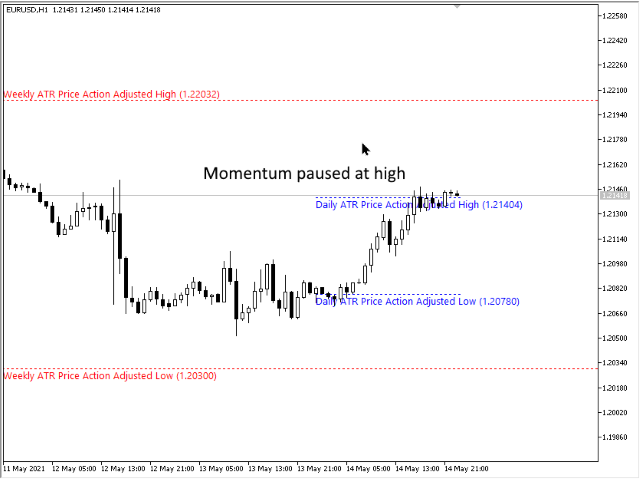
Range Exhaustion occurs when price meets or exceeds the expected range for the current period. At these levels, price starts to lose its momentum relative to earlier in the period, so its a good point to make sure you are not taking new positions.
This indicator will show you where this is likely to happen on your chart, showing levels for Daily, Weekly and Monthly periods.
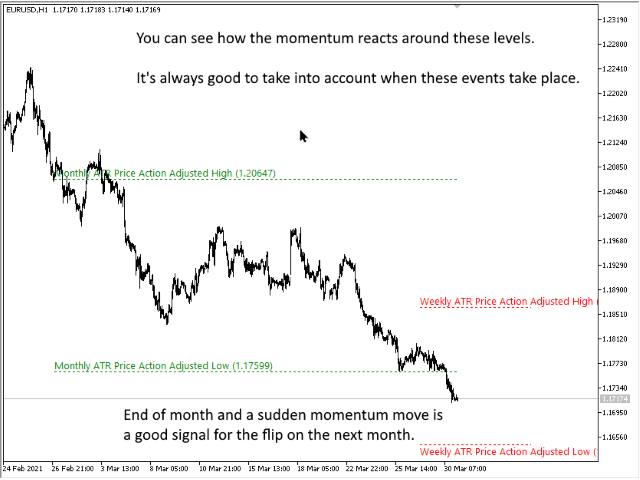
When you see price exceeding these exhaustion levels, it's telling you that the momentum behind the move is very strong and likely heading for the higher timeframe level.
The indicator can use the Average True Range (ATR) or the Average Range (ADR) calculation, depending on your preferences. By default we use ATR as we find it works better on Forex charts, but ADR does have the edge on Stock based indices and symbols.
The indicator has a number of drawing modes, described below, that allow you to tailor it to your needs.
SETTINGS
CalculationMode
Choose from AverageTrueRange (ATR) or AverageDailyRange (ADR) for calculating the levels.
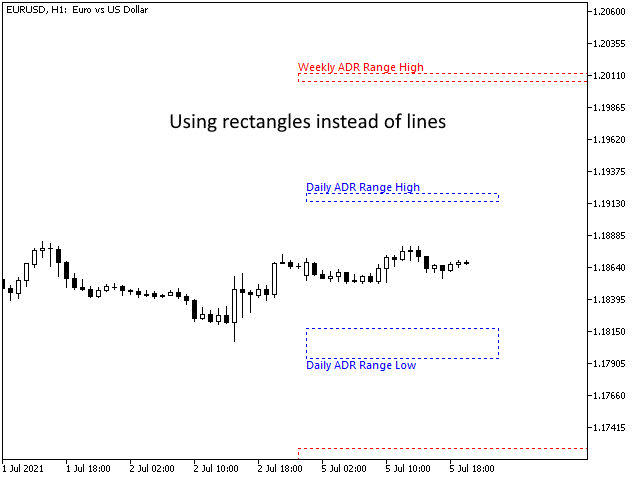
DrawingMode
The indicator can display in different ways.
- Draw Price Adjusted Line - The level adjusts through the period, based on Highs and Lows reached. This is the default and most commonly used method.
- Draw Expected Maximum - The level is a fixed value, being the last period close plus or minus the ATR or ADR value.
- Draw Both Lines - Shows both the above lines.
- Draw Rectangles - Shows a single rectangle where the top and bottom lines are the Price Adjusted and Expected Max/Min
ReviewPeriod
The period to use when calculating the ATR/ADR values.
ShowDailyLimits
When true, draws the Daily exhaustion levels.
ShowWeeklyLimits
When true, draws the Weekly exhaustion levels.
ShowMonthlyLimits
When true, draws the Monthly exhaustion levels.
ShowDescriptions
When true, draws descriptive labels for the levels. If false, just the line is drawn, but the lines have tooltips should you need to know what they represent.
ShowPriceInDescription
When true, the level value will be added to the description and tooltip.
DescriptionFontSize
Font size to use when drawing descriptions
ExtendLines
When true, instead of drawing the lines to the end of the period, the lines extend to the right of the chart indefinately.
The following settings appear for each time period, D1, W1 and MN1
XX_Colour
The colour to use when drawing the lines and description
XX_LineWidth
The width of line to draw. If the LineStyle is anything but Solid, this value is ignored. Only solid lines can have a width on MetaTrader.
XX_LineStyle
The type of line to draw from the standard selection.