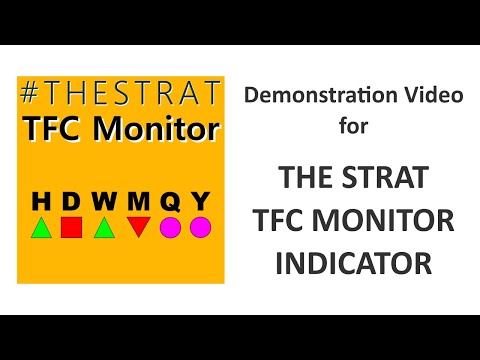
TheStrat TFC Monitor
- Indicators
-
Robert Gerald Wood
 Professional software developer of 25+ years, now building tools for myself and sharing them to the wider community.
 - Version: 1.5
- Updated: 23 November 2023
- Activations: 10
When trading using The Strat, it is important to keep an eye on multiple timeframes.
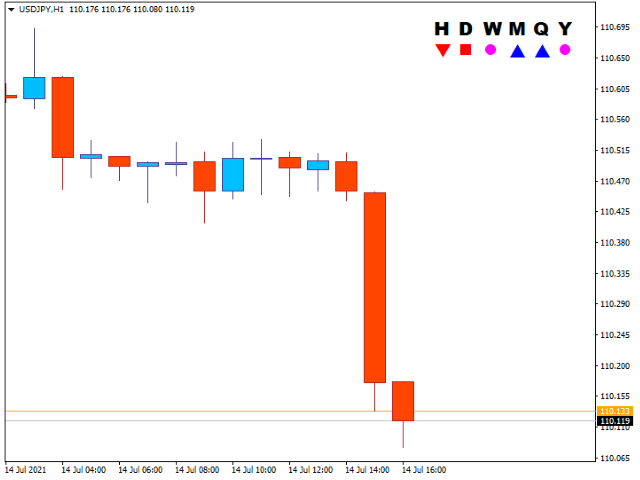
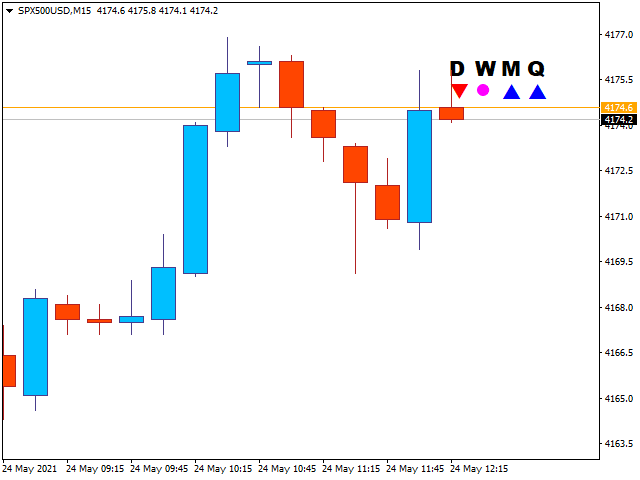
This indicator will show the Daily, Weekly, Monthly and Quarterly state of the current candle for each timeframe.
- A Circle icon shows that the candle on that timeframe is currently an Inside, or Type 1 in TheStrat terminology. An Inside Day candle is consolidating price action, and we are looking for a breakout of the range.
- A Triangle icon, pointing up or down, is a trending candle, or Type 2 in TheStrat terminology. A Trending candle can be either Bullish or Bearish, indicating that it has broken out of the previous candles range and is now trending in one direction.
- A Square icon is an Outside candle, or Type 3 in The Strat terminology. This indicates two things, one that price is undecided about direction on that timeframe, and likely quite choppy, and two, that on lower timeframes there are likely good opportunities for trading short reversals. The square will be either a Bullish or Bearish colour to show which side is currently winning.
The colours used for each icon can be configured to your tastes, and the size of the text and icons are also configurable.
SETTINGS
Timeframe Selections
ShowHourly
When True, shows the hourly candle state.
ShowDaily
When True, shows the daily candle state.
ShowWeekly
When True, shows the weekly candle state.
ShowMonthly
When True, shows the monthly candle state.
ShowQuarterly
When True, shows the quarterly candle state.
ShowYearly
When True, shows the yearly candle state.
Display Formatting
InsideFontColour
The colour to use when drawing inside (Type 1) candles.
BullishFontColour
The colour to use when drawing bullish trending (Type 2) or Outside (Type 3) candles.
BearishFontColour
The colour to use when drawing bullish trending (Type 2) or Outside (Type 3) candles.
HeaderFontName
The Font to use for Headings to the candle state icons.
FontSize
The size of font to use for the headings. This also controls the overall size of the indicator display.