Round Price Levels MT5
- Indicators
-
Robert Gerald Wood
 Professional software developer of 25+ years, now building tools for myself and sharing them to the wider community.
For more information on my products, visit https://www.bunnywood.co.uk - Version: 1.10
- Updated: 23 February 2026
- Activations: 10
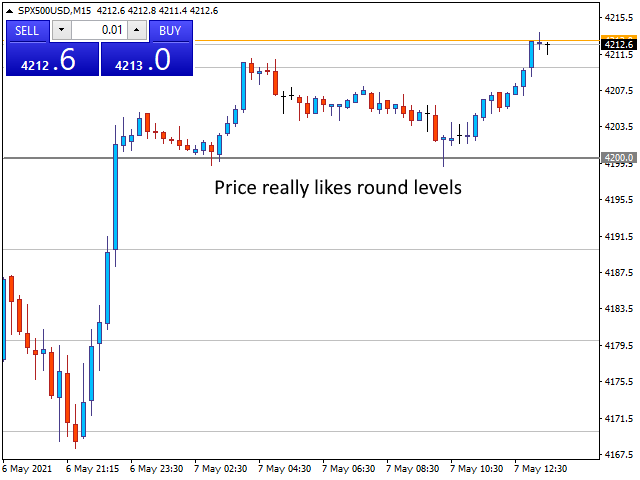
Markets really love round numbers and they often act as support in a falling market, or resistance as price rises.
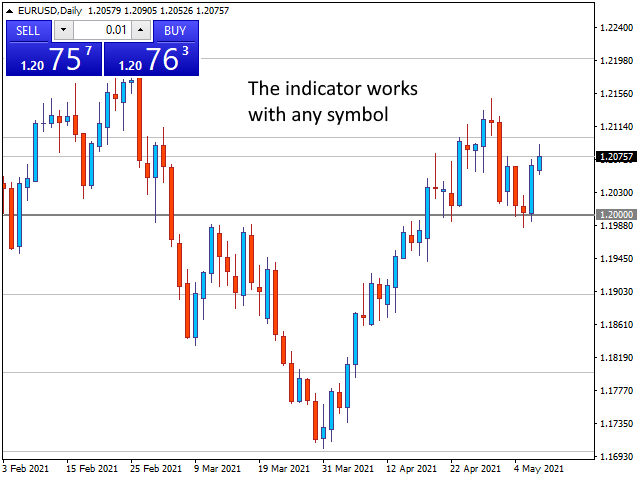
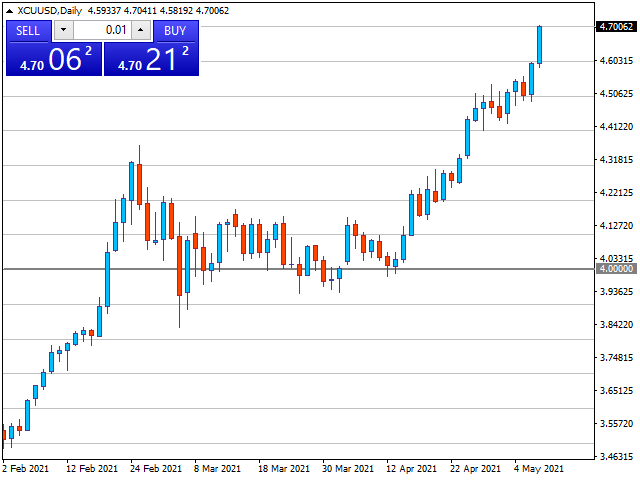
This indicator is designed to draw price levels at Round values. It does this automatically, but you also have the option to override that and determine the levels you wish to see.
A round level can be as simple as steps of 10, so 10, 20, 30 etc or if you are working with Forex, maybe you want to see changes at 0.1 or 0.01.
The indicator draws two classes of line, Major and Minor, each with a different format. This allows you to see changes between two different changes in level at the same time.
Alerting
The indicator includes the ability to sound alerts at either Major, Minor or both price levels when price comes within a configurable distance.
Automatic Setup
By default, the indicator will determine an appropriate level for both Major and Minor prices. It does that using a configurable DensityIndex setting which controls how many lines you want to see on screen at any time.
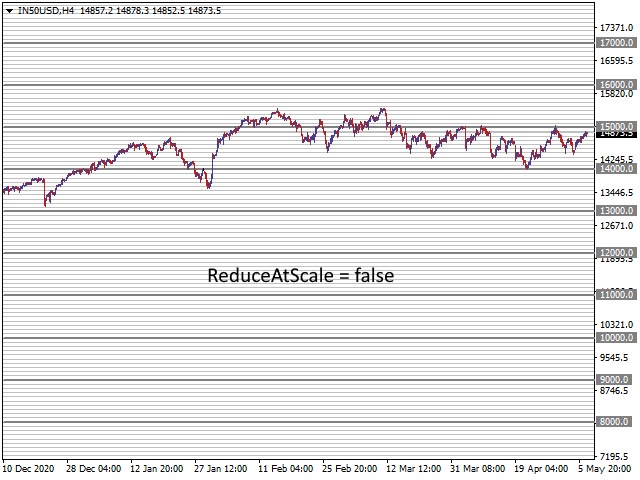
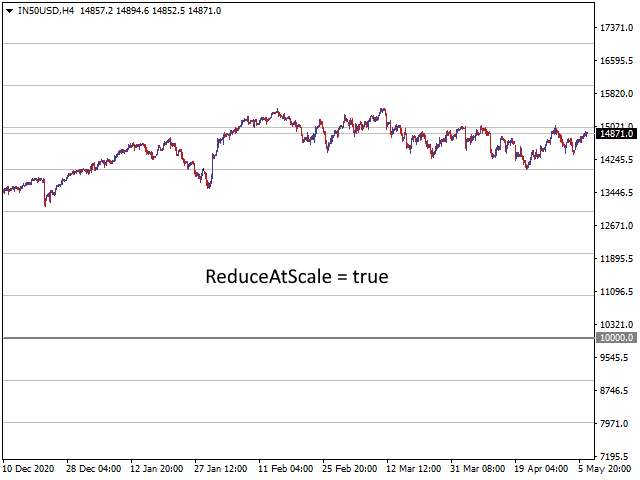
If you set your own scaling, using the MajorGap and MinorGap settings, you can still get the indicator to limit the number of lines drawn on screen by using the ReduceAtScale setting.
Please see the screenshots for a clearer idea of this feature.
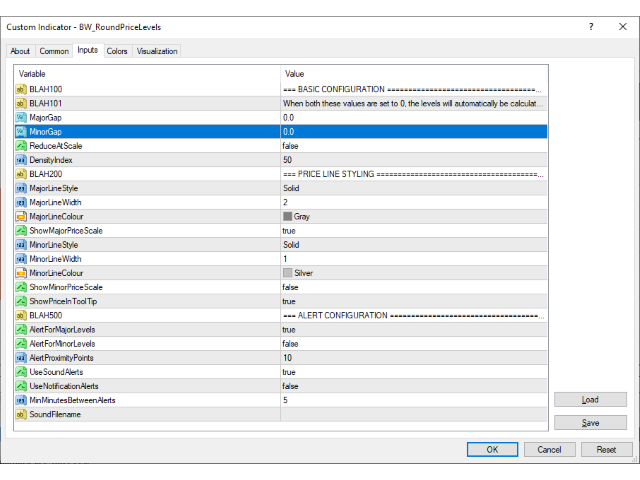
SETTINGS
BASIC CONFIGURATION
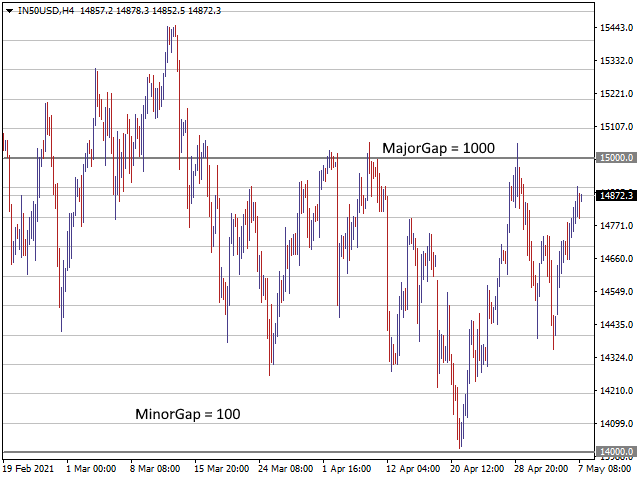
MajorGap
When set to 0.0, the indicator will calculate an appropriate scale automatically
MinorGap
When set to 0.0, the indicator will calculate an appropriate scale automatically
ReduceAtScale
When true, the indicator will take into account the scale of the chart and reduce the number of levels drawn if required.
DensityIndex
Maximum number of Minor values before automatically scaling down.
PRICE LINE STYLING
MajorLineStyle
The style of line to draw, solid, dotted, dashed. Select from the list of system supported values.
MajorLineWidth
The width of line to draw. If you wish to use a style other than SOLID, this value must be equal to 1.
MajorLineColour
The colour to draw the line.
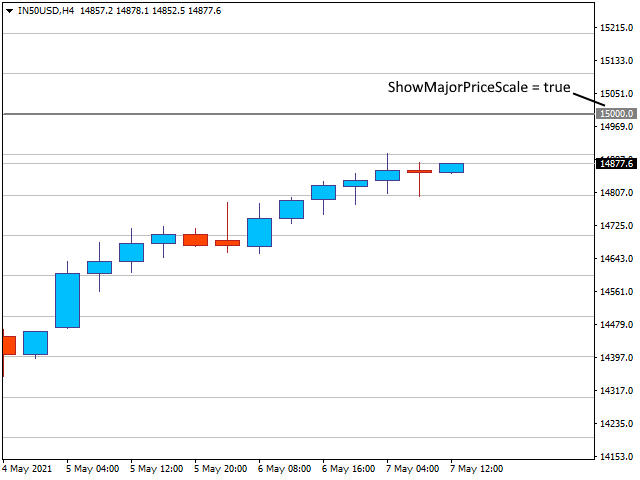
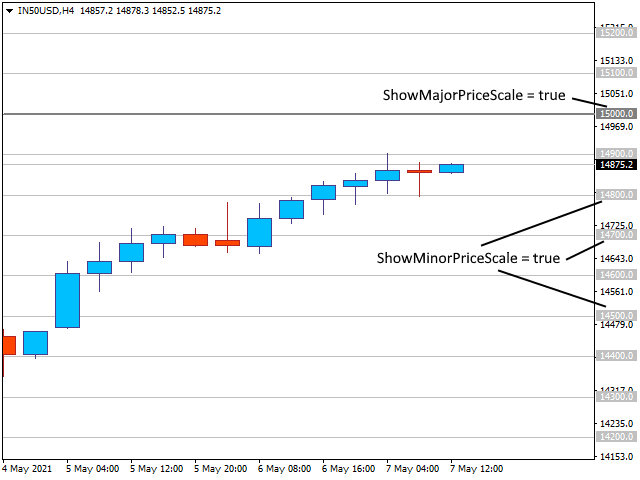
ShowMajorPriceScale
When true, the Major price levels will be highlighted in the price scale to the right of the chart.
MinorLineStyle
The style of line to draw, solid, dotted, dashed. Select from the list of system supported values.
MinorLineWidth
The width of line to draw. If you wish to use a style other than SOLID, this value must be equal to 1.
MinorLineColour
The colour to draw the line.
ShowMinorPriceScale
When true, the Minor price levels will be highlighted in the price scale to the right of the chart.
ShowPriceInToolTip
When true, the price value of the line will be show as a tooltip when the mouse cursor hovers over it. Useful if you have turned off the price scales.
ALERT CONFIGURATION
AlertForMajorLevels
When true, raises alerts for price proximity to Major price levels
AlertForMinorLevels
When true, raises alerts for price proximity to Minor price levels
AlertProximityPoints
How close current price has to be to a level to trigger an alert. Alert is raised if the current price is within AlertProximityPoints points of a level.
UseSoundAlerts
Make a sound when an alert is triggered.
UseNotificationAlerts
Send a notification using the MT4 notifications system when an alert is triggered. See the main menu Tools > Options then select the Notifications tab and setup in there. You will also need the Apple or Android app.
MinMinutesBetweenAlerts
After triggering an alert, the system will wait this many minutes before allowing another alert to fire.
SoundFilename
An alert sound is built in, but if you wish to use a different one, you can specify the filename here. Files must be in the terminal MQL/Files folder.