Active Pivot Levels
- Indicatori
-
Robert Gerald Wood
 Sviluppatore di software professionista da oltre 25 anni, ora costruisce strumenti per me stesso e li condivide con la comunità più ampia.
 - Versione: 1.30
- Aggiornato: 4 novembre 2021
- Attivazioni: 10
I livelli pivot sono un livello tecnico consolidato riconosciuto in ogni mercato.
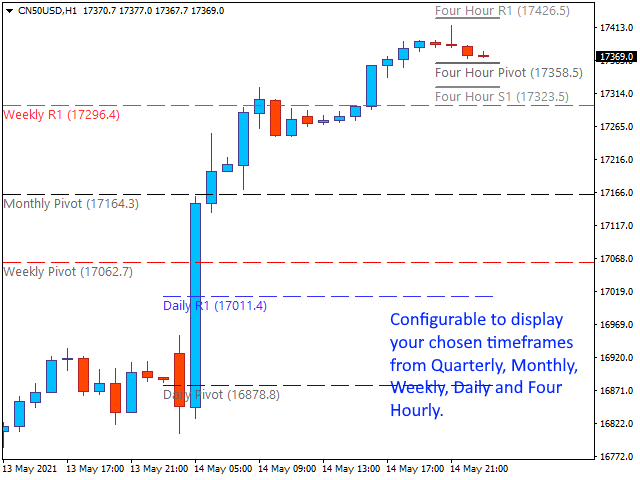
Questo indicatore disegnerà gli attuali pivot trimestrali, mensili, settimanali, giornalieri e quadriorari sul grafico, per qualsiasi simbolo. Puoi anche mostrare i livelli di Supporto e Resistenza per ogni periodo e scegliere quale visualizzare dal livello 1 al 4.
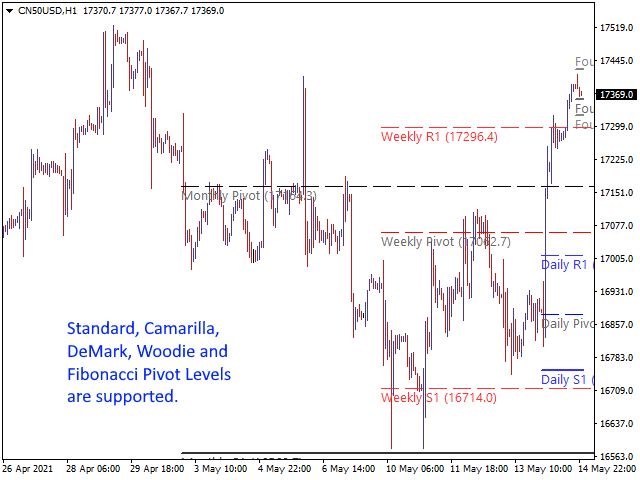
Scegli il tipo di Pivot tra:
- Standard
- Camarilla
- DeMark
- Woodie
- Fibonacci
Si prega di notare che i pivot DeMark hanno un unico livello di supporto e resistenza come da specifica originale.
Il muro indicatore cambia il modo in cui vengono tracciate le linee se la linea è stata toccata dal prezzo. Questo può essere molto utile e la forza del supporto o della resistenza delle linee diminuisce considerevolmente una volta toccata.
Puoi scegliere di mostrare il livello di pivot previsto per ciascuno dei periodi di tempo. Questo utilizzerà lo stesso calcolo dei normali pivot, ma funzionerà sui tempi attualmente incompleti. Pertanto, è meglio utilizzarlo verso la fine di quel periodo, quando il prezzo ha già coperto la maggior parte della sua gamma.
Impostazioni
https://www.mql5.com/en/blogs/post/746511
Questo è un indicatore molto configurabile, quindi puoi farlo funzionare come preferisci.
Another great indicator form this author. Runs perfectly, does not slow down MT4 like other pivot indicators. Fully customizable for all styles of trading whether you only need 1 pivot line or if you need many pivot and SR lines. Pivot line changes style once touched by price, great feature. New toggle button keeps your charts clean when you don't need to see the lines. Author is very responsive and helpful.