• Overview
  • Reviews
  • Comments
  • What's new

TheStrat FTFC

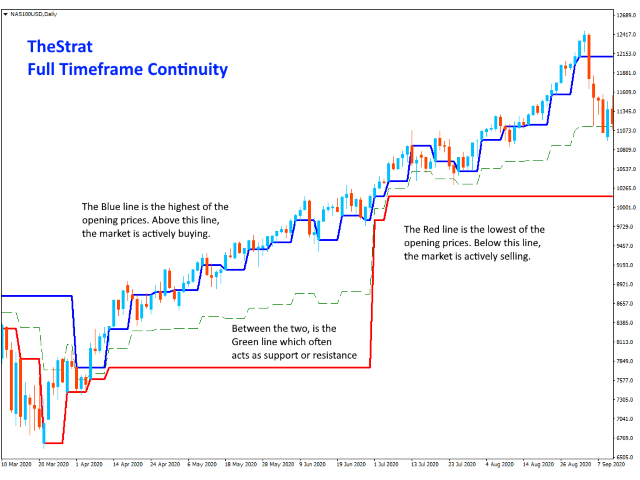
FTFC refers to Full Timeframe Continuity as defined by Rob Smith's The Strat.

This indicator draws two lines on the chart, one of the highest of the Quarterly, Monthly, Weekly, Daily or Hourly opening levels, and the second of the lowest of those values. This gives you a channel above or below which trading is more likely to be very strongly in one direction. Between the lines, price action will be choppier and you may with to use wider stops.

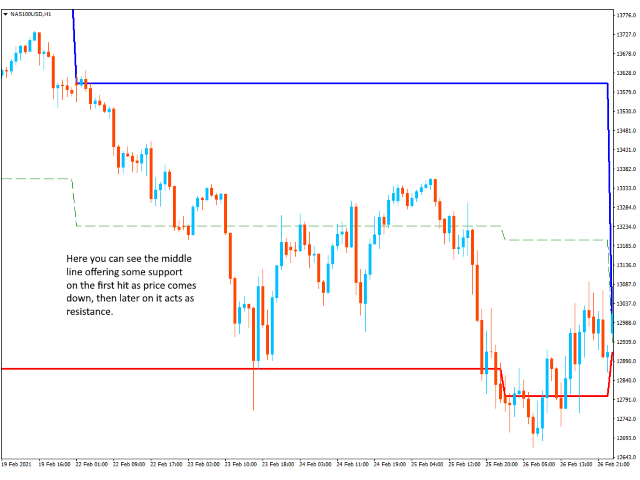
A third dashed line is also drawn to show the mid point between the highs and lows. This is often a good place to find support or resistance as the market tries to push price in a certain direction. This line can be turned off if you choose by setting the colour to NONE.


SETTINGS

IncludeQuarterlyLevel

Allows you to choose to include the Quarterly open price in the calculation as some people prefer to ignore it.

IncludeCurrentTimeframeOpen

When true, if the currently displayed timeframe is H1, D1, W1 or MN1, the indicator will include that periods open in its calculation. This is a new setting in the latest version of the indicator. Previously, the calculation did NOT include the current time period open, and this does not agree with TheStrat.

The setting is false by default, so existing users are unaffected unless they choose to turn it on.

MaxMilliSecondsToCalculate

For charts with a lot of history loaded (over 10,000 bars), this will limit the amount of time the indicator has to initialise. By default, the setting is 1500 milliseconds, which is 1.5 seconds. If the indicator has not managed to perform all its calculations for historical bars after that period, it will stop trying. This means you will always get a significant history, but be guaranteed that it does not cause your chart to stop.

Recommended products
Smooth price for Monarch MT4
Konstantin Gruzdev
3.67 (3)
The Smooth Price technical indicator is used for plotting a smoothed line as close to the price of the financial instrument as possible, and serves to eliminate its noise components. The indicator is part of the Monarch trading system, but here it is presented as an independent technical analysis tool. The indicator is based on the cluster digital filter , which, unlike the ClusterSMA , is applied directly to the price time series. Smooth Price does not redraw (except the very last, zero bar) an
999 USD
It is an oscillator with a filter by levels of support and maintenance this tool is designed for binary options it is very easy to use Has very good indicators of correct transactions 80-90% (this is the basis for the cost) Signals Red arrow directed downward signal to decrease Arrow of blue color directed upwards signal for an increase Recommended operating time: 1-2 candles Any: timeframe Trade Symbol: Any Session: Any It is not recommended to trade during the news release, the percentage of c
1 338 USD
Best Solution for any Newbie or Expert Trader! Forex Support Resistance  is a unique, high quality and affordable trading tool because we have incorporated a number of proprietary features. it calculate highest high and lowest low of Previous X bars with possibility to select timeframe as desired . also it display the values of highest high and lowest low of Previous bar as a comment at the main chart . Imagine how your trading will improve because you are able to pinpoint the exact trigger po
30 USD
Breakout Pro Scalper Solution This indicator is part of the   RPTrade Pro Solutions  systems. Breakout Pro Scalper Solution   is a daily trend indicator using Price Action, Dynamic Support and Resistances. It's designed to be used by anyone, even the absolute beginner in trading can use it. NEVER repaints . Indications are given  from close to close . Designed to  be used alone , no other indicators are required. Gives you the trend and potential Take Profit at the beginning of the day.
499 USD
Infinity Trend Pro
Yaroslav Varankin
1 (1)
This is a trend indicator without redrawing Developed instead of the binary options strategy (by the color of the Martingale candlestick) Also works well in forex trading When to open trades (binary options) A signal will appear in the place with a candle signaling the current candle It is recommended to open a deal for one candle of the current timeframe M1 and M5 When a blue dot appears, open a deal up When a red dot appears, open a trade down. How to open trades on Forex. When a signal is rec
1 000 USD
Daily Candle Predictor is an indicator that predicts the closing price of a candle. The indicator is primarily intended for use on D1 charts. This indicator is suitable for both traditional forex trading and binary options trading. The indicator can be used as a standalone trading system, or it can act as an addition to your existing trading system. This indicator analyzes the current candle, calculating certain strength factors inside the body of the candle itself, as well as the parameters of
65 USD
Globex 360 Scalping is a unique scalping indicator that shows price reversal points. With the help of this indicator, you will see on the chart when the price is reversing, and at this moment you can open deals in the direction of the signal. This is an indispensable assistant for both novice traders and professionals. This indicator shows the trader important and valuable information for effective trading. Globex 360 Scalping - Applies smooth scanning technology for market analysis. The indica
147 USD
We Trade Live Trend Candle Stick can help identify potential trend in the market when  trading, spot market trends and predict future prices.  We Trade Live Trend Candle Stick has a smoother look, as it is essentially taking an average of the movement.   candles will  stay RED during a downtrend and Green during an uptrend . We believe It's useful for making candlestick charts more readable and trends easier to analyse. As a breakout trader you are looking for trades that are ‘breaking out’ of
96 USD
This is the FXTraderariel TrendTrader .It analysis the trend and displays it, due to changing the changing the candle color. It took me over 12 Year to develop this system. But it shows the market perfect. Very easy to follow, even for beginners. It works on all Pairs and all Timeframes (however we advice only pro traders to trade smaller Timeframes, novice traders should stick to higher TF like H4 and D1). Depending on the settings it and trading style, it can be used for scalping or long-t
1 000 USD
The indicator builds current quotes, which can be compared with historical ones and on this basis make a price movement forecast. The indicator has a text field for quick navigation to the desired date. Options: Symbol - selection of the symbol that the indicator will display; SymbolPeriod - selection of the period from which the indicator will take data; IndicatorColor - indicator color; Inverse - true reverses quotes, false - original view; Next are the settings of the te
55 USD
Strong Runner Trade System   indicator is designed for trend and signal trading. This indicator generates trend signals.  It uses many algorithms and indicators to generate this signal. It tries to generate a signal from the points with the highest trend potential. This indicator is a complete trading product. This indicator does not need any additional indicators.  You can only trade with this indicator. The generated signals are displayed on the graphical screen.  Thanks to the alert features
50 USD
WanaScalper MT4
Isaac Wanasolo
1 (1)
A scalping indicator based on mathematical patterns, which on average gives signals with relatively small SL, and also occasionally helps to catch big moves in the markets (more information in the video) This indicator has three main types of notifications: The first type warns of a possible/upcoming signal on the next bar The second type indicates the presence of a ready signal to enter the market/open a position The third type is for SL and TP levels - you will be notified every time price r
1 350 USD
Limitless MT4
Dmitriy Kashevich
Limitless MT4 is a universal indicator suitable for every beginner and experienced trader. works on all currency pairs, cryptocurrencies, raw stocks Limitless MT4 - already configured and does not require additional configuration And now the main thing Why Limitless MT4? 1 complete lack of redrawing 2 two years of testing by the best specialists in trading 3 the accuracy of correct signals exceeds 80% 4 performed well in trading during news releases Trading rules 1 buy signa
1 399 USD
Gold Phoenix
Yaroslav Varankin
The perfect tool for Scalng in the Forex markets You can trade both from signal to signal and using take profit  The algorithm does not use Zigzag!  No redrawing!  This is a channel instrument that uses a moving average as a filter. Moving Average  There are 2 parameters for the settings Ma Period = 5 period Moving Average  Channel 1.0 distance of channel lines from the chart Price Signal Filter - calculation of signal opening and filter There is a complete set of Alert There is a multi-timefram
400 USD
This indicator uses support and resistance, volume and some special formula to calculate the volume to filter the candles. If the volume reaches a specific value, And at the same time, Candle breaks the support/resistance line, There would be a signal and we can enter the market. Signals appear when the current candle closes. then you can enter the trade when a new candle appears. Please don't forget to follow your money management plan. MT5 Version Support/Resistance Breakout MT5 :   https:
299 USD
Trend PA
Mikhail Nazarenko
5 (2)
The Trend PA indicator uses   Price Action   and its own filtering algorithm to determine the trend. This approach helps to accurately determine entry points and the current trend on any timeframe. The indicator uses its own algorithm for analyzing price changes and Price Action. Which gives you the advantage of recognizing, without delay, a new nascent trend with fewer false positives. Trend filtering conditions can be selected in the settings individually for your trading style. The indicator
55 USD
Smart Reversal Signal
Evgeny Belyaev
3 (2)
Smart Reversal Signal  is a professional indicator for the MetaTrader 4 platform; it has been developed by a group of professional traders. This indicator is designed for Forex and binary options trading. By purchasing this indicator, you will receive: Excellent indicator signals. Free product support. Regular updates. Various notification options: alert, push, emails. You can use it on any financial instrument (Forex, CFD, options) and timeframe. Indicator Parameters Perod - indicator calcula
36 USD
Insider Scalper Binary This tool is designed to trade binary options. for short temporary spends. to make a deal is worth the moment of receiving the signal and only 1 candle if it is m1 then only for a minute and so in accordance with the timeframe. the accuracy of this tool is about to 80% for better results, you need to select well-volatile charts.... recommended currency pairs eur | usd, usd | jpy .... the indicator is already configured, you just have to add it to the chart and tra
103 USD
BinaryUniversal
Andrey Spiridonov
BinaryUniversal is a signal indicator for binary options and Forex. In its work, the indicator uses a complex algorithm for generating signals. Before forming a signal, the indicator analyzes volatility, candlestick patterns, important support and resistance levels. The indicator has the ability to adjust the accuracy of the signals, which makes it possible to apply this indicator for both aggressive and conservative trading. The indicator is set in the usual way, it works on any time period and
1 200 USD
TSO Fibonacci Chains
Dionisis Nikolopoulos
5 (1)
Fibonacci retracement is a method of technical analysis for determining support and resistance levels. The TSO Fibonacci Chains Indicator is different from a simple Fibonacci Retracements indicator in that it provides the targets for each retracement level. In other words, there is an Extension Level (D) for every Retracement Level (C). In addition, if an Extension Level is reached, then a new Fibonacci setup is created automatically. These consecutive Fibonacci setups create a chain that reveal
199 USD
indicator for trading binary options and forex trading. The indicator does not redraw the readings. when trading binary options, testing was performed. This indicator showed the result up to 70% correct predictions. Under these conditions, the eur / usd m1 chart, when a signal appears, the transaction opens in the direction indicated by the indicator for 5 candles, then the truth is (5 minutes since in us the 1-minute chart of a candlestick is 1 minute) the result was. When trading in the f
50 USD
SAWA Equity Monitor
Alejandro Funes
5 (3)
SAWA Equity Monitor  is an indicator that allows you to visualize in a chart sub-window the balance, the equity and the margins of each moment on time. PARAMETERS: ______FILTERS______="______FILTERS______"; Only_Trading=false; Only_Current=false; Only_Buys=false; Only_Sells=false; Only_Magics=false; Magic_From=0; Magic_To=0; Only_Symbols=""; Only_Comment=""; ______PERIOD______="______PERIOD______"; Draw_Begin=D'2012.01.01 00:00'; Draw_End=D'2035.01.01 00:00'; {day,month,year,history}; Report_P
FREE
POWR Rise Coming
Trade Indicators LLC
This indicator is SO SIMPLE… when the green Rise Coming arrow appears, a price drop may be on the way! Plain and easy profits! As you receive more than one 'Rise Coming' text signal in a downtrend, it means momentum is building larger for a bull run. HOW TO USE 1. When the green "Rise Coming" text appears, a price jump may be on the way! This indicator Never Repaints! To get the best setting it's a matter of tweaking the indicator until it gives you the best results. Our recommendation, and what
197 USD
Fibonacci sequence is defined by integer sequence: 0, 1, 1, 2, 3, 5, 8, 13, 21, 34, 55, 89, 144, ... By definition, it starts from 0 and 1, the next number is calculated as a sum of two previous numbers. Instead of the standard moving average, the indicator uses the following calculation of average price: Bar0 + Bar1 + Bar2 + Bar3 + Bar5 + Bar8 + Bar13 + Bar21 + ... Input parameters FiboNumPeriod_1 - numbers in the following integer sequence for Fibo Moving Average 1. nAppliedPrice_1 - Close p
30 USD
It’s an amazing Forex and Binary option indicator 2022 from William Ramzy Com and different from any indicator because it depends on the impulse of the candle and detect if it bearish or bullish candle at once it open. The signal of indicator appears after price action, movement of the candle and price reversal on SNR levels conformations. You can trade with this Indicator in trendily market and sideway market. Because the accuracy of the signal there is NO MARTINGALE. Trade a
450 USD
It will be the best tool for you to make a profit! Through unique algorithms You're going to see an amazing amount of right trading signals Make huge profits every day and realize more possibilities!   Like the car no money to buy it, the love of the girls dare not to pursue?Or the credit card bill is not paid, the rent does not have the extra money to settle?Or are you fed up with being bossed around by your boss and Hope to get more people's respect?Can't afford to buy the things you want ? wa
149 USD
TradeighT
Lorenzo Monari
The #1 indicator for novice and advanced MANUAL TRADERS. FOR ALL BACKTESTABLE CROSSES. Indicator exclusively for MT4. www.tradeightrading.com The indicator adapts to all types of operativities. The indicator provides current take-profit prices on all timeframes. The indicator provides price levels for use with the price-action method and technical analysis. The indicator provides the future trend based on the amount and direction of the current take-profits. The indicator provides two types
1 111 USD
ReboltP
David Theodore Caro-greene
Rebalance Overlay Technology (Rebolt) enables the trader to visualize the flow of money from one chart to another chart. Rebolt Probability indicates the probability that money has flowed from one chart to another chart for a specified length of time over a number of intervals specified by the user. When Rebolt reads Cyan or Blue these are buying signs good for the length of time specified by the user or until a conflicting signal arises. When Rebolt reads Violet or Red there are selling signs
1 415.69 USD
5 signal in 1  Product     TimeFrame   Recommend   1m-5m recommend  signal   TF  5m    Banks Pro Binary Option is Indicator for binary option Can Use Manaul Trade or Robot on Platform  Mt2Trading  https://www.mt2trading.com/?ref=104    Time Trading   good work  EU session    Recommend  Curency   EUR  GBP USD        careful   AUD JPY      Recommend  Martingale 2-5 Step   Recommend  set profit  2%-5%/Day Setting Brake  News Event High volatility   recommend  15-30 min Have Problem Contract
120 USD
Auto Levels
Yaroslav Varankin
Auto Level this tool is able to determine the levels of support and resistance. search and display when the price has broken through the level and when it pushed off from it. the indicator can be useful if you use resistance support levels in your trading. or the highs and lows of the price, then it will greatly simplify your work and help you more quickly and more accurately determine the rebound or breakdown of the current trend or tendencies level. blue line bottom uptrend red line on top dow
500 USD
Buyers of this product also purchase
RelicusRoad Pro
Relicus LLC
4.94 (87)
How many times have you bought a trading indicator with great back-tests, live account performance proof with fantastic numbers and stats all over the place but after using it on your account, you end up blowing your account? You shouldn't trust a signal by itself, you need to know why it appeared in the first place, and that's where RelicusRoad Indicator comes in to save the day. NOW $147 ($602 DISCOUNT) - UNLIMITED ACCOUNTS (10 PCs LICENSE) - PRICE WILL INCREASE TO $749 SOON User Manual + St
147 USD
Ultimate Sniper Dashboard
Hispraise Chinedum Abraham
4.78 (18)
Discounted at $299! Prices may increase in the future! Read description below! Best Entry System for Ultimate Sniper Dashboard: ULTIMATE DYNAMIC LEVELS. (Please Check my products) The Ultimate Sniper Dashboard ONLY works on live markets due to MT4 multicurrency testing limits. Introducing the Ultimate-Sniper Dashboard! Our very best which contains both HA-Sniper, MA-Sniper. and many special modes. The Ultimate Sniper Dashboard is an absolute beast! Best Solution for any Newbie or Expert Trad
299 USD
Advanced Supply Demand
Bernhard Schweigert
4.94 (285)
CURRENTLY 26% OFF !! Best Solution for any Newbie or Expert Trader! This indicator is a unique, high quality and affordable trading tool because we have incorporated a number of proprietary features and a new formula. With this update, you will be able to show double timeframe zones. You will not only be able to show a higher TF but to show both, the chart TF, PLUS the higher TF: SHOWING NESTED ZONES. All Supply Demand traders will love it. :) Important Information Revealed Maximize the potenti
148 USD
CURRENTLY 26% OFF Best Solution for any Newbie or Expert Trader! This Indicator is a unique, high quality and affordable trading tool because we have incorporated a number of proprietary features and a new formula. With only ONE chart you can read Currency Strength for 28 Forex pairs! Imagine how your trading will improve because you are able to pinpoint the exact trigger point of a new trend or scalping opportunity? User manual: click here That's the first one, the original! Don't buy a worthle
148 USD
A top and bottom indicator that can intuitively identify the trend of the band. It is the best choice for manual trading, without redrawing or drifting. For any novice and programming trading friend, you can write the signal into the EA to play freely. Array 3 and array 4, for example, 3>4 turns green, 3<4 turns red. If you don't understand, please contact me. Original price of USD 198 ( current price of USD 69 ) - Next update price increase- unlimited account - do not forget to leave 5 star com
69 USD
Italo Volume Indicator
Italo Santana Gomes
4.96 (68)
BUY INDICATOR AND GET EA FOR FREE AS A BONUS + SOME OTHER GIFTS! ITALO VOLUME INDICATOR  is the best volume indicator ever created, and why is that? The Indicator works on all time-frames and assets, indicator built after 6 years of experience on forex and many other markets. You know many volume indicators around the internet are not complete, does not help, and it's difficult to trade, but the Italo Volume Indicator is different , the Italo Volume Indicator shows the wave volume, when market
65 USD
Scalper Vault
Oleg Rodin
5 (11)
Scalper Vault is a professional scalping system which provides you with everything you need for successful scalping. This indicator is a complete trading system which can be used by forex and binary options traders. The recommended time frame is M5. The system provides you with accurate arrow signals in the direction of the trend. It also provides you with top and bottom signals and Gann market levels. The indicators provides all types of alerts including PUSH notifications. Please contact me af
65 USD
Ultimate Dynamic Levels
Hispraise Chinedum Abraham
4.86 (7)
Discounted at $199 for early birds! Prices may increase in the future. Read description below. Introducing Ultimate Dynamic Levels - the BEST Entry Indicator for the Ultimate Sniper Dashboard! Extremely Low-Risk timely entries and high RR! Find the Ultimate Sniper Dashboard Here The most important ability for both beginner and pro traders is to tell exactly where and when a market is most likely to turn, and how to get in safely and exit with profits. The Ultimate Dynamic Levels indicator ea
199 USD
Currently 20% OFF ! Best Solution for any Newbie or Expert Trader! This dashboard software is working on 28 currency pairs. It is based on 2 of our main indicators (Advanced Currency Strength 28 and Advanced Currency Impulse). It gives a great overview of the entire Forex market. It shows Advanced Currency Strength values, currency speed of movement and signals for 28 Forex pairs in all (9) timeframes. Imagine how your trading will improve when you can watch the entire market using a single indi
199 USD
Entry Points Pro
Yury Orlov
4.72 (214)
Top indicator for MT4 providing accurate signals to enter a trade without repainting! It can be applied to any financial assets:  forex, cryptocurrencies, metals, stocks, indices.  MT5 version is here   It will provide pretty accurate trading signals and tell you when it's best to open a trade and close it. Watch  the video  (6:22) with an example of processing only one signal that paid off the indicator! Most traders improve their trading results during the first trading week with the help of
125 USD
This indicator is a super combination of our 2 products  Advanced Currency IMPULSE with ALERT  and  Currency Strength Exotics . It works for all time frames and shows graphically impulse of strength or weakness for the 8 main currencies plus one Symbol! This Indicator is specialized to show currency strength acceleration for any symbols like Gold, Exotic Pairs, Commodities, Indexes or Futures. Is first of its kind, any symbol can be added to the 9th line to show  true currency strength accelerat
149 USD
Owl smart levels
Sergey Ermolov
5 (7)
Indicator Guide   |  Owl Smart Levels Strategy  |  MT5 version  |  How to install?  | FAQ The Owl Smart Levels Indicator  is a complete trading system within the one indicator that includes such popular market analysis tools as  Bill Williams' advanced fractals , Valable ZigZag which builds  the correct wave structure  of the market, and  Fibonacci levels  which mark the exact levels of entry into the market and places to take profits. 7-day promotion - up to 42% discount.  For a detailed descr
107 USD
ICT, SMC, SMART MONEY CONCEPTS, SMART MONEY, Smart Money Concept, Support and Resistance, Trend Analysis, Price Action, Market Structure, Order Blocks, BOS/CHoCH,   Momentum Shift, HH/LL/HL/LH,    Fair Value Gap, FVG,  Premium  &   Discount   Zones, Fibonacci Retracement, OTE, Buy Side Liquidity, Sell Side Liquidity, BSL/SSL Taken, Equal Highs & Lows, MTF, Multiple Time Frame, BigBar, HTF OB, HTF Market Structure,  Liquidity Voids, Long Wicks, Candle Timer, Fractals, ZigZag, Time Zone, Market Se
63 USD
PRO Renko System
Oleg Rodin
5 (14)
PRO Renko System is a highly accurate trading system specially designed for trading RENKO charts. The ARROWS and Trend Indicators DO NOT REPAINT! The system effectively neutralizes so called market noise giving you access to accurate reversal signals. The indicator is very easy to use and has only one parameter responsible for signal generation. You can easily adapt the tool to any trading instrument of your choice and the size of the renko bar. I am always ready to provide extra support to help
75 USD
Advanced Currency IMPULSE with ALERT
Bernhard Schweigert
4.93 (458)
CURRENTLY 31% OFF !! Best Solution for any Newbie or Expert Trader! This indicator is a unique, high quality and affordable trading tool because we have incorporated a number of proprietary features and a secret formula. With only ONE chart it gives Alerts for all 28 currency pairs. Imagine how your trading will improve because you are able to pinpoint the exact trigger point of a new trend or scalping opportunity! Built on new underlying algorithms it makes it even easier to identify and confir
88 USD
Italo Trend Indicator
Italo Santana Gomes
4.78 (27)
BUY INDICATOR AND GET EA FOR FREE AS A BONUS + SOME OTHER GIFTS! ITALO TREND INDICATOR  is the best trend indicator on the market, the Indicator works on all time-frames and assets, indicator built after 6 years of experience on forex and many other markets. You know many trend indicators around the internet are not complete, does not help, and it's difficult to trade, but the Italo Trend Indicator is different , the Italo Trend Indicator shows the signal to buy or sell, to confirm the signal t
65 USD
AW Trend Predictor
Alexander Nechaev
4.82 (28)
The combination of trend and breakdown levels in one system. An advanced indicator algorithm filters market noise, determines the trend, entry points, as well as possible exit levels. Indicator signals are recorded in a statistical module, which allows you to select the most suitable tools, showing the effectiveness of the signal history. The indicator calculates Take Profit and Stop Loss marks. Manual and instruction -> Here / MT5 version -> Here How to trade with the indicator:  Trading with T
55 USD
Supply and Demand Dashboard PRO
Bernhard Schweigert
4.79 (19)
Currently 20% OFF ! This dashboard is a very powerful piece of software working on multiple symbols and up to 9 timeframes. It is based on our main indicator (Best reviews:   Advanced Supply Demand ). The dashboard gives a great overview. It shows: Filtered Supply and Demand values including zone strength rating, Pips distances to/and within zones, It highlights nested zones, It gives 4 kind of alerts for the chosen symbols in all (9) time-frames. It is highly configurable for your personal
199 USD
Please send me Direct message on MQL5 CHAT after purchasing the Indicator for Training and Installation Support There are some additional files that is important to use with the Indicator . So be sure to contact me after purchasing the Indicator So that I can add you for training and support . If you find any difficulty with installation then send me Direct message here So that I can connect with you via Anydesk or Teamview for the product installation. " Smart Order Block Indicator " to find
249 USD
Currency Strength Exotics
Bernhard Schweigert
5 (23)
CURRENTLY 20% OFF ! Best Solution for any Newbie or Expert Trader! This Indicator is specialized to show currency strength for any symbols like Exotic Pairs Commodities, Indexes or Futures. Is first of its kind, any symbol can be added to the 9th line to show true currency strength of Gold, Silver, Oil, DAX, US30, MXN, TRY, CNH etc. This is a unique, high quality and affordable trading tool because we have incorporated a number of proprietary features and a new formula. Imagine how your trading
128 USD
Scalper Inside PRO
Alexey Minkov
4.67 (42)
This is an innovative indicator that uses an exclusive algorithm to quickly and accurately determine the trend. The indicator automatically calculates the opening and closing time of positions, as well as detailed statistics of the indicator's performance for a certain period of history, which allows you to choose the best trading tool for your trade. You can also connect your custom arrow indicators to Scalper Inside Pro to check and calculate their statistics and profitability. Scalper Inside
139 USD
Cycle Sniper
Elmira Memish
4.63 (30)
NEW YEAR SALE PRICE FOR LIMITED TIME!!! Please contact us after your purchase and we will send you the complimentary indicators to complete the system. Cycle Sniper is not a holy grail but when you use it in a system which is explained in the videos, you will feel the difference. If you are not willing to focus on the charts designed with Cycle Sniper and other free tools we provide, we recommend not buying this indicator. We recommend watching the videos about the indiactor and system before
200 USD
FFXMV Dashboard Plus
Opengates Success International
Full Forex Market View Dashboard Plus This is a custom indicator created to give Traders a full view of what is going on in the market. It uses a real time data to access the market and display every bit of information needed to make successful trading. The PLUS there to produce the kind of RESULTS as you see in the SCREENSHOTS, I added a MultipleOrder Utility EA with it with instructions on how to use it with FFXMV Dashboard. INSTALLATION : Read the MANUALS that comes with the rest of the
850 USD
TakePropips Donchian Trend Pro
Eric John Pajarillaga Aldana
4.73 (11)
TakePropips Donchian Trend Pro  (MT4) is a powerful and effective tool that automatically detects the direction of the trend using the Donchian Channel and provides you with an entry and exit trading signals! This multi-function indicator includes a trend scanner, trading signals, statistical panel, screener, trading sessions, and alerts history dashboard. It is designed to provide you with trading signals and save you hours analyzing the charts! You can download the user manual and installation
99 USD
Full Forex Market View Dashboard
Opengates Success International
5 (2)
FULL FOREX MARKET VIEW Dashboard Indicator This is a custom indicator created to give Traders a full view of what is going on in the market. It uses a real time data to access the market and display every bit of information needed to make successful trading. INSTALLATION : Before attaching this Indicator to your window chart, go to your MT4's Market Watch panel and HIDE all the Currency pairs you don't need or trade and leave the rest there. The reason is that FFMV Dashboard will DISPLAY ALL the
650 USD
M1 Arrow
Oleg Rodin
5 (5)
Please contact me after purchase! I will share my trading tips with you and great bonus indicators for free! This is an intraday strategy based on two fundamental principles of the market.  Trading is conducted on M1 charts, though it is possible to use other time frames as well. The algorithm is based on the analysis of volumes and price waves using additional filters. The intelligent algorithm of the indicator gives a signal only when two market factors combine into one. The indicator calcula
65 USD
TrendLine PRO MT4
Evgenii Aksenov
4.88 (249)
The Trend Line PRO indicator is an independent trading strategy. It shows the trend change, the entry point to the transaction, as well as automatically calculates three levels of Take Profit and Stop Loss protection Trend Line PRO is perfect for all Meta Trader symbols: currencies, metals, cryptocurrencies, stocks and indices Advantages of Trend Line PRO Never redraws its signals The possibility of using it as an independent strategy It has three automatic levels Take Profit and Stop Loss leve
75 USD
Auto Order Block with break of structure Detect Break of Structure , Mark Order Block and draw Entry / Stop and Risk to Reward lines when Order block is touch by price with Alert. Trend is Manually set to filter signals in a direction by a button on the chart. Entry / Stop and Risk to Reward lines can also be switch on / off by button on chart. Futures Auto Mark Break of Structure Auto Mark Order block Auto Mark higher time frame Point Of  Interest ( POI ) Popup Alert when BoS , Order block a
55 USD
Weis Wave with Alert
Panagiotis Diamantopoulos
4.78 (18)
20% Off from 499$ to 399$, offer end 31/3/2023    https://youtu.be/RjSSW0byp-I ** NEW PLUTUS SIGNALS and ALL IN ONE ** Wychoff's UpThrust + Spring, Fake Breaks and Plutus  trading signals added (for more info visit  http://www.tradethevolumewaves.com  ) Different Wave Types, choose what your cumulative Histogram diplays: Volume, Pips, Progressive Volume Rate, Time or Emphasized Volume Waves  **IF YOU PURCHASE DO NOT FORGET TO CONTACT ME BECAUSE THERE IS MORE: Two Hrs Webinar + Training Room
399 USD
CyberZingFx Volume Plus
Afsal Meerankutty
4.93 (15)
Advanced version of CyberZingFx Volume Plus, the ultimate MT4 indicator for traders seeking highly accurate buy and sell signals. With an additional strategy and price action dot signals that enhances its effectiveness, this indicator offers a superior trading experience for professionals and beginners alike. The CyberZingFx Volume Plus Advanced version combines the power of volume analysis and historical price data with an additional strategy, resulting in even more precise and reliable signals
135 USD
More from author
TheStrat Patterns
Robert Gerald Wood
This indicator will draw patterns based on Rob Smith's The Strat as they emerge in real time on your chart. As price evolves, TheStrat offers 18 distinct price action patterns that can help you get good entries in the market. Each pattern involves two or three candles, and this indicator will draw a bounding box around the candles and name the pattern. The indicator also shows when a potential setup is forming, known by stratters as an Actionable signal. Candles Each candle is defined by i
90 USD
Multi Chart Crosshairs MT5
Robert Gerald Wood
5 (4)
This indicator is designed to make reviews of many charts on different timescales quicker, and easier to do. Track Time and Price across multiple charts Change Symbol on one chart and all other charts of the same symbol will be changed too. Easy to use, quick to master The indicator allows you to identify the price and time where the mouse pointer is on the current chart, across all other charts open on the same Symbol. This allows you to quickly see information on multiple charts whereas norma
30 USD
TheStrat Levels
Robert Gerald Wood
This indicator draws the prior Highs and Lows for multiple timeframes, and can display potential Take Profit and Stop Loss levels. In Rob Smith's # The Strat   terms,   these are potential entry points, or alternatively potential targets for open positions. I like to use them in both ways. On a lower timeframe, say 5 minutes to get a good entry on a daily or weekly level, and then as a potential target. Very small stops required giving an excellent risk/reward ratio. Please watch the DEMO video
90 USD
Multi Chart Crosshairs
Robert Gerald Wood
5 (1)
This indicator is designed to make reviews of many charts on different timescales quicker, and easier to do. Track Time and Price across multiple charts Change Symbol on one chart and all other charts of the same symbol will be changed too. Easy to use, quick to master The indicator allows you to identify the price and time where the mouse pointer is on the current chart, across all other charts open on the same Symbol. This allows you to quickly see information on multiple charts whereas normal
30 USD
TheStrat Monitor
Robert Gerald Wood
5 (1)
If you've not already learnt about The Strat trading strategy , go google it now. I promise it won't be a waste of your time, and you will likely learn some new tricks whether you use it or not. OK, so now you know what TheStrat is, you will be able to understand what this indicator can do for you. Key Features In short, the Indicator will: Show Timeframe Continuity for all supported timeframes Supports two timeset views, Day trader and Swing trader Show when Full Timeframe Continuity is in pl
150 USD
Range Exhaustion
Robert Gerald Wood
Range Exhaustion occurs when price meets or exceeds the expected range for the current period. At these levels, price starts to lose its momentum relative to earlier in the period, so its a good point to make sure you are not taking new positions. This indicator will show you where this is likely to happen on your chart, showing levels for Daily, Weekly and Monthly periods. When you see price exceeding these exhaustion levels, it's telling you that the momentum behind the move is very strong an
60 USD
When trading using The Strat , it is important to keep an eye on multiple timeframes. This indicator will show the Daily, Weekly, Monthly and Quarterly state of the current candle for each timeframe. A Circle icon shows that the candle on that timeframe is currently an Inside, or Type 1 in TheStrat terminology. An Inside Day candle is consolidating price action, and we are looking for a breakout of the range. A Triangle icon, pointing up or down, is a trending candle, or Type 2 in TheStrat termi
30 USD
Chart Drawing Cloner
Robert Gerald Wood
5 (4)
This Script allows you to copy drawing objects of any type, like trend lines, Fibonachi Retracements etc, to one or more other charts. By default, the script will copy all the objects on the current chart, that is the chart the script was applied to, to any other chart of the same Symbol currently loaded. Settings DestinationTimeframe When set to anything other than PERIOD_CURRENT, then it will copy the objects to any open chart of the same Symbol as the chart the script was applied to. If
FREE
ATR Extremes
Robert Gerald Wood
Average True Range (ATR) is a commonly used indicator that measures the amount of movement in price over a set duration. However the value it gives is not defined within any sort of boundary, which makes using it for anything other than stop loss or take profit calculations, almost impossible. This indicator is your standard ATR indicator, but we have introduced percentile demarcations so you can see the extremes. You can choose between Percentiles and something we call Split Medians Percentile
30 USD
Round Price Levels
Robert Gerald Wood
Markets really love round numbers and they often act as support in a falling market, or resistance as price rises. This indicator is designed to draw price levels at Round values. It does this automatically, but you also have the option to override that and determine the levels you wish to see. A round level can be as simple as steps of 10, so 10, 20, 30 etc or if you are working with Forex, maybe you want to see changes at 0.1 or 0.01. The indicator draws two classes of line, Major and Minor, e
40 USD
A simple script that can delete all the drawing objects on a chart, or just the objects of a specific type. Settings: DeleteObjectsOfType By default the value will be blank which means ALL drawing objects on the chart will be deleted. If you only wish to delete specific types of drawing object, change this setting to the type of object to delete. For example, Fibonacci Retracement, Text, Label or Trend Line. Please see the demonstration video for more information.
FREE
TheStrat Candles
Robert Gerald Wood
4 (1)
This indicator will draw a label above or below each candle based on   Rob Smith's   The Strat   as they develop over time on your chart. As price evolves, a candle can switch between three states. When the candle first opens, if it sits completely within the previous candles high and low, then it will start as a Type 1. As time moves on, if it breaks either the high or low of the previous candle, it will be come a type 2, and should the price action be volatile and directionless, it may then
30 USD
I created this simple indicator while I was learning about Rob Smith's TheStrat and find it so helpful, I thought I would share it with you. If you find it useful, please look at the other indicators I have published on MQL5. The indicator simply draws a single line on the chart showing the price level you select from a higher timeframe. Using the settings you have full control over the timeframe it displays but b y default, it calculates the higher timeframe itself, just moving up the scale by
FREE
This script allows you to toggle the "Show Trade Levels" option, but for the current chart only. Normally, you can only change the setting using the Options -> Chart menu for ALL charts, but this script allows you to do it for a SINGLE chart. I'm using it when I take screenshots, because most of the time I'm not trying to show the trades, just some functionality of one of my other tools. Iif you need that functionality, then this script is very helpful! If the script helps you, please let me
FREE
Active Pivot Levels
Robert Gerald Wood
5 (1)
Pivot levels are a well established technical level that's recognised in every market. This indicator will draw the current Quarterly, Monthly, Weekly, Daily and four-hourly pivots on the chart, for any symbol. You can also show the Suppport and Resistance levels for each period and choose which to display from levels 1 to 4.   Choose the type of Pivot from: Standard Camarilla DeMark Woodie Fibonacci Please note, DeMark pivots have a single Support and Resistance level as per the original speci
50 USD
This indicator will draw a label above or below each candle based on   Rob Smith's   The Strat   as they develop over time on your chart. As price evolves, a candle can switch between three states. When the candle first opens, if it sits completely within the previous candles high and low, then it will start as a Type 1. As time moves on, if it breaks either the high or low of the previous candle, it will be come a type 2, and should the price action be volatile and directionless, it may then
30 USD
This indicator draws the prior Highs and Lows for multiple timeframes, and can display potential Take Profit and Stop Loss levels. In Rob Smith's # The Strat  terms, these are potential entry points, or alternatively potential targets for open positions. I like to use them in both ways. On a lower timeframe, say 5 minutes to get a good entry on a daily or weekly level, and then as a potential target. Very small stops required giving an excellent risk/reward ratio. Key Features  - Levels from Ho
90 USD
TheStrat FTFC MT5
Robert Gerald Wood
FTFC refers to Full Timeframe Continuity as defined by Rob Smith's  The Strat  . This indicator draws two lines on the chart, one of the highest of the Quarterly, Monthly, Weekly, Daily or Hourly opening levels, and the second of the lowest of those values. This gives you a channel above or below which trading is more likely to be very strongly in one direction. Between the lines, price action will be choppier and you may with to use wider stops. A third dashed line is also drawn to show the mid
50 USD
This indicator will draw patterns based on   Rob Smith's   The Strat   as they emerge in real time on your chart. As price evolves,   TheStrat   offers 18 distinct price action patterns that can help you get good entries in the market. Each pattern involves two or three candles, and this indicator will draw a bounding box around the candles and name the pattern. The indicator also shows when a potential setup is forming, known by stratters as an Actionable signal. Candles Each candle is de
90 USD
If you've not already learnt about The Strat trading strategy , go google it now. I promise it won't be a waste of your time, and you will likely learn some new tricks whether you use it or not. OK, so now you know what TheStrat is, you will be able to understand what this indicator can do for you. Key Features In short, the Indicator will: Show Timeframe Continuity for all supported timeframes Supports two timeset views, Day trader and Swing trader Show when Full Timeframe Continuity is in pl
150 USD
When trading using  The Strat , it is important to keep an eye on multiple timeframes. This indicator will show the Daily, Weekly, Monthly and Quarterly state of the current candle for each timeframe. A Circle icon shows that the candle on that timeframe is currently an Inside, or Type 1 in TheStrat terminology. An Inside Day candle is consolidating price action, and we are looking for a breakout of the range. A Triangle icon, pointing up or down, is a trending candle, or Type 2 in TheStrat term
30 USD
Pivot levels are a well established technical level that's recognised in every market. This indicator will draw the current Quarterly, Monthly, Weekly, Daily and four-hourly pivots on the chart, for any symbol. You can also show the Suppport and Resistance levels for each period and choose which to display from levels 1 to 4.   Choose the type of Pivot from: Standard Camarilla DeMark Woodie Fibonacci Please note, DeMark pivots have a single Support and Resistance level as per the original specif
50 USD
Markets really love round numbers and they often act as support in a falling market, or resistance as price rises. This indicator is designed to draw price levels at Round values. It does this automatically, but you also have the option to override that and determine the levels you wish to see. A round level can be as simple as steps of 10, so 10, 20, 30 etc or if you are working with Forex, maybe you want to see changes at 0.1 or 0.01. The indicator draws two classes of line, Major and Minor,
40 USD
ATR Extremes MT5
Robert Gerald Wood
Average True Range (ATR) is a commonly used indicator that measures the amount of movement in price over a set duration. However the value it gives is not defined within any sort of boundary, which makes using it for anything other than stop loss or take profit calculations, almost impossible. This indicator is your standard ATR indicator, but we have introduced percentile demarcations so you can see the extremes. You can choose between Percentiles and something we call Split Medians Percentile
30 USD
Range Exhaustion occurs when price meets or exceeds the expected range for the current period. At these levels, price starts to lose its momentum relative to earlier in the period, so its a good point to make sure you are not taking new positions. This indicator will show you where this is likely to happen on your chart, showing levels for Daily, Weekly and Monthly periods. When you see price exceeding these exhaustion levels, it's telling you that the momentum behind the move is very strong an
60 USD
Filter:
No reviews
Reply to review
Version 1.2 2021.06.16

New Setting - IncludeCurrentTimeframeOpen

When true, if the currently displayed timeframe is H1, D1, W1 or MN1, the indicator will include that periods open in its calculation. This is a new setting in the latest version of the indicator. Previously, the calculation did NOT include the current time period open, and this does not agree with TheStrat.

The setting is false by default, so existing users are unaffected unless they choose to turn it on.

New Setting - MaxMilliSecondsToCalculate

For charts with a lot of history loaded (over 10,000 bars), this will limit the amount of time the indicator has to initialise. By default, the setting is 1500 milliseconds, which is 1.5 seconds. If the indicator has not managed to perform all its calculations for historical bars after that period, it will stop trying. This means you will always get a significant history, but be guaranteed that it does not cause your chart to stop.
Version 1.1 2021.05.31
Fix for occasional slowness issue when on a lower timeframe.