TheStrat Monitor MT5
- Indicators
-
Robert Gerald Wood
 Professional software developer of 25+ years, now building tools for myself and sharing them to the wider community.
For more information on my products, visit https://www.bunnywood.co.uk - Version: 1.21
- Updated: 22 October 2021
- Activations: 10
If you've not already learnt about The Strat trading strategy, go google it now. I promise it won't be a waste of your time, and you will likely learn some new tricks whether you use it or not.
OK, so now you know what TheStrat is, you will be able to understand what this indicator can do for you.
Key Features
In short, the Indicator will:
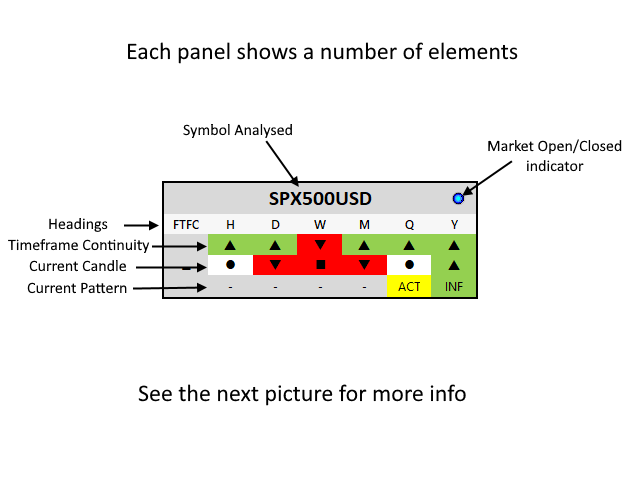
- Show Timeframe Continuity for all supported timeframes
- Supports two timeset views, Day trader and Swing trader
- Show when Full Timeframe Continuity is in place for any 4 consecutive timeframes
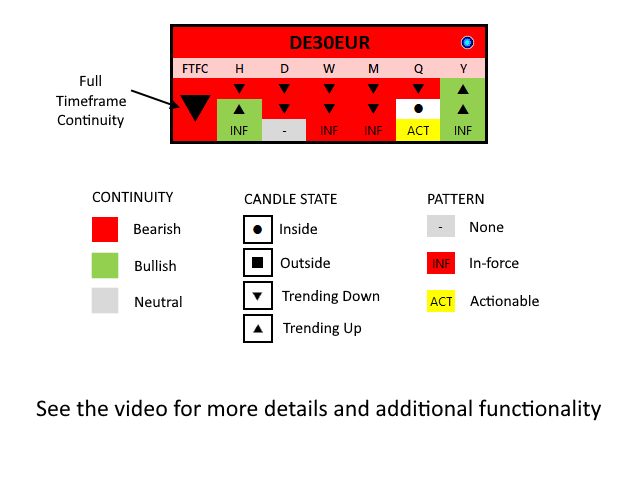
- Show the current candle state for each timeframe
- Show the current pattern, if any, on all timeframes
- Shows both In-force and Actionable patterns
- Update every 5 seconds (configurable from 1 second)
- Allows you to click on the panel to open a chart on the selected symbol and timeframe
- You can choose what chart template will be used to open charts
- You choose what groups and symbols in those groups to display
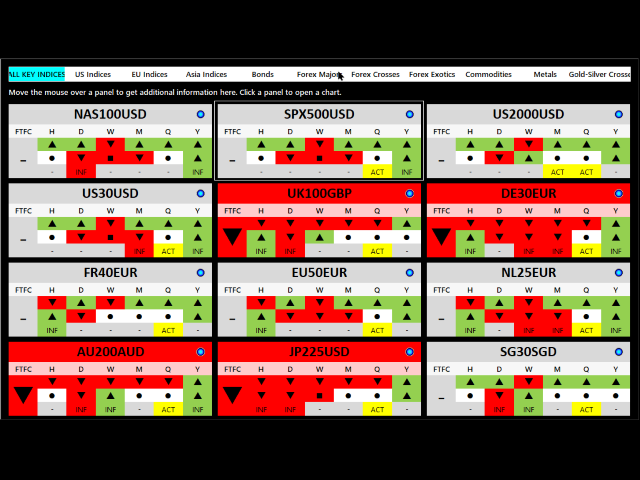
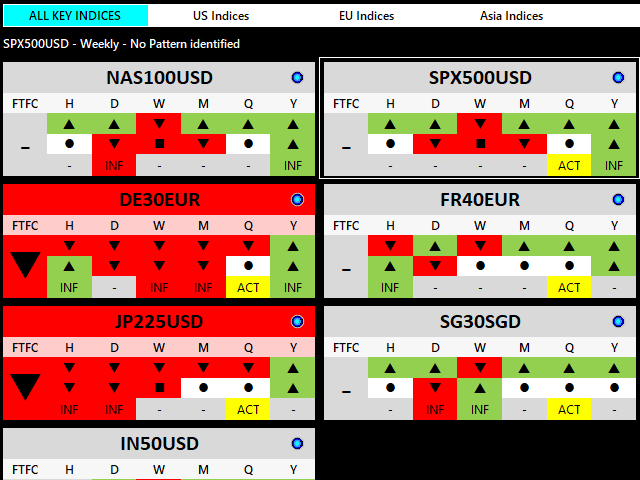
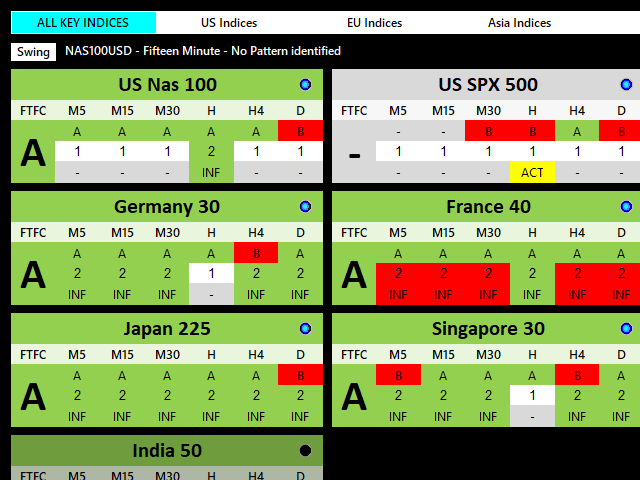
The indicator displays a snapshot overview of all the key Strat elements , Timeframe continuity, current patterns, and current candle states, of any symbol supported by your broker. It does this for all supported timeframes so you can see exactly what's happening right now in the market.
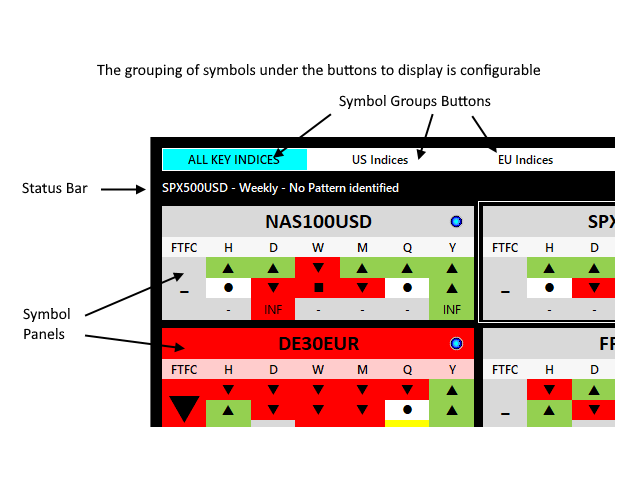
You can group the symbols as you wish and choose the title of the buttons relating to each group. Having all the symbols of a particular type on screen at the same time allows you to spot similarities across the group, aiding your analysis.
More information on the Configuration File can be found here: https://www.mql5.com/en/blogs/post/746142
If a symbol is currently un-tradable, market closed, broker disabled etc. then the symbol panel will show the latest available data but gray out the display. A small LED light icon also shows this.
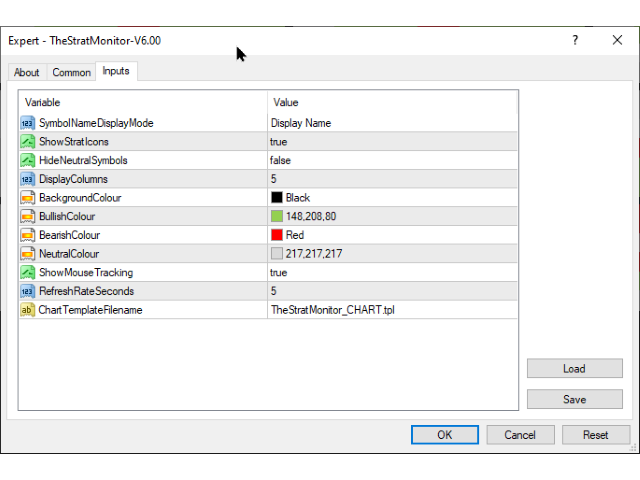
SETTINGS
SymbolNameDisplayMode
Choose from Name, Description or Both for the caption of each symbol panel.
Timeset
Sets the default timeset view for the indicator. Choose from Day Trader or Swing Trader. You can change this setting at any time by clicking the button on screen.
The Day Trader view shows the M5, M15, M30, H1, H4 and D1 timeframes on each panel whereas the Swing Trader view shows H1, D1, W1, MN1, Q and Y.
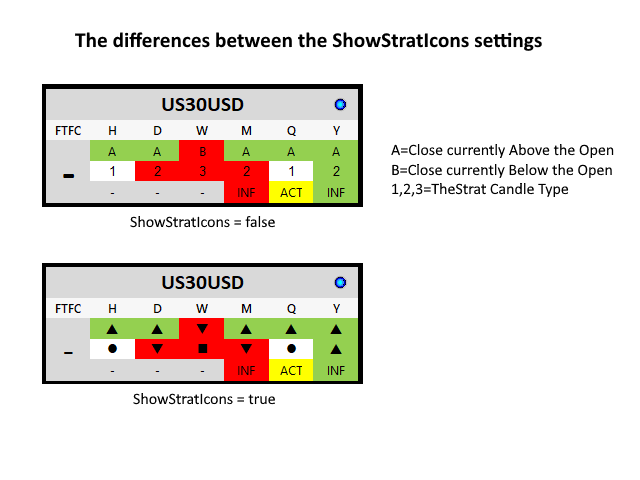
ShowStratIcons
When true, the panels display Icons for the continuity direction, current candle states, patterns and overall FTFC.
HideNeutralSymbols
When true, any symbols which don't have an FTFC direction are hidden.
DisplayColumns
How many columns of panel do you wish to display in the chart.
ShowMouseTracking
When true, an outline is drawn round the symbol panel that the mouse is currently over.
RefreshRateSeconds
The default is 5 which simply means the data for each panel is updated every 5 seconds. The value must be a positive integer, so something greater than 0
ChartTemplateFilename
The filename of the template to use when opening a chart. If the template given cannot be found, the default template will be used.
BackgroundColour
BullishColour
BearishColour
NeutralColour
Choose the colour you wish to use from the standard MetaTrader selection.
Great help for filtering markets to improve probability