TheStrat Patterns
- Indicators
-
Robert Gerald Wood
 Professional software developer of 25+ years, now building tools for myself and sharing them to the wider community.
For more information on my products, visit https://www.bunnywood.co.uk - Version: 1.40
- Updated: 28 July 2021
- Activations: 10
This indicator will draw patterns based on Rob Smith's The Strat as they emerge in real time on your chart.
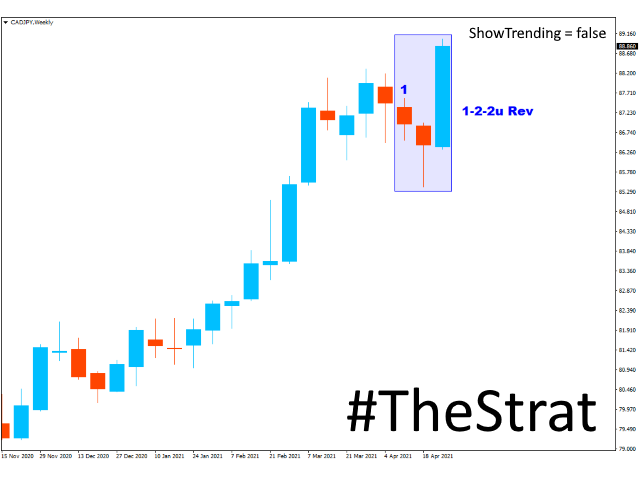
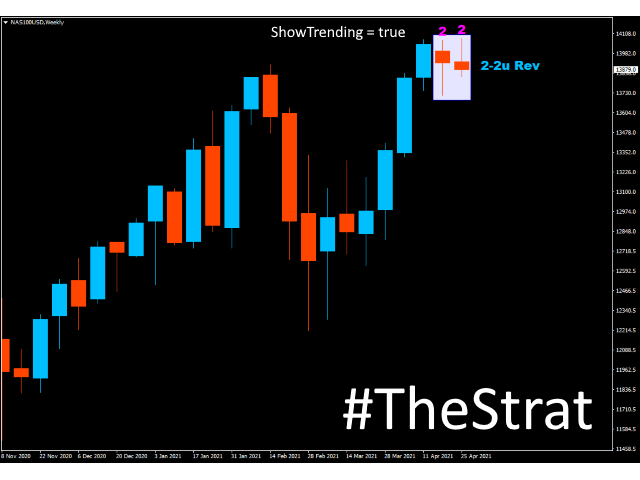
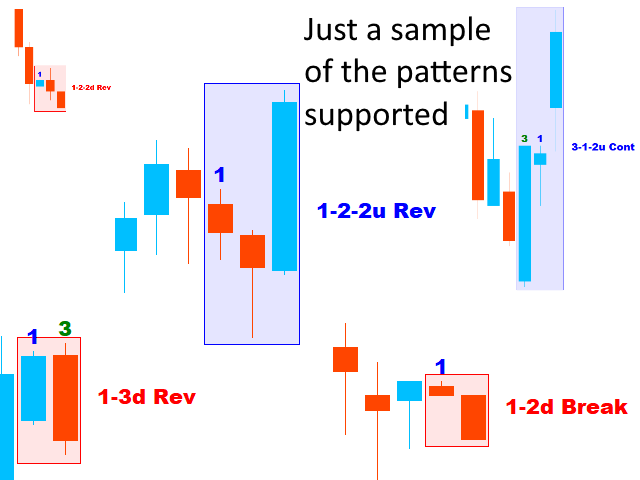
As price evolves, TheStrat offers 18 distinct price action patterns that can help you get good entries in the market. Each pattern involves two or three candles, and this indicator will draw a bounding box around the candles and name the pattern.
The indicator also shows when a potential setup is forming, known by stratters as an Actionable signal.
Candles
Each candle is defined by its relationship to the previous candle.
Type 1 - Inside candle - The candle is entirely within the high and low of the previous candle. An inside candle shows the market is at a point of indecision.
Type 2 - Trending candle - The candle extends above or below either the High or low, but not both, of the previous candle.
Type 3 - Outside candle - The candle has broken both the high and low of the previous candle. An outside candle shows price is broadening, producing higher highs and lower lows on a lower timeframe.
Patterns
This indicator supports and displays the following patterns, see the comments section for a visual description :
ACTIONABLE
- 1-2-1 - Potential reversal into a 1-2-2
- 2-1-1 - Potential reversal or continuation into a 2-1-2
- 3-1-1 - Potential reversal into a 3-1-2
- 3-2-1 - Potential reversal into a 3-2-2
IN-FORCE
- 2-1-2u Continuation
- 2-1-2d Continuation
- 2-1-2u Reversal
- 2-1-2d Reversal
- 3-1-2u Reversal
- 3-1-2d Reversal
- 3-2-2u Reversal
- 3-2-2d Reversal
- 1-2-2d Reversal
- 1-2-2d Reversal
- 1-3u Reversal
- 1-3d Reversal
- 2-2u Reversal
- 2-2d Reversal
- 2-2u Continuation
- 2-2d Continuation
- 1-2u Breakout
- 1-2d Breakout
SETTINGS
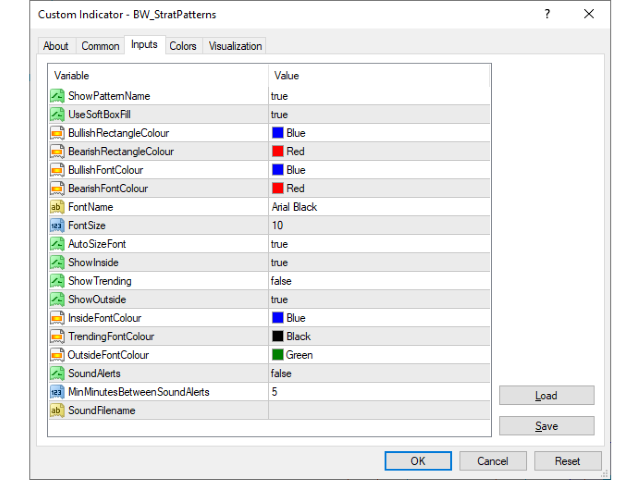
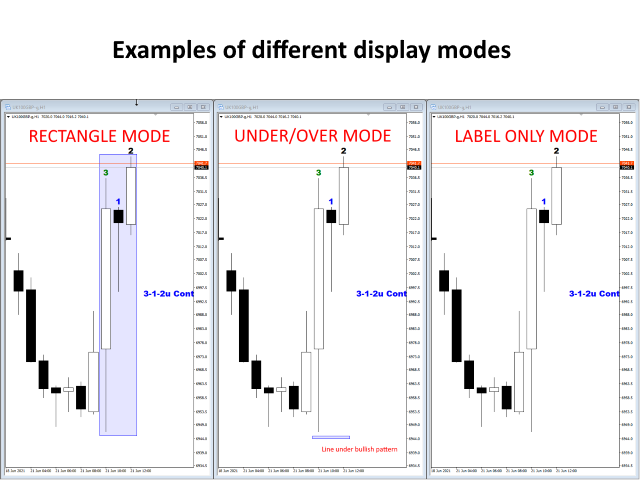
Settings are available to allow you to customise the display to suit your own preferences.
We have published a document that describes the configuration settings here: https://www.mql5.com/en/blogs/post/746389
Please take the time to download the Demo and try it out.