Lines Profit Loss MT5
- インディケータ
- バージョン: 4.50
- アップデート済み: 11 7月 2026

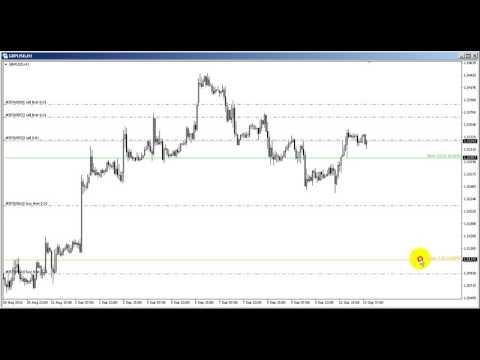
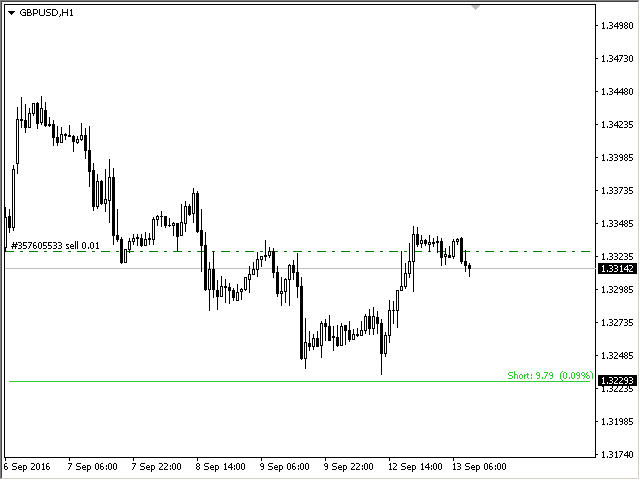
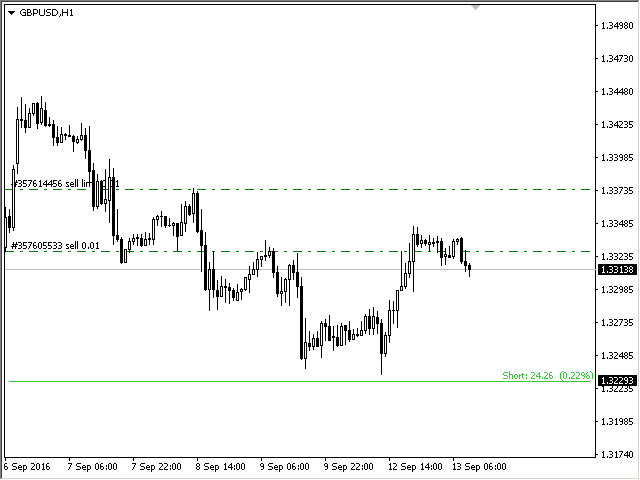
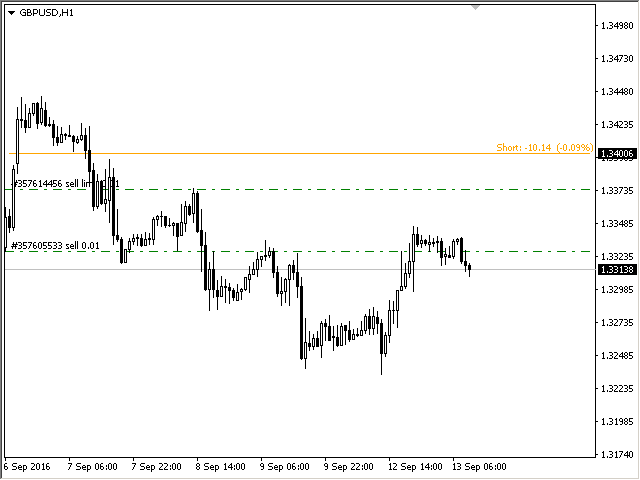
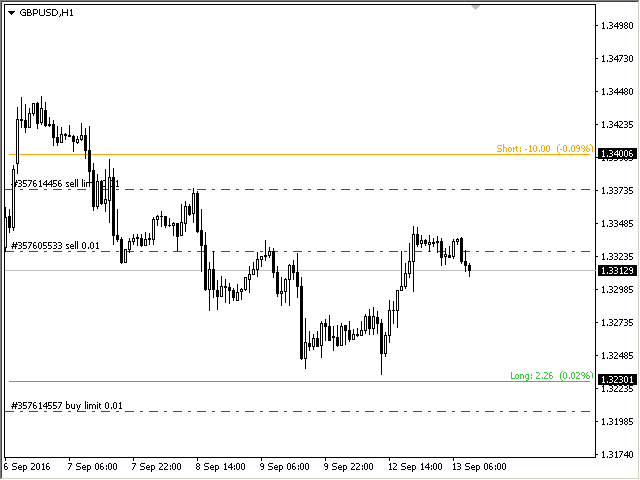
インジケーターは現在のシンボルの利益(損失)を表示します。 線を自由にドラッグ&ドロップして現在の損益を表示できます。
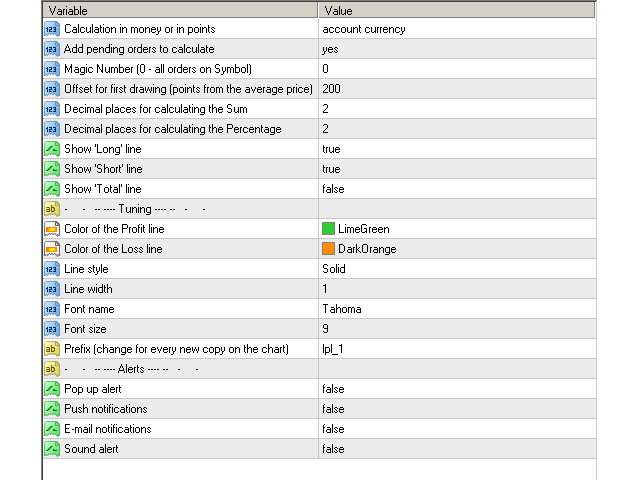
パラメーター
Calculation in money or in points — 損益をポイントまたは金額で計算します。
Add pending orders to calculate — 計算では未決注文を考慮します。
Magic Number (0 - all orders on symbol) — 特定の注文を評価する必要がある場合のマジック ナンバー。
Offset for first drawing (points from the average price) — 最初の開始時の平均価格からのラインのオフセット。
Decimal places for calculating the Sum — 合計を表示するための小数点以下の桁数。
Decimal places for calculating the Percentage — パーセンテージを表示するための小数点以下の桁数。
Tuning チューニング
Color of the profit line — 利益線の色。
Color of the loss line — 損失ラインの色。
Line style — 線のスタイル。
Line width — 線幅。
Font name — フォント名。
Font size — フォントサイズ。
Prefix (change for every new copy on the chart) — プレフィックス (チャート上の新しいコピーごとに変更)。
私は「シンボル マネージャー」を持っています。これは、注文を 1 つの共通ポジションに集めて管理できるユーティリティです。


good stuff, really neat indicator, works well