Lines Profit Loss MT5
- 지표
- 버전: 4.50
- 업데이트됨: 11 7월 2026

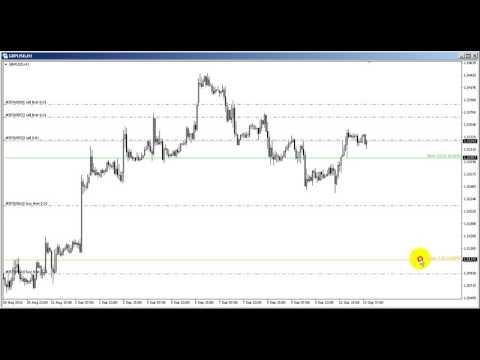
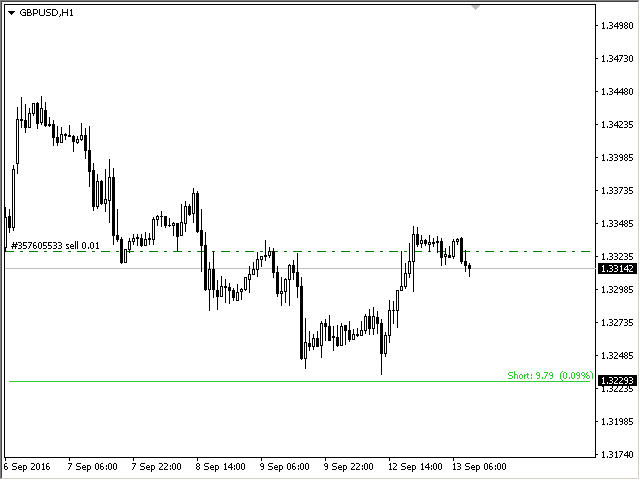
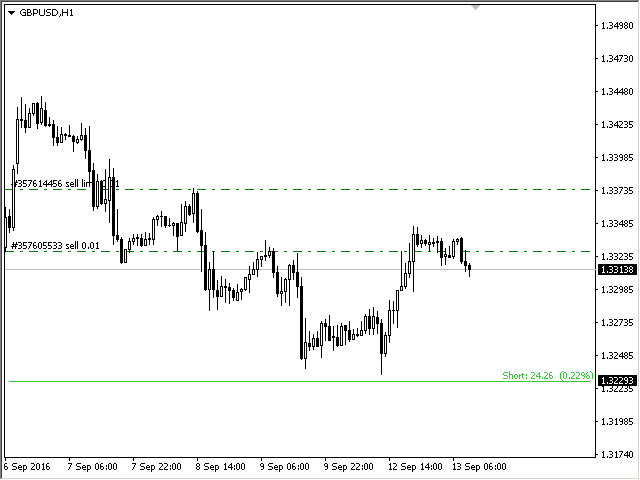
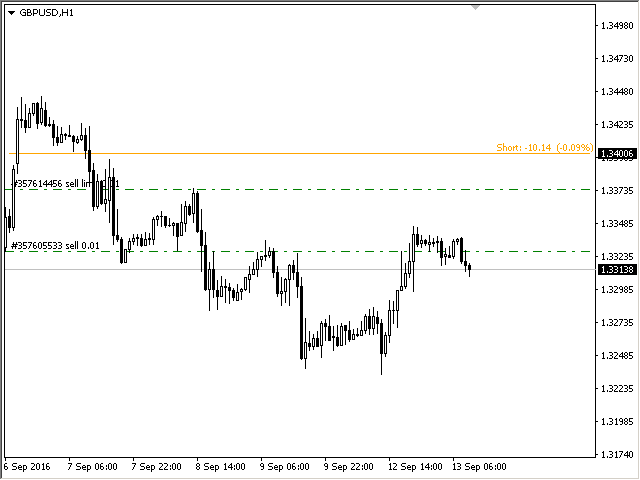
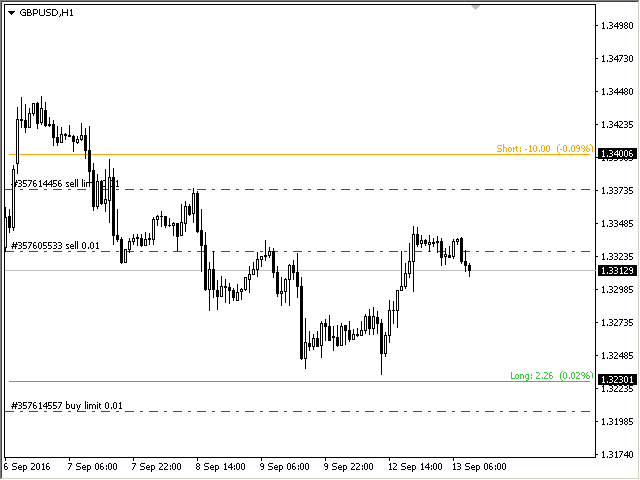
표시기는 현재 기호에 이익(손실)을 표시합니다. 라인을 자유롭게 드래그 앤 드롭하여 현재 손익을 표시할 수 있습니다.
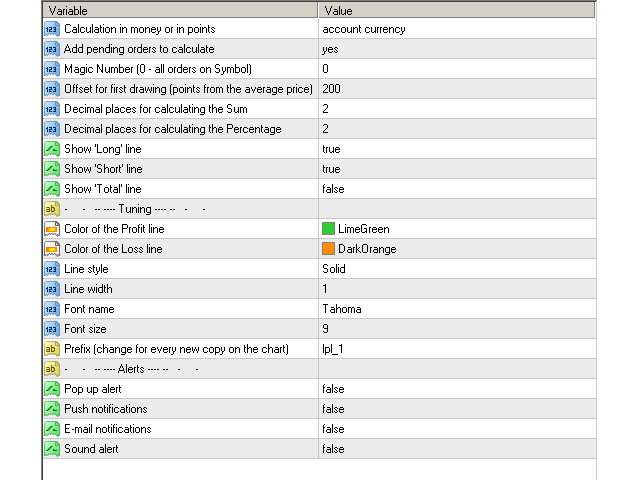
매개변수
Calculation in money or in points — 포인트나 돈으로 이익/손실을 계산합니다.
Add pending orders to calculate — 계산 시 지정가 주문을 고려하세요.
Magic Number (0 - all orders on symbol) — 기호의 모든 주문) — 특정 주문을 평가하는 데 필요한 경우 매직 넘버입니다.
Offset for first drawing (points from the average price) — 첫 번째 시작 시 평균 가격의 라인 오프셋입니다.
Decimal places for calculating the Sum — 합계를 표시하기 위한 소수점 뒤의 자릿수입니다.
Decimal places for calculating the Percentage — 백분율을 표시하기 위한 소수점 뒤의 자릿수입니다.
Tuning 동조
Color of the profit line — 이익선의 색상입니다.
Color of the loss line — 손실선의 색상입니다.
Line style — 선 스타일.
Line width — 선의 폭.
Font name — 글꼴 이름.
Font size — 글꼴 크기.
Prefix (change for every new copy on the chart) — 접두사(차트의 모든 새 복사본에 대해 변경)
"심볼 매니저"라는 유틸리티를 사용하고 있는데, 이를 사용하면 주문을 하나의 공통된 위치로 모아서 관리할 수 있습니다.


good stuff, really neat indicator, works well