Lines Profit Loss MT5
- Indicatori
- Versione: 4.50
- Aggiornato: 11 luglio 2026

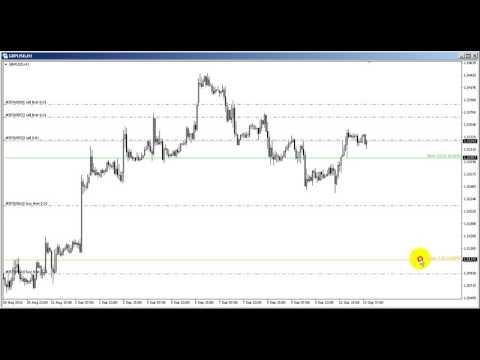
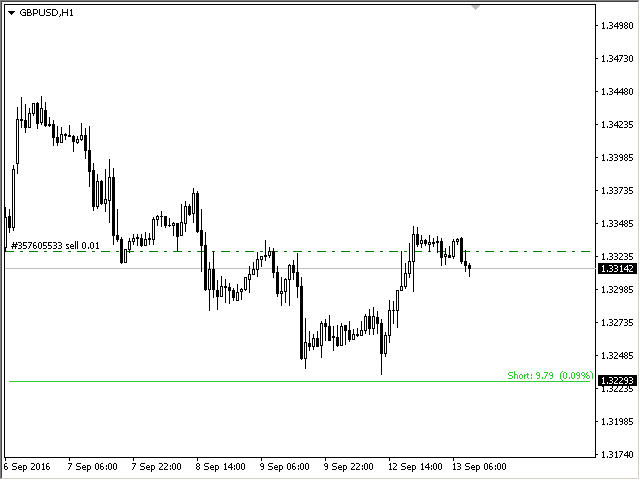
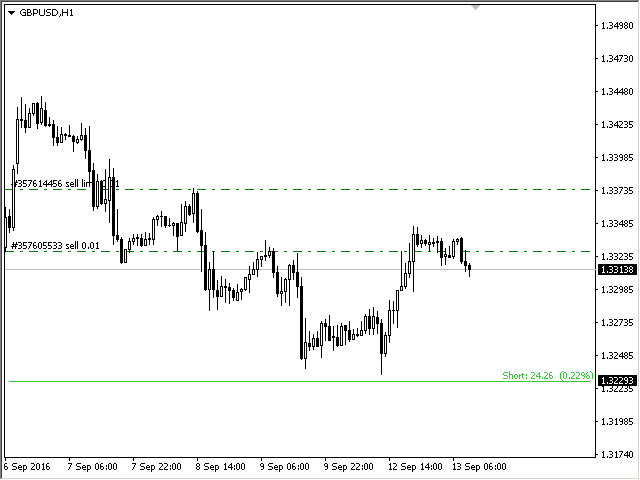
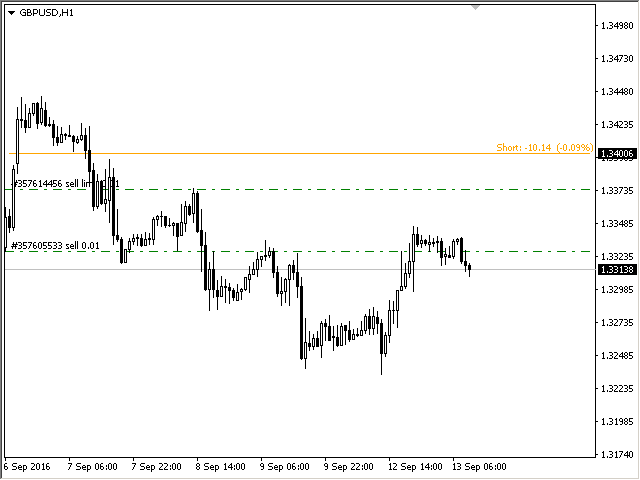
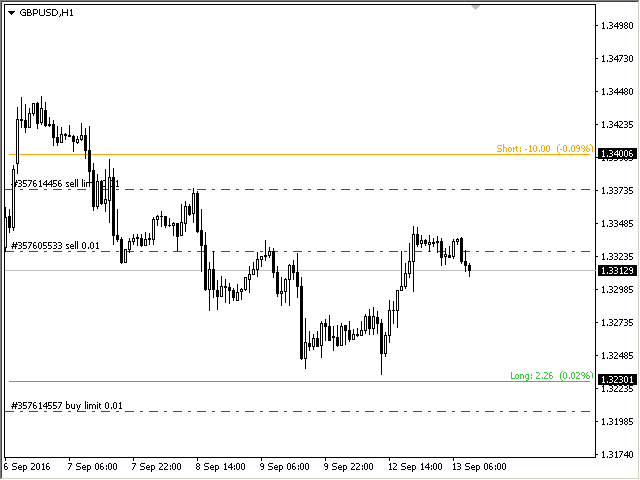
L'indicatore mostra il profitto (perdita) sul simbolo corrente. Puoi trascinare e rilasciare liberamente la linea per visualizzare il profitto o la perdita corrente.
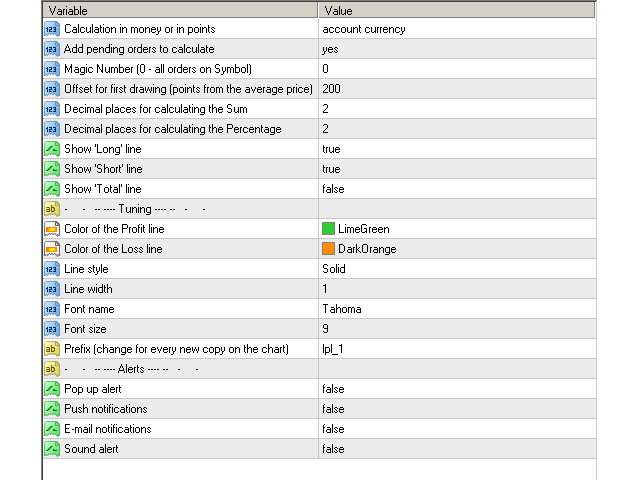
Parametri
Calculation in money or in points — calcola il profitto/perdita in punti o denaro.
Add pending orders to calculate — prendi in considerazione gli ordini in sospeso nei calcoli.
Magic Number (0 - all orders on symbol) — numero magico, se è necessario valutare ordini specifici.
Offset for first drawing (points from the average price) — offset della linea dal prezzo medio al primo avvio.
Decimal places for calculating the Sum — il numero di cifre dopo il punto decimale per visualizzare la Somma.
Decimal places for calculating the Percentage — il numero di cifre dopo il punto decimale per visualizzare la percentuale.
Tuning (Messa a punto)
Color of the profit line — Colore della linea di profitto.
Color of the loss line — Colore della linea di perdita.
Line style — Stile della linea.
Line width — Larghezza della linea.
Font name — Nome del carattere.
Font size — Dimensione del font.
Prefix (change for every new copy on the chart) — Prefisso (cambia per ogni nuova copia sul grafico).
Ho "Symbol Manager", un'utilità che può raccogliere gli ordini in un'unica posizione comune e gestirli.


good stuff, really neat indicator, works well