Smart Phase Box
- Indicators
-
Evgeniy Zhdan
 🚀 Products for MT4 & MT5. Only the best and truly useful tools for traders: https://www.mql5.com/en/users/trendhunter/seller
➖➖➖➖➖➖➖➖➖➖➖➖➖➖➖➖➖➖➖➖➖➖ - Version: 1.0
- Activations: 10
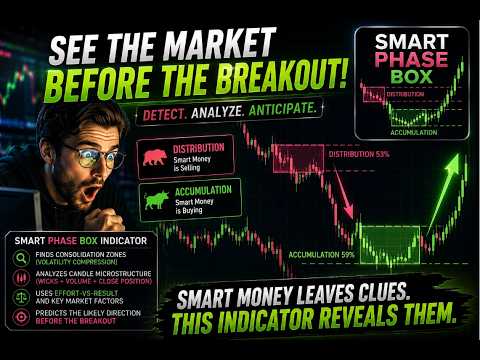
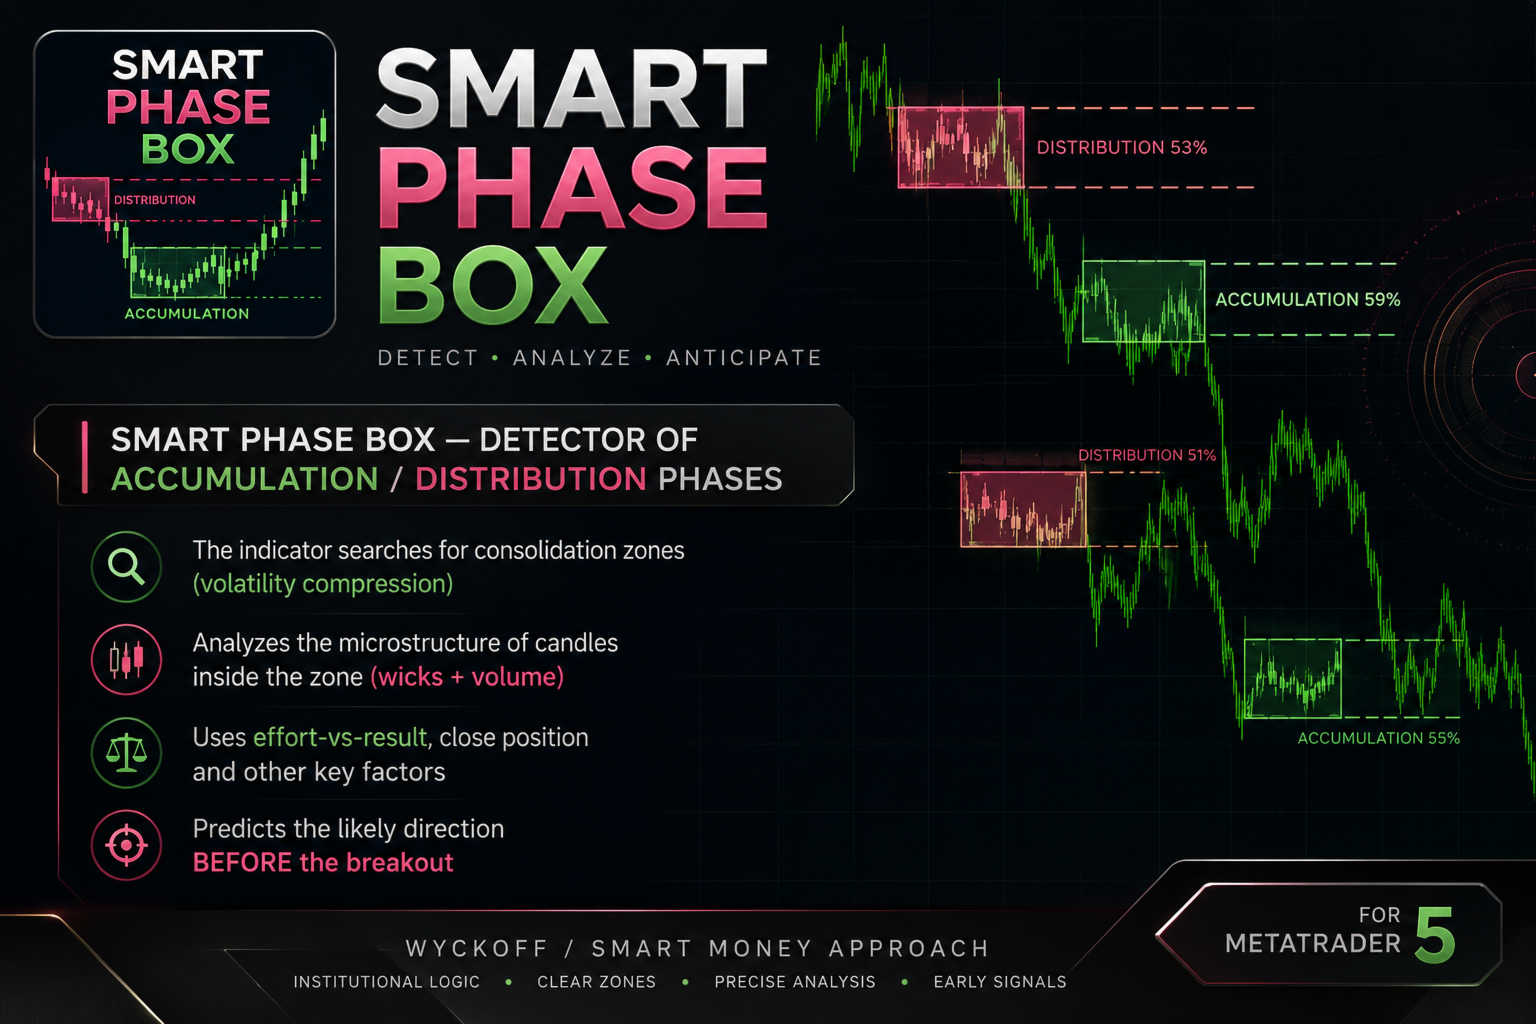
Smart Phase Box automatically locates consolidation zones (bases, flats) on the chart and analyzes the candle microstructure inside each zone — wicks, tick volume, body-to-range ratio, and where price closes relative to the zone — to estimate whether the zone looks more like accumulation (buyers absorbing supply) or distribution (sellers absorbing demand), based on classic Wyckoff / Smart Money concepts.
MT4-version: https://www.mql5.com/en/market/product/186530
The indicator draws the zones directly on the price chart as colored rectangles with a text label, adds dashed support/resistance projection lines, and also writes the same information into indicator buffers so it can be read by an Expert Advisor.
Indicator development philosophy: https://www.mql5.com/en/blogs/post/772874
How it works
- Compression detection. The indicator measures the average candle range over a baseline period. When price gets compressed into a narrow corridor (over a short lookback window) relative to that baseline, a new zone is opened.
- Microstructure scoring. While the zone is active, every new candle is scored on three factors:
- Wick + volume — a long wick paired with a volume spike suggests resting limit orders absorbing market flow on that side.
- Effort vs. result — a candle with high volume but a narrow body (little price progress) suggests hidden buying/selling against the visible candle direction.
- Close location — where candles tend to close inside the zone (upper vs. lower half).
- Verdict. The running score determines the zone's color and label: gray/"FORMING" while inconclusive, green "ACCUMULATION: X%" or red "DISTRIBUTION: X%" once one side dominates. The label updates in real time as the zone develops.
- Projection. Once a zone breaks, its upper/lower borders are projected forward as dashed lines, and the indicator buffers keep holding the same border/direction/probability values for the length of that projection — useful as a simple support/resistance + bias reference after the breakout.
Parameters
| Input variable | Label shown in the terminal's Inputs tab | Meaning |
|---|---|---|
| InpHistoryBars | History to draw on chart (bars back) | How many bars back to scan and draw zones for when the indicator is first attached. |
| InpRangeAvgPeriod | Averaging period for candle range (baseline volatility) | Lookback period used to compute the baseline average candle range (the volatility reference). |
| InpBoxLookback | Window for compression detection (bars) | Size of the window used to detect the initial compression (in bars). |
| InpBoxMultiplier | Allowed box range = multiplier * average candle size | How tight the compression must be: max allowed zone range = multiplier × average candle range. Lower = stricter/smaller zones. |
| InpMinBoxBars | Minimum zone length (bars) to be displayed | Minimum zone length (in bars) required before it is drawn on the chart. Filters out noise from very short zones. |
| InpWickVolumeFactor | Volume multiplier for a "spike" (wicks / effort-vs-result) | How large a tick-volume spike must be (relative to its own baseline) to count as significant for the wick/effort-result scoring. |
| InpShowLabels | Show text labels (ACCUMULATION/DISTRIBUTION %) | Show/hide the "ACCUMULATION/DISTRIBUTION %" text label. |
| InpExtendLines | Draw dashed level projections to the right | Show/hide the dashed projection lines after a zone breaks. |
| InpExtendBars | Length of level projection to the right (bars) | How far (in bars) the projection lines — and the matching buffer values — extend after a zone closes. |
| InpColorForming | Color of a forming / undetermined zone | Color for zones with no clear bias yet. |
| InpColorAccum | Color of an accumulation zone | Color for zones leaning accumulation (bullish bias). |
| InpColorDist | Color of a distribution zone | Color for zones leaning distribution (bearish bias). |
| InpObjPrefix | Prefix for graphical object names | Prefix used for all chart object names created by the indicator (change it if you run multiple instances on one chart). |
Buffers (for EA / iCustom use)
| # | Content |
|---|---|
| 0 | Zone upper border (price) |
| 1 | Zone lower border (price) |
| 2 | Direction: 1 = accumulation, -1 = distribution, 0 = no active/undetermined zone |
| 3 | Probability of the current direction, in % |
Buffers stay populated for as long as a zone is active, and continue to hold the last closed zone's values for InpExtendBars bars afterward (matching the dashed projection on the chart), then reset to empty.
Usage recommendations
- Works on any timeframe and symbol; the defaults are tuned for a generic intraday chart — re-tune InpBoxMultiplier , InpRangeAvgPeriod and InpWickVolumeFactor per instrument/timeframe (e.g., a stricter multiplier for higher timeframes, a looser one for very noisy low timeframes).
- Treat the zone label as a bias, not a signal to enter blindly — it works best combined with your own confirmation (e.g., waiting for a retest of the zone border, a break-and-hold, or a structure signal from another tool).
- InpMinBoxBars is the main noise filter: raise it if you see too many short-lived/low-confidence zones; lower it if you want to catch shorter bases (e.g., on lower timeframes or fast instruments).
- Increase InpWickVolumeFactor on instruments/timeframes with generally noisy volume, to reduce false wick/effort-result signals.
- The projected dashed levels after a breakout are a convenient reference for support-turned-resistance / resistance-turned-support, not a guaranteed reaction level.
- For EA integration, read buffer 2 (direction) together with buffer 3 (probability) and apply your own threshold (e.g., only act above 65-70%) rather than reacting to any nonzero direction value.