Pivot Confluence Zones MT5
- Indicators
-
Thushara Dissanayake
 I’ve always loved exploring new trading strategies, testing them with indicators, and automating them with expert advisors (EAs). Welcome to my world of Forex Trading Robots, Indicators, and Trading Tools, all specially built for the MetaTrader platform.
 - Version: 2.0
- Activations: 5
Core Functionality
Pivot Confluence Zones combines several widely used technical analysis methods into a single indicator to simplify chart analysis and daily trade preparation. Rather than drawing and managing multiple tools manually, the indicator automatically calculates important Pivot Points, Fibonacci Retracement and Extension levels, ATR price levels, and ADR levels, displaying them together on the chart so traders can quickly identify areas where several independent calculations agree. These overlapping areas form confluence zones, which many traders use as reference points when studying retracements, pullbacks, support, resistance, and possible reversal behaviour.
The automatic Fibonacci tool identifies swing highs and lows and draws customizable Fibonacci retracement and extension levels. High and low anchor points can be moved freely between swing points, automatically follow new market extremes when required, and remain fixed once manually adjusted, giving traders flexibility while maintaining consistent analysis. Saved Fibonacci levels can remain on the chart for historical comparison, making it easier to review previous market reactions.
The interactive Pivot tool allows traders to switch between different pivot calculation periods, step through previous trading sessions, and compare current and historical Pivot levels directly against price action. Each Pivot level can display both the current price and the remaining distance in pips, helping traders monitor how close the market is to important trading levels without additional calculations.
ATR and ADR calculations add another layer of market analysis by projecting expected price movement ranges based on historical volatility. These dynamic levels complement Pivot and Fibonacci analysis and help traders understand where price is trading relative to its average daily or true range.
To further improve chart analysis, the indicator automatically detects up to 45 single, double, and triple candlestick patterns. These patterns are filtered using a moving average trend filter, allowing traders to view reversal and continuation patterns within the broader market direction rather than in isolation. This combination of price action analysis and trend analysis provides additional context when evaluating confluence zones and market structure.
A built-in drawing tool dashboard brings all analysis tools together in one interface. Traders can quickly enable or disable Fibonacci, Pivot, ATR, ADR, trend channels, and candlestick pattern detection using dashboard buttons instead of navigating multiple input settings. Drawing tools also include Save, Delete, and Reset controls, allowing important levels to remain visible for future reference or be removed with a single click. The dashboard supports multiple visual themes, dashboard scaling, and customizable colors so the workspace can be adapted to different monitors and trading preferences.
The indicator also includes a configurable alert system that monitors Pivot, Fibonacci, ATR, and ADR levels. Traders can receive popup alerts, mobile push notifications, email alerts, and optional sound notifications whenever price reaches selected trading zones. Alert reset periods and margin settings can be customized to suit different markets and trading styles, helping traders stay informed without continuously monitoring the chart.
Key Features
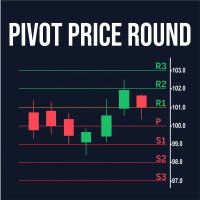
- Automatic Pivot Point Analysis: Automatically calculates and displays Pivot Points, Support, and Resistance levels using configurable calculation periods. Compare current and historical Pivot levels to better understand changing market structure.
- Pivot Confluence Zones: Highlights areas where Pivot Points, Fibonacci levels, ATR, and ADR overlap. These confluence zones help traders identify potential support, resistance, retracement, and reaction areas using multiple technical analysis methods instead of relying on a single indicator.
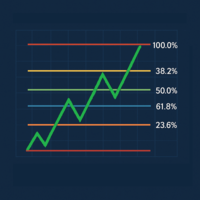
- Automatic Fibonacci Retracement and Extension: Draws Fibonacci Retracement and Fibonacci Extension levels automatically from significant swing highs and lows. Anchor points can also be adjusted manually to suit different trading approaches.
- Interactive Fibonacci Tool: Move, save, delete, or reset Fibonacci levels directly from the dashboard. Compare automatic analysis with manually selected swing points without redrawing the entire tool.
- Interactive Pivot Tool: Quickly switch between Pivot calculation periods, step through previous sessions, and compare historical Pivot structures using the built-in dashboard controls.
- ATR and ADR Price Levels: Displays Average True Range (ATR) and Average Daily Range (ADR) price projections to help estimate expected market movement and identify possible volatility boundaries.
- Remaining Pip Distance Labels: Displays the remaining distance between the current market price and important Pivot, Fibonacci, ATR, and ADR levels, helping traders monitor approaching price zones without manual calculations.
- Confluence Zone Detection: Identifies areas where multiple technical levels cluster together, allowing traders to focus on higher-interest trading zones for pullbacks, reversals, and breakout evaluation.
- 45 Candlestick Pattern Detection: Automatically detects up to 45 Single, Double, and Triple Candlestick Patterns, including common reversal and continuation formations, directly on the chart.
- Moving Average Trend Filter: Filters candlestick patterns according to the prevailing trend, allowing traders to analyze patterns within the broader market direction instead of evaluating every candle independently.
- Trend Confirmation Tools: Combines trend direction, Pivot structure, Fibonacci positioning, and candlestick behavior to provide additional context when evaluating market conditions.
- Price Action Analysis: Supports traders who combine price action, support and resistance, market structure, and technical analysis when planning trades.
- Drawing Tool Management: Built-in Save, Delete, and Reset controls simplify chart management and allow traders to preserve important historical analysis or quickly prepare the chart for a new trading session.
- Customizable Dashboard:
- Enable or disable analysis modules
- Control drawing tools
- Switch Pivot calculations
- Manage Fibonacci tools
- Show or hide ATR and ADR levels
- Control candlestick pattern detection
- Select from multiple dashboard themes
- Adjust dashboard scale and positioning
- Configurable Alert System:
- Popup alerts
- Mobile push notifications
- Email alerts
- Sound alerts
- Multi-Market Support:
- Forex
- Gold (XAUUSD)
- Silver
- Stock Indices
- Cryptocurrencies
- Other CFD instruments
The integrated dashboard allows traders to:
Supports:
Alerts can be configured individually for Pivot levels, Fibonacci levels, ATR levels, ADR levels, and other selected trading conditions.
Suitable for:
Practical Trading Application
Pivot Confluence Zones supports multiple trading styles by combining several independent technical analysis methods into a single workflow.
For price action traders, confluence zones can be used to study areas where Pivot Points, Fibonacci Retracement, and historical support or resistance overlap. Instead of reacting to every price movement, traders can focus on locations where multiple technical factors agree before looking for additional confirmation from candlestick patterns or market structure.
For trend traders, the Moving Average trend filter helps evaluate whether retracement opportunities develop within the direction of the broader trend. When Fibonacci retracement levels align with Pivot Points and trend direction, traders can study these areas as part of their own trading methodology.
For breakout traders, ATR and ADR levels provide additional information about expected market range and volatility. When price approaches major Pivot Confluence Zones while trading near daily range boundaries, traders can evaluate whether the market is showing signs of continuation or exhaustion.
For reversal traders, the combination of candlestick pattern detection, buyer and seller reaction zones, Pivot levels, and Fibonacci confluence provides several independent references that can be compared before making trading decisions.
For scalpers and day traders, lower timeframes can be combined with automatic Pivot calculations and real-time dashboard controls to monitor important intraday price levels throughout the trading session. Remaining pip labels help traders monitor how close price is to significant technical areas without additional calculations.
For swing traders, higher timeframe Pivot structures, Fibonacci retracement levels, ATR projections, and candlestick confirmations can be used together to study broader market structure and possible continuation areas.
The built-in dashboard allows traders to move efficiently between different analysis tools without repeatedly opening indicator settings or manually redrawing technical objects. Whether using Forex, Gold (XAUUSD), Indices, or Cryptocurrency markets, traders can build a consistent technical analysis workflow using a single integrated indicator.
Ideal For
Pivot Confluence Zones is designed for traders who combine multiple forms of technical analysis to study market structure and make informed trading decisions.This indicator is suitable for:
- Forex Traders looking for a structured way to combine Pivot Points, Fibonacci Retracement, ATR, ADR, and price action into one chart.
- Gold Traders (XAUUSD) who rely on dynamic support and resistance levels together with volatility analysis to study market behavior.
- Index Traders analyzing instruments such as US30, NAS100, GER40, and other CFD indices using confluence-based technical analysis.
- Cryptocurrency Traders monitoring highly volatile markets where combining multiple technical tools can help organize chart analysis.
- Scalpers who need automatic Pivot levels, ATR projections, and candlestick confirmations on lower timeframes.
- Day Traders planning intraday entries and exits around important support, resistance, and retracement zones.
- Swing Traders studying higher timeframe market structure using Pivot Points, Fibonacci levels, and trend confirmation.
- Price Action Traders combining candlestick patterns with technical levels to identify high-interest market areas.
- Trend Traders using Moving Average filtering together with retracement analysis to evaluate pullbacks within the prevailing trend.
- Support and Resistance Traders who prefer objective technical levels instead of manually drawing chart zones.
- Manual Technical Analysts looking for a complete chart analysis environment with interactive drawing tools and dashboard controls.
- Systematic Traders who prefer structured analysis using multiple independent technical factors before making trading decisions.
Optimal Configuration
Pivot Confluence Zones can be customized for different markets, timeframes, and trading styles.
For scalping, lower timeframes such as M1, M5, and M15 can be combined with automatic Pivot calculations, ATR levels, and candlestick pattern detection to monitor short-term market movement.
For day trading, combinations such as M15, M30, and H1 provide a balance between intraday price movement and broader market structure. Pivot Points, Fibonacci Retracement levels, and ADR projections can help organize daily trading plans.
For swing trading, H1, H4, and D1 charts allow traders to focus on larger market trends while using Fibonacci levels, Pivot structures, and candlestick confirmation to evaluate potential continuation or reversal areas.
The indicator works effectively across multiple financial markets, including:
- Forex currency pairs
- Gold (XAUUSD)
- Silver
- Cryptocurrencies
- Stock Indices
- Other CFD instruments
The integrated dashboard allows traders to customize their workspace by selecting which analysis tools remain visible.
Available customization includes:
- Pivot calculation settings
- Fibonacci level configuration
- ATR and ADR display options
- Candlestick pattern selection
- Moving Average filter settings
- Alert conditions
- Dashboard themes
- Dashboard scaling
- Dashboard position
- Drawing tool controls
- Color customization
The Save, Delete, and Reset functions make it easy to preserve important historical analysis or prepare the chart for a new trading session without manually removing drawing objects.
Popup alerts, mobile notifications, email alerts, and optional sound alerts can be configured independently so traders receive notifications only for the market conditions that match their trading workflow.
Final Notes
Pivot Confluence Zones is a technical analysis indicator that combines Pivot Points, Fibonacci Retracement, ATR, ADR, candlestick pattern recognition, trend confirmation, and interactive chart tools into a single trading workspace. Rather than relying on one technical method, the indicator helps traders study areas where several independent calculations align, providing a more organized approach to market analysis.
The integrated dashboard, automatic drawing tools, and customizable alerts are designed to reduce the time spent preparing charts while keeping important technical information easily accessible. Whether traders focus on price action, trend following, retracement trading, breakout analysis, or support and resistance, the indicator provides a structured framework that can be adapted to different trading styles and markets.
Pivot Confluence Zones does not predict future price movements or guarantee trading results. Like any technical analysis tool, it should be used alongside proper risk management, sound trading practices, and independent market analysis.
For best results, traders are encouraged to test different Pivot calculation methods, Fibonacci settings, ATR and ADR configurations, candlestick pattern filters, and alert options on a demo account before applying them to live trading. This helps identify the configuration that best matches individual trading objectives, preferred markets, and personal trading style.