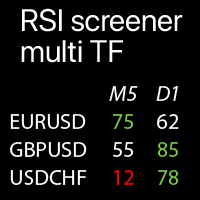
RSI MTF values
- Indicators
-
Makarii Gubaydullin
 Multifunctional Trade Assistant:
MT5: https://www.mql5.com/en/market/product/71145 - Version: 1.0
- Activations: 20
Multi-timeframe RSI values on the selected Symbols: compare the current market trends
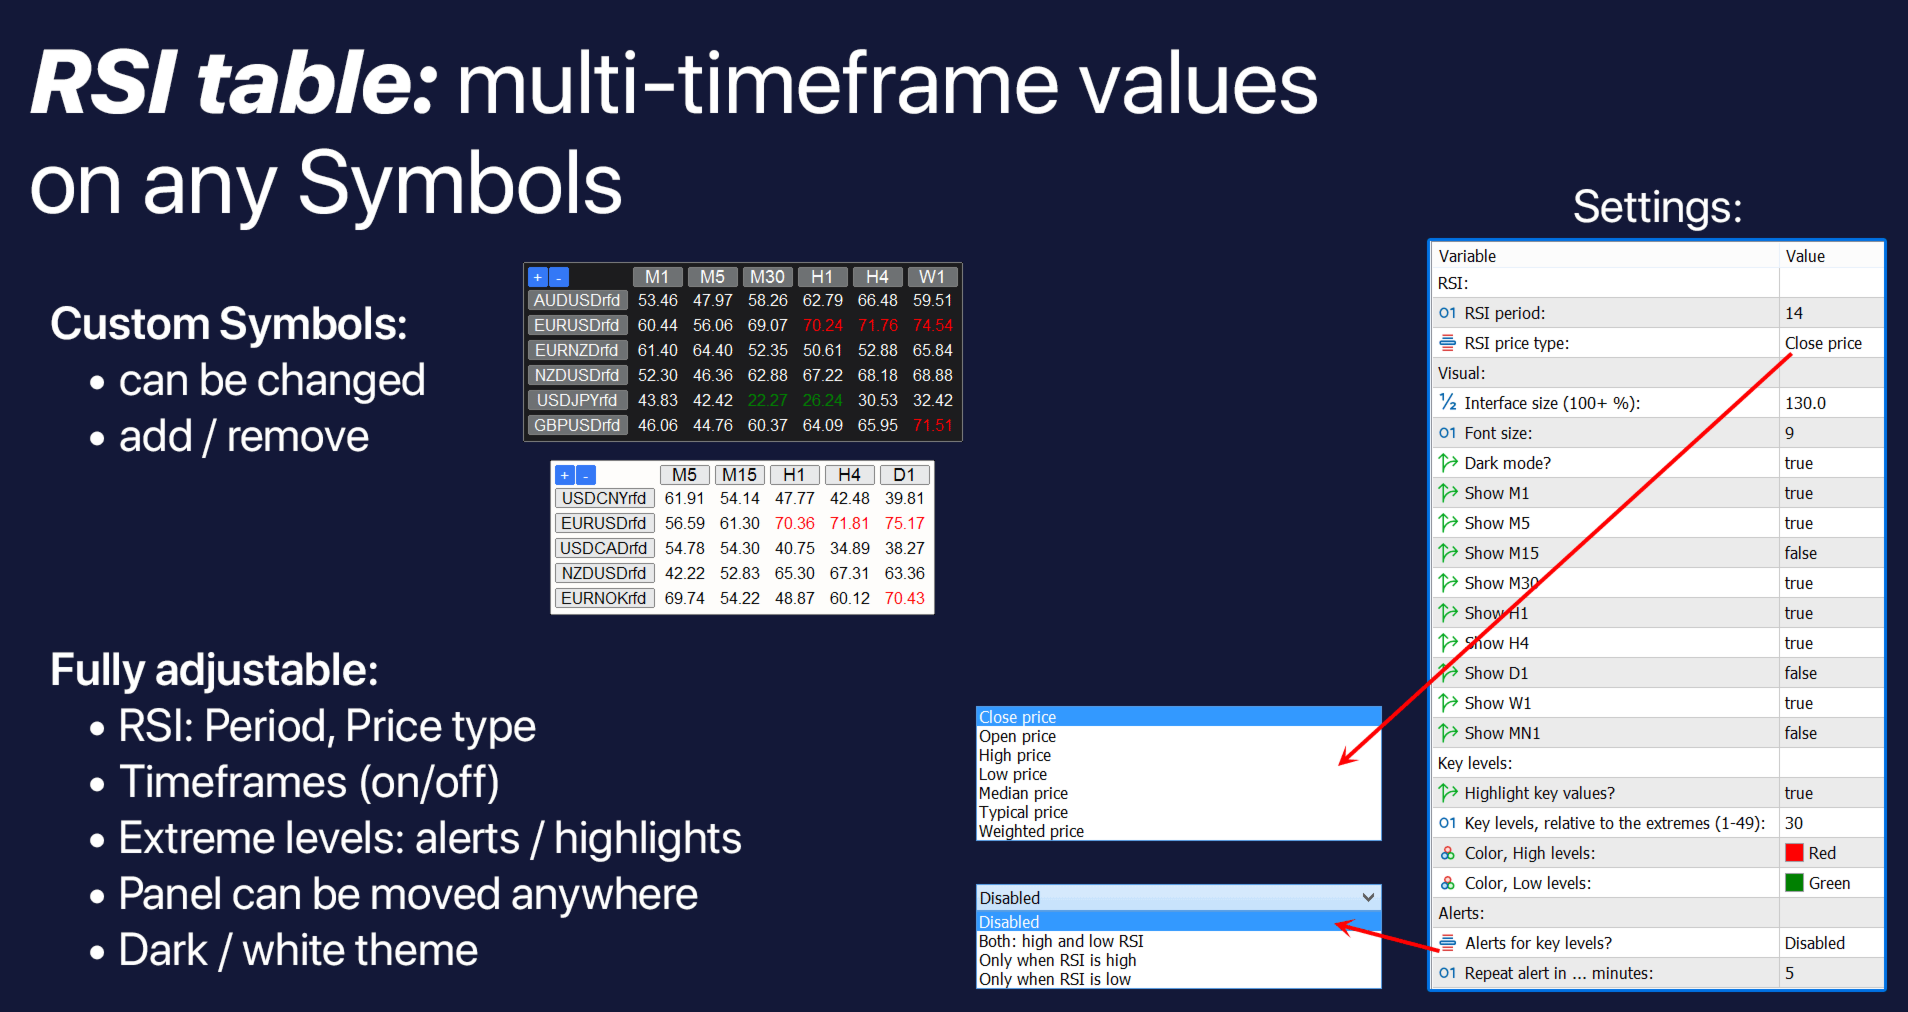
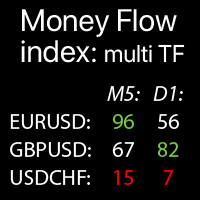
The indicator displays Relative Strength Index values from all selected timeframes and Symbols in a single table, which allows you to quickly analyze current market price trends.
Each Symbol can be customized: removed / replaced. You can add up to 40 Symbols.
Panel can be moved to any place of the chart (drag anywhere).
In the input settings you can configure:
- RSI indicator settings: Period and Applied Price.
- Each timeframe may be enabled / disabled.
- Highlight option: if enabled - extreme levels will be highlighted in the custom colors.
- Extreme levels settings: e.g. if input is 25: values 25- will be considered as Low, RSI 75+ will be considered as High.
- Alerts: may be enabled for Extreme levels: high RSI / low RSI / both.
-
Visual styles: size, dark / white theme, highlight colors.
Relative Strength Index (RSI) is a popular momentum oscillator used in technical analysis to measure the speed and magnitude of price movements. The RSI helps traders identify overbought and oversold conditions, potential trend reversals, and divergence signals.
- RSI is calculated using the formula:
- RSI = 100 - [100 / (1 + RS) ]
- where RS (Relative Strength) = Average Gain / Average Loss over a specified period (default is 14 candles).
- The indicator compares the magnitude of recent gains to recent losses, normalizing the result between 0 and 100.
- Default Settings:
- Period: Typically 14 (can be adjusted for sensitivity).
- Overbought Level: 70 (suggests a potential sell opportunity).
- Oversold Level: 30 (suggests a potential buy opportunity).
- Key Signals:
- Overbought (>70): Indicates a strong uptrend, but a reversal or pullback may occur.
- Oversold (<30): Indicates a strong downtrend, but a bounce or reversal may follow.
- Divergence: When price makes a new high/low but RSI does not, signaling potential trend weakness.
- Centerline (50): Acts as a trend filter (RSI > 50 = bullish bias, RSI < 50 = bearish bias).
- Limitations:
- Works best in ranging markets; can stay overbought/oversold in strong trends.
- False signals may occur, so additional confirmation is recommended.
- Traders often combine RSI with other tools (e.g., moving averages, trendlines) for confirmation.