Harmonic Patterns Osw MT5
- Indicators
-
William Oswaldo Mayorga Urduy
 MQL4 and MQL5 trader and developer since February 2019, delivering projects in under one day and providing post-delivery technical support.
Optimized code, advanced logic, and high-quality code. - Version: 1.1
- Updated: 20 May 2024
- Activations: 5
User Manual: Harmonic Patterns OSW MT5
1. Introduction and Purpose
Harmonic Patterns OSW is an advanced algorithmic analysis tool designed to automatically detect geometric price structures based on Fibonacci levels. The indicator uses a search engine linked to the ZigZag algorithm to filter market noise and locate high-probability areas where price tends to reverse. Its objective is to identify patterns such as Gartley, Bat, Butterfly, Crab, and Shark, allowing traders to anticipate market reversals with professional accuracy.
2. Parameter Guide (Entry Menu)
Pattern Selection (SHOW HARMONICS)
Show Undefined: Displays technical structures that, while not fitting into a classic category, maintain a relevant Fibonacci geometry for manual analysis.
Show Gartley / Bat / Butterfly / Crab / Shark: Individual toggles to activate or deactivate the search for each specific pattern according to your strategy.
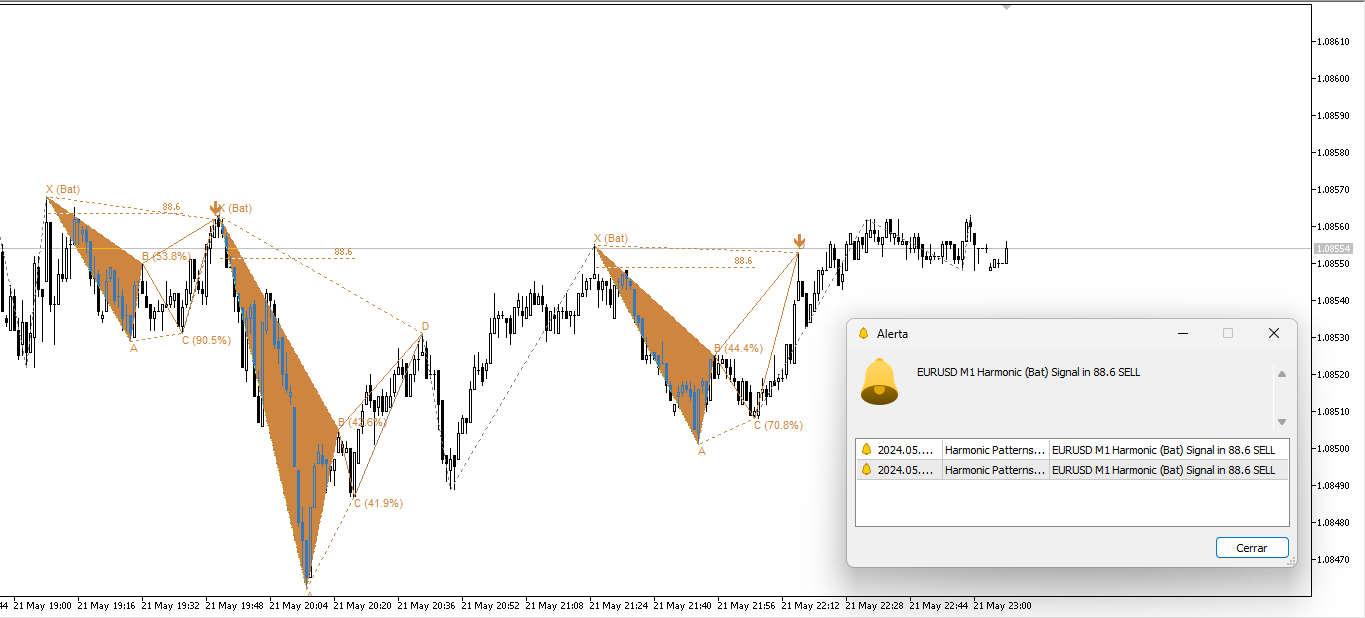
Alerts System (ALERTS)
Signal On Candle: Defines the notification timing. Candle_0 alerts in real time when the level is reached; Candle_1 alerts once the candle is confirmed (more conservative).
Send Alert PC / Mail / Mobile: Activates sound notifications, emails, or push notifications to the MT5 app on your mobile device.
Visual Configuration and Geometry
Bullish / Bearish Color: Customize the colors of the buy (Bullish) and sell (Bearish) structures.
Allowed Degrees: This is the tolerance factor. If a level should be 38.2% and you configure 5 degrees, the indicator will validate the point if it is between 33.2% and 43.2%, compensating for the market's lack of pinpoint accuracy.
Candles Delete Harmonics: Controls chart clarity by removing old patterns after the specified number of candles (e.g., 1000) to avoid visual clutter.
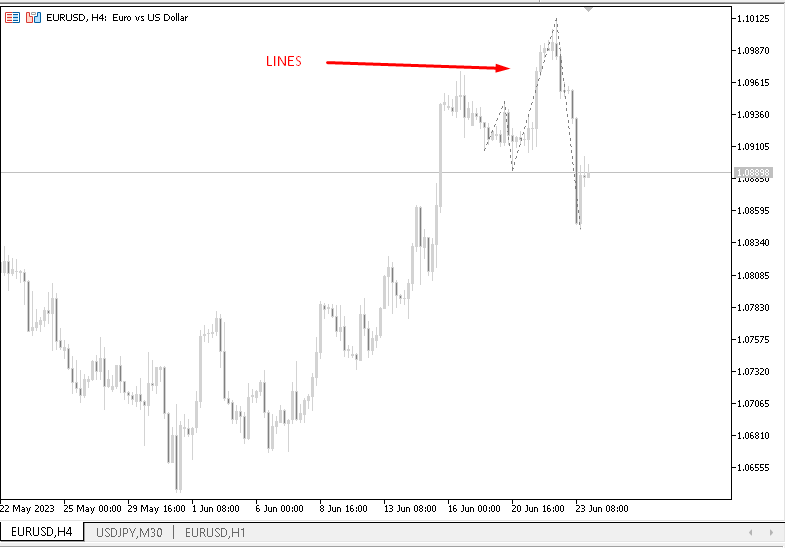
Show Lines: Displays the impulses and retracements (trend lines) that the indicator is currently analyzing, even before a pattern is completed.
ZigZag Settings
Depth / Deviation / BackStep: Control the sensitivity of spike detection. Low values detect rapid movements (scalping); high values filter out larger trends (swinging).
3. Visual Interpretation and Operation
Pattern Identification
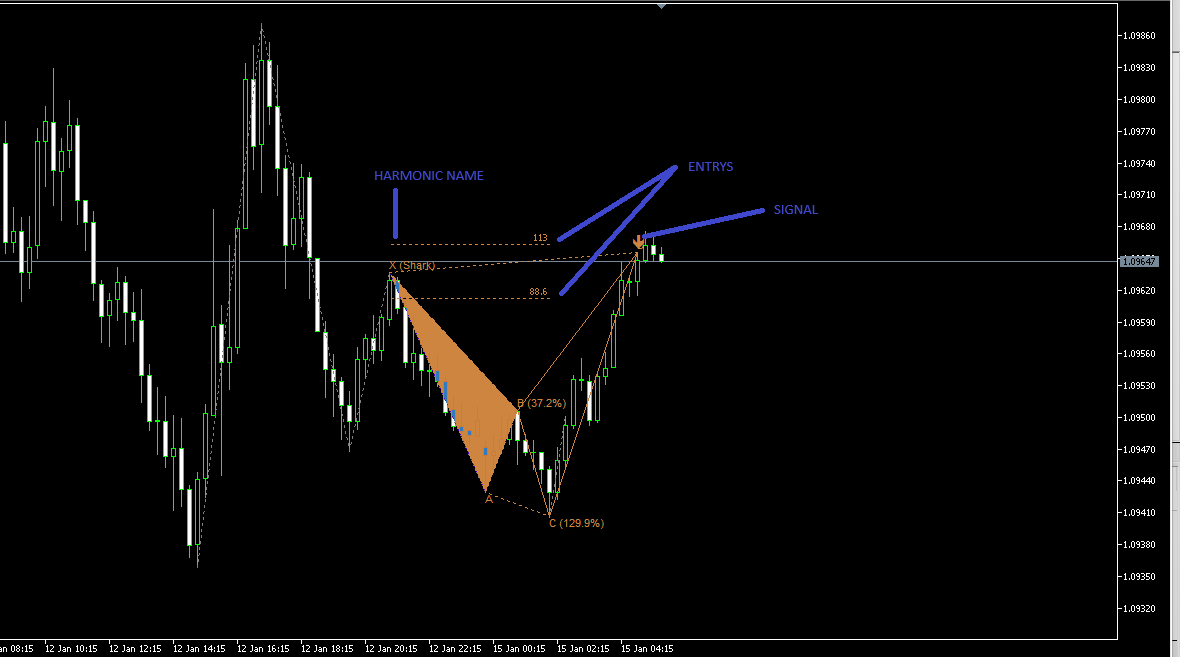
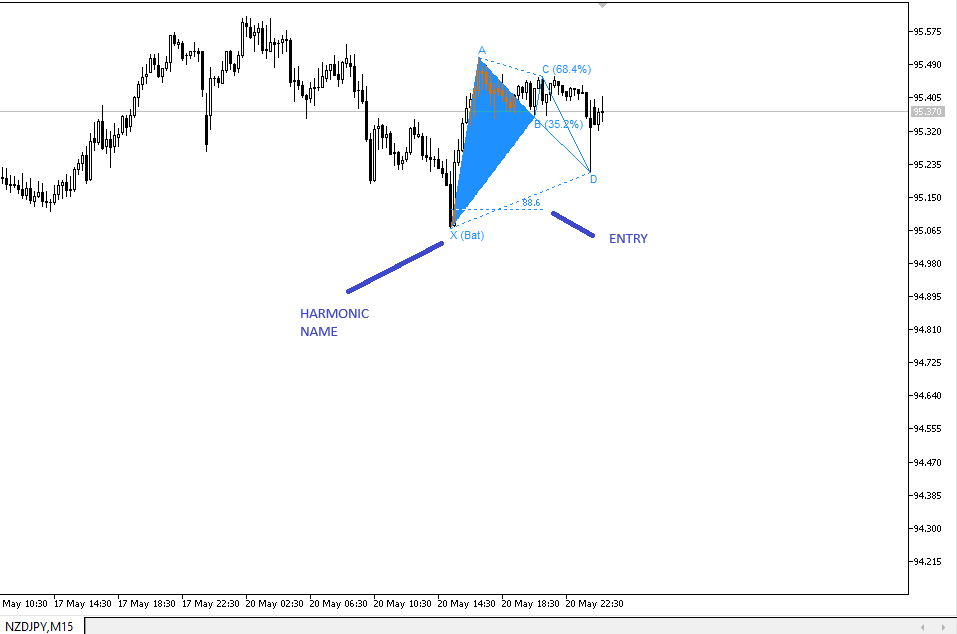
The indicator will draw triangles connecting points X, A, B, C, and D. The detected retracement percentage will appear next to points B and C. When the price reaches the Reversal Zone (point D), the system will project specific entry levels (e.g., "Entry BUY 88.6").
Signal Execution
Confirmation: Wait for the signal arrow to appear (blue for buy / brown for sell).
Execution: It is recommended to add a manual analysis (rejection candles or support levels) upon reaching point D.
Exit (TP): The system automatically projects three Fibonacci-based targets: TP1 (38.2%), TP2 (61.8%), and TP3 (100%).
4. Recommendations
Timeframes: Works most reliably on H1, H4, and D1 timeframes.
Risk Management: Place the Stop Loss outside of Point X or the projected level D.
Context: Avoid trading during high-impact macroeconomic news events, as volatility often invalidates the harmonic geometry.