Harmonic Patterns Osw MT5
- 지표
-
William Oswaldo Mayorga Urduy
 MQL4 and MQL5 trader and developer since February 2019, delivering projects in under one day and providing post-delivery technical support.
Optimized code, advanced logic, and high-quality code. - 버전: 1.1
- 업데이트됨: 20 5월 2024
- 활성화: 5
사용자 설명서: 하모닉 패턴 OSW MT5
1. 소개 및 목적
하모닉 패턴 OSW는 피보나치 레벨을 기반으로 기하학적 가격 구조를 자동으로 감지하도록 설계된 고급 알고리즘 분석 도구입니다. 이 지표는 지그재그 알고리즘과 연동된 검색 엔진을 사용하여 시장의 노이즈를 걸러내고 가격 반전 가능성이 높은 영역을 찾아냅니다. 가틀리, 박쥐, 나비, 게, 상어와 같은 패턴을 식별하여 트레이더가 전문적인 정확도로 시장 반전을 예측할 수 있도록 하는 것이 목표입니다.
2. 매개변수 안내 (입력 메뉴)
패턴 선택 (하모닉 표시)
정의되지 않음 표시: 고전적인 범주에 속하지는 않지만 수동 분석을 위해 관련 피보나치 기하학적 구조를 유지하는 기술적 구조를 표시합니다.
가틀리/박쥐/나비/게/상어 표시: 전략에 따라 각 특정 패턴 검색을 활성화 또는 비활성화하는 개별 토글입니다.
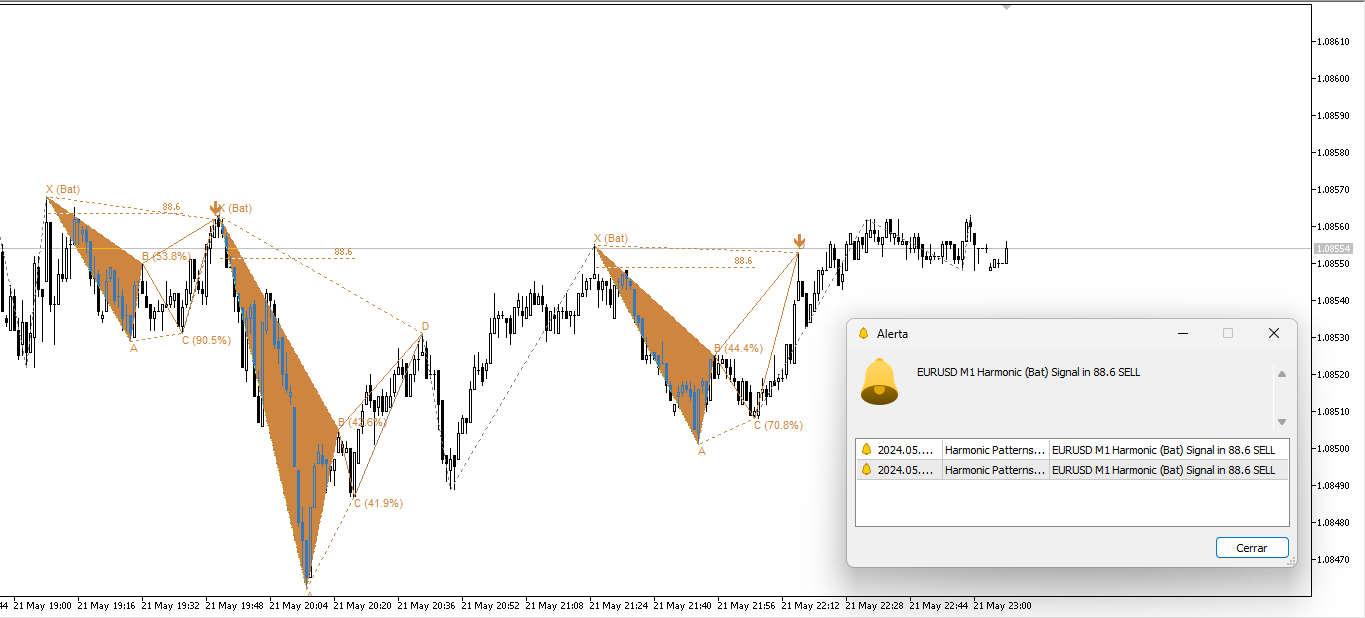
알림 시스템 (알림)
캔들 신호: 알림 시점을 정의합니다. Candle_0은 레벨 도달 시 실시간으로 알림을 제공하고, Candle_1은 캔들 확정 시 알림을 제공합니다(더 보수적인 방식).
알림 전송(PC/이메일/모바일): 소리 알림, 이메일 또는 모바일 기기의 MT5 앱으로 푸시 알림을 활성화합니다.
시각적 설정 및 형태
상승/하락 색상: 매수(상승) 및 매도(하락) 신호의 색상을 사용자 지정합니다.
허용 각도: 허용 오차입니다. 예를 들어, 레벨이 38.2%여야 하는데 5도를 설정하면, 지표는 해당 레벨이 33.2%에서 43.2% 사이일 경우 유효한 것으로 간주하여 시장의 정확도 부족을 보완합니다.
캔들 하모닉스 삭제: 지정된 캔들 수(예: 1000개) 이후의 오래된 패턴을 제거하여 차트의 가독성을 개선합니다.
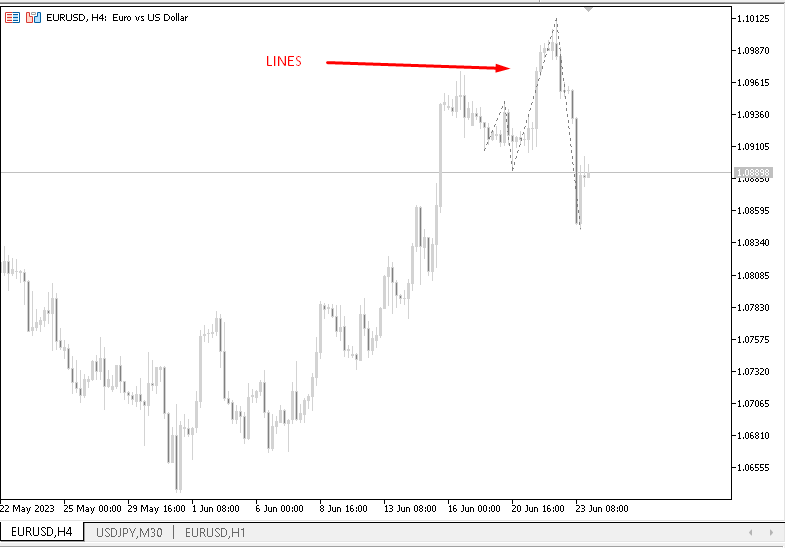
선 표시: 패턴이 완성되기 전에도 지표가 현재 분석 중인 충격과 되돌림(추세선)을 표시합니다.
지그재그 설정
깊이/편차/백스텝: 급등 감지 민감도를 조절합니다. 낮은 값은 빠른 움직임(스캘핑)을 감지하고, 높은 값은 큰 추세(스윙잉)를 걸러냅니다.
3. 시각적 해석 및 작동
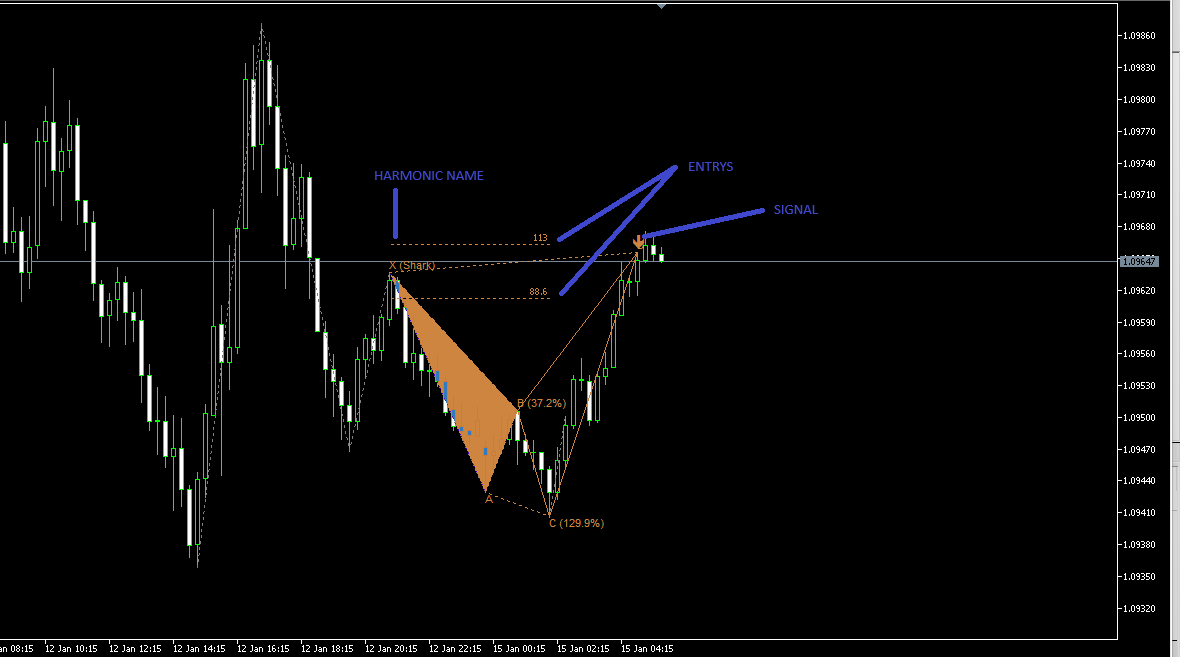
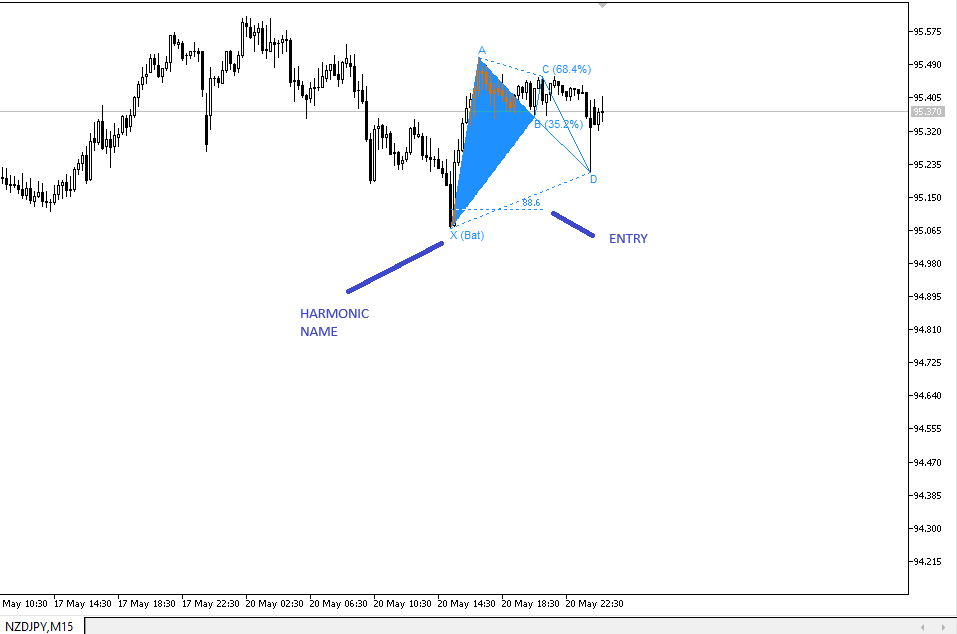
패턴 식별
지표는 X, A, B, C, D 지점을 연결하는 삼각형을 그립니다. 감지된 되돌림 비율은 B와 C 지점 옆에 표시됩니다. 가격이 반전 영역(D 지점)에 도달하면 시스템은 특정 진입 수준(예: "매수 진입 88.6")을 제시합니다.
신호 실행
확인: 신호 화살표가 나타날 때까지 기다립니다(매수는 파란색, 매도는 갈색).
실행: D 지점에 도달하면 수동 분석(반대 캔들 또는 지지선)을 추가하는 것이 좋습니다.
청산(TP): 시스템은 피보나치 기반 목표가 3개를 자동으로 예측합니다: TP1(38.2%), TP2(61.8%), TP3(100%).
4. 권장 사항
시간대: H1, H4, D1 시간대에서 가장 안정적으로 작동합니다.
위험 관리: 손절매는 X 지점 또는 예측된 D 레벨 외부에 설정하십시오.
시점: 변동성이 커져 하모닉 기하학이 무효화될 수 있으므로, 영향력이 큰 거시 경제 뉴스 발표 기간에는 거래를 피하십시오.