Smart Pivot Points

Smart Pivot Points for MetaTrader 5 — Clear Levels for Smart Trading
Smart Pivot Points is a professional indicator for MetaTrader 5 that automatically calculates and displays a full set of key trading levels on the chart. It transforms the chaos of price action into a clear structured map, highlighting support, resistance, price balance, and potential target zones. Designed for traders who value clarity, the tool works in any market: Forex, cryptocurrencies (Bitcoin, Ethereum), stock indices, stocks, and commodities (XAUUSD).

This indicator is your reliable analytical assistant, saving time on calculations and adding objectivity to your analysis. It doesn't provide market signals or make decisions for you, but rather provides a high-quality informational basis for your own informed trading decisions.

Key Features and Benefits
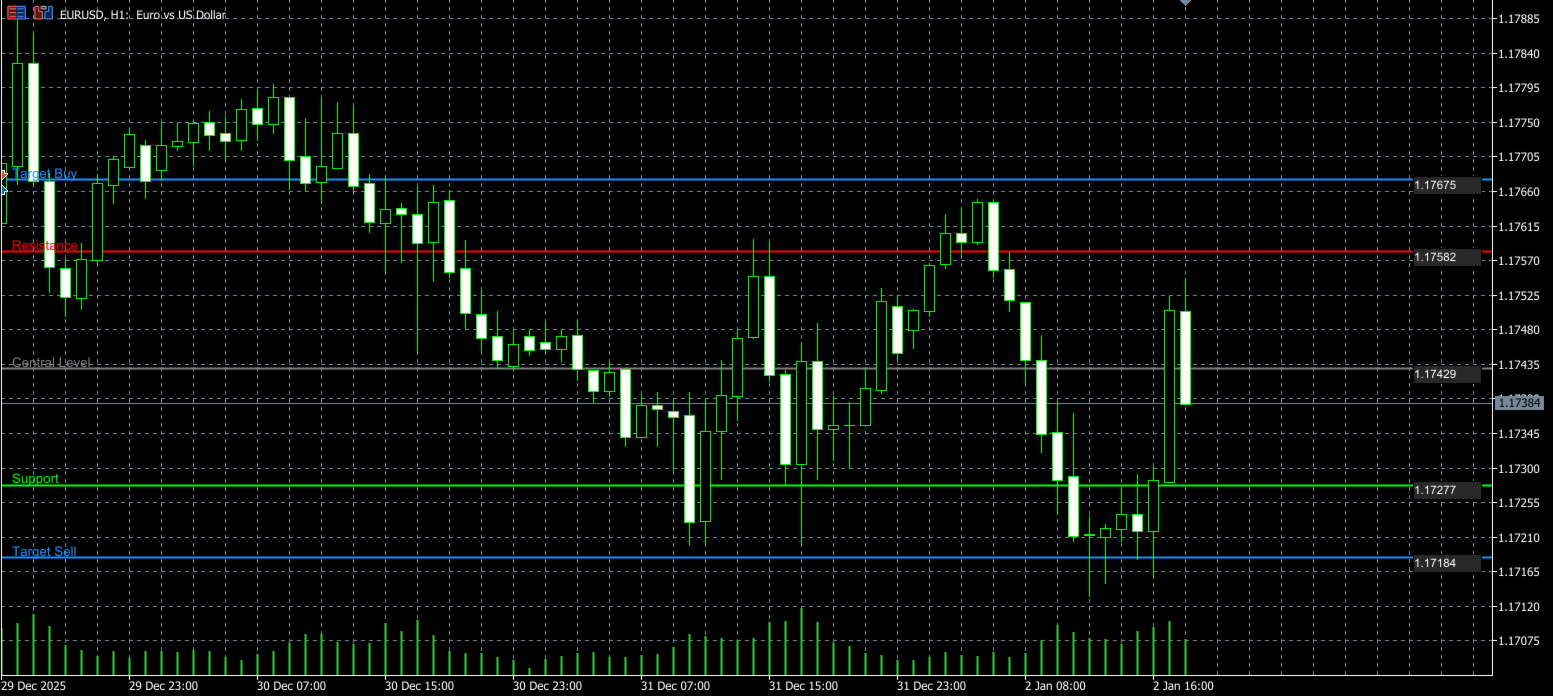
Ready-to-use price coordinate system: No more manually drawing levels. Five clear lines instantly appear on the chart: Central Level (Balance), Support, Resistance, Buy Target, and Sell Target.

Full visual customization: You decide what to display. Easily enable or disable level groups and price labels to tailor the chart to your strategy and keep the workspace clutter-free.

Complete calculation flexibility: Choose any timeframe for calculations—from minute (M5, M15) for scalping to daily (D1) and weekly (W1) for swing trading. Adjust the depth of analysis by specifying how many historical periods of data to use.

Professional and clean design: Levels are displayed in a well-thought-out color scheme (gray, green, red, blue), which is intuitive and does not distract from price monitoring.

How to Use Smart Pivot Points in Trading
The indicator automatically plots levels based on a proven algorithm using price data for the selected period (High, Low, Open, Close). This allows you to focus on analysis rather than arithmetic.

Typical Use Cases:

Planning Market Entries: Look for buying opportunities near Support and selling opportunities near Resistance. The indicator helps identify potential reversal and rebound points.

Setting Take-Profit Targets: The Buy and Sell Target levels serve as logical and reasonable benchmarks for profit-taking, replacing the need to set arbitrary targets.

Assessing Trade Risk and Potential: The distance between levels helps visually assess the potential reward-to-risk ratio (risk-reward) before entering a position.

Confirming Market Context: The price position relative to the Pivot Point allows you to quickly assess the current balance of power (bullish or bearish bias) on the selected timeframe.

Strengthen any trading strategy: Add objective Smart Pivot Points to your system based on Price Action, oscillators, or trend indicators for additional confirmation.

Getting started is easy.
Purchase and installation: Purchase Smart Pivot Points from the MQL5 Market. Click the "Install" button – the indicator will automatically download and appear in your MetaTrader 5 terminal.

Adding to a chart: Open a chart of the desired asset and timeframe. In the "Navigator" window, find Smart Pivot Points and drag it onto the chart.

Basic setup (optional): In the pop-up window, you can immediately configure two key parameters: the calculation timeframe (CalculationTF) and the depth of historical data (LookbackPeriods).

Analysis and trading: Use the generated grid of levels as part of your trading plan for decision making.

Technical Requirements and Support
Platform: MetaTrader 5 only.

Support: All buyers receive free indicator updates and technical support via the MQL5 messaging system.

Compatibility: The indicator works reliably on both computers and virtual private servers (VPS).

Risk Warning
Trading in financial markets carries a high risk of losing your invested capital. Smart Pivot Points is an analytical tool, not a guaranteed profit system. Before using it on real funds, be sure to test the indicator on a demo account. You are always responsible for your trading decisions. Trade only with capital you are prepared to lose.

Smart Pivot Points – add clarity to your trading so you can focus on what matters most.
Recommended products
Horizontal Level indicator - reflects, using a histogram, the horizontal volumes of transactions at a certain price without reference to time. At the same time, the histogram appears directly in the terminal window, and each column of the volume is easily correlated with the quote value of the currency pair. The volume of transactions is of great importance in exchange trading, usually an increase in the number of concluded contracts confirms the trend, and their reduction indicates an imminent
Fibonacci Auto Levels Pro MT5 – Retracements, Extensions & Pivot Points Fibonacci Auto Levels Pro MT5 is an advanced technical analysis tool that automatically detects market swing points and draws complete Fibonacci Retracement, Extension, and Pivot Point structures on the chart. This indicator combines several independent systems into one unified analytical tool: Pivot Points (Fibonacci Mode) Pivot Points are used to identify potential support and resistance zones based on the previous period’
DM IND Exclusive
Sergio Vidal Prado
Indicador Para Opções Binarias. Indicator for Binary Options Usa dois gales. Instalar em mt5 Esse indicador é para ser usado no tempo de vela de 5 minutos e em M5. Este também funciona em M1, porém é mais eficiente em M5. Só descompactar e copiar os arquivos na pasta de dados do seu MT5. Arquivos indicator na pasta MQL5 - Indicator. Baixe também a Media Movel totalmente gratis: https://www.mql5.com/pt/market/product/50400 Esse Indicador é para a próxima vela. Apareceu a seta, só aguardar a próx
Automatically plots the 'Golden Fibonacci Ratio’ between the High and Low of the previous day... ...Highs and Lows are great Support and Resistance zones. Breakouts of Fibonacci levels are key points for entry and exit of trades. Pink lines indicate that the previous day's Candle closed lower. Blue colored lines indicate that the previous day's Candle closed higher.
Harmonic Patterns Osw MT5
William Oswaldo Mayorga Urduy
User Manual: Harmonic Patterns OSW MT5 1. Introduction and Purpose Harmonic Patterns OSW is an advanced algorithmic analysis tool designed to automatically detect geometric price structures based on Fibonacci levels. The indicator uses a search engine linked to the ZigZag algorithm to filter market noise and locate high-probability areas where price tends to reverse. Its objective is to identify patterns such as Gartley, Bat, Butterfly, Crab, and Shark, allowing traders to anticipate market rev
Pivots Lines
Abakou Nazaire Ayelenou
5 (1)
Draw pivots points Traditionnal, Fibonacci, Woodie, Classic, Demark, Camarilla for any timeframe Support all type of pivot  Traditionnal ,   Fibonacci ,   Woodie ,   Classic ,   Demark ,   Camarilla Support any timeframe (M1...H1...D1...MN1...Yearly) Support server Daylight Saving Time Support forex daily section from Sydney open to US Close Support Crypto trading Fill The gap between pivot and the trend, very helpfull Pivot points show the direction of the trend and provide definitive areas to
FREE
If you like this product, please give it a  5 star rating as a token of appreciation. This indicator calculates and draws pivot points and support/resistance levels for both daily and weekly timeframes: Pivot (central) level Support levels S1, S2, S3 Resistance levels R1, R2, R3 It allows showing daily, weekly, or both sets of pivots , giving traders visual references for potential support/resistance areas. Pivot mode: Choose which pivots to display (weekly, daily, or both). Colors and style: C
FREE
TradingView Style Chart Watermark Transform your MetaTrader 5 charts to look as elegant and professional as TradingView. Are you tired of the default, plain look of MetaTrader? WaterMark MT5 is a lightweight, fully customizable indicator designed to enhance your charting experience by adding sleek, modern watermarks directly to your trading terminal. This indicator bridges the visual gap between standard MetaTrader charts and premium web based charting platforms. It allows you to display the cur
FREE
Liquidity Map
Alex Amuyunzu Raymond
Liquidity Map  Overview The Liquidity Map indicator is an advanced visualization tool based on ICT Smart Money Concepts . It automatically identifies daily Buy Zones , Sell Zones , and Liquidity Levels , showing where price is likely to reverse or continue based on institutional order flow. It calculates key levels from the daily session — such as the previous day’s high, low, and midpoint — then derives a premium (sell bias) and discount (buy bias) structure. When price trades into these mapped
SMA Fibonacci EA
Christoph Kreher
Simple EA with 1 SMA and Fibonacci. The Expertadvisor opens positions in the direction of the trend when price levels have exceeded or fallen below the Fibonacci levels. It depends on the market in question and which parameters to use. The EA is programmed in such a way that optimization runs consume little time. A news filter and filter by day of the week are built in.
Fibonacci Pullback EA
Rodrigo Alejandro Stemann Henriquez
Fibonacci Pullback EA detects the latest valid swing via symmetric pivots and projects a configurable Fibonacci level across that range. When the previous closed candle wicks into that level and confirms on close , the EA places an order with SL at the swing extreme plus a points buffer , and TP at the opposite swing extreme. Designed originally for EURUSD M30 and USDJPY M30 , yet fully configurable. Signal logic Determines the latest bearish or bullish swing using symmetric pivots. Computes a F
Pivot Scenario Dashboard is a compact trading indicator designed to display daily pivot-based market structure in a clean and professional dashboard. It automatically calculates the main pivot level, support and resistance zones, and scenario-based market bias for the current symbol. The indicator helps traders quickly identify: main pivot level bullish and bearish trigger areas support and resistance levels target projection levels current market scenario in a compact dashboard Main Features: D
Volume Trade Levels
Mahmoud Sabry Mohamed Youssef
The idea behind this indicator is very simple , First it contains 2 mechanisms to place your trades: 1- Enter the Pips you want to duplicate to price levels. 2- Automatically let the indicator specify the largest Buy / Sell Volume Candle and place duplicated levels based on the candle itself. How it works: 1- Enter the Pips you want to duplicate to price levels:    1- once the indicator is loaded you will need first to Specify the number of pips in the indicator Configuration window ,you can g
Market structures are the one which when breakout in higher timeframe may help clears a trend to a trader. 1. This indicator will draw ZigZag to only last 2 structures (previous high and low of ZigZag ) and a new bar of ZigZag will be only formed when break of structure happens 2. It gives Terminal and Push notificationon break of structure 3. Increase and Decrease Extdepth of ZigZag from "[" and "]" keys to adjust swing 4. Change colors of Line AB BC and CD 5. Add to many charts and get alerts
TransitTrendlines
Bonginkosi Innocent Khumalo
TransitTrendlines this is a automatically trendline drawer, it draw both horizontal and diagonal trendlines. The horizontal trendlines are the pivot points of the day timeframe and the diagonal trendlines are based on the current time frames. You can adjust the diagonal trendlines by increasing the number of bars to draw the diagonal trendline and can also adjust the steepness. Note that the Horizontal trendlines are based on the day pivot points not currant time frame. Join mql5 transitbk98 cha
FREE
This indicator is a **Pivot-Confluence Zone Identifier** that focuses exclusively on identifying key support and resistance levels where price clusters align with classic pivot points. Here's what it does: ## Core Functionality **Pivot Confluence Detection**:  - Only displays price zones that align with classic pivot point levels (R1, R2, R3, S1, S2, S3) - **Excludes the main pivot point** - focuses only on support and resistance levels - Uses a configurable pip range to detect confluence nea
FREE
Control Trading Support And Resistance Es un indicador independiente del TimeFrame que permite proyectar niveles más relevantes del mercado en función del plazo de tiempo de la operativa. Los colores del indicador están escogidos para diferenciar entre los diferentes tipos de niveles y destacar a los más relevantes. Este indicador permite visualizar en un mismo gráfico los posibles objetivos relevantes que los diferentes traders pueden emplear siguiendo diferentes tipos de operativas en funció
ArcTracer
Syed Oarasul Islam
This Indicator draws Fibonacci Arc levels in two different ways. You can select whether to draw Fibonacci Arc levels based on your favourite ZigZag settings or you can let the indicator to draw Arc levels based on given number of bars or candles.  You can also set Mobile and Email notification for your favourite Arc levels individually. With this indicator you will not have to feel lonely as the it can generate Voice alerts, which will keep you focused on your trading and remove boredom.  Produc
IFibonacci MT5
Marco Engstermann
Fibonacci MT5 Converted from MT4, Optimized MT5 Version. original MT4 code by Awran5. Non-Repainting Fibonacci Tool for MT5. Fibonacci indicator with a stable non-repainting swing detection engine. Support and questions via MQL5 product comments. For questions, updates, and to connect with other traders, join my official   MQL5 group ForexEAandMore Main Functions Custom Swing Detection Uses proprietary Reverse-Scan plus Peak-Climbing algorithm to find reliable swing highs and lows without repai
FREE
TeaCii Auto Fibonacci MTF is an implementation of Fibonacci Levels The indicator is simple and yet more powerful than those in the market IMPORTANT: UNIQUE SELLING POINTS - The Levels are set automatically - You can see ANY TIMEFRAME Levels in ANY Chart. E.g. Watch H1 on M1. Watch M1 on H1 - The Levels are available in Buffers for EA Use - Helps you to get an edge early in by using multi timeframe Parameters TimeFrame  :  The timeframe of the indicator. It can be same, higher or lower than the
Santo Oscilator
Gustavo Goncalves
5 (1)
Oscilador bem próximo que o indicador SANTO mostrado pelo Bo Williams em sua metodologia PhiCube, para mim este indicador ainda é melhor que o próprio SANTO original. Ótimo para entender a força e tendência de movimentos e possíveis divergências. Preço fazendo topo e o SANTO não renovando máxima, tudo indica que teremos uma reversão ou no mínimo um drawback.
ZigZag 100% Manual PRO Full control over your technical analysis. Draw 100% manual zigzags, mark Support/Resistance (SR) zones and Elliott Waves using numbers only. 2-color or 8-color mode Customizable lines and numbers (color, thickness, size) Numbers only – no letters Built-in chart buttons: START: Begin a new trace STOP: Save your current work CLEAR: Delete everything SHOW SR / HIDE SR: Toggle SR lines visibility Clean, accurate and structured analysis for visual traders  
Mogalef Bands MT5
Victor Tengo Quiles
Mogalef Bands — Dynamic Range Structure & Target Zones (MT5) Mogalef Bands is a visual market-structure indicator that models price as a dynamic range that shifts in stages. Instead of relying on isolated “signals”, it provides contextual levels to: identify where price is currently “working” (operating zone), locate potential extension areas (targets), and filter market noise through a non-impulsive, stable update logic (with inertia). It is designed for discretionary traders who want clear lev
My Pivot Pro
Ashok Kumar Singha
My Pivot Pro is the Pro Version of the Indicator " My PIVOT " ( Link:  https://www.mql5.com/en/market/product/90336 ) This indicator will help you a lot to decide the Market Range and Movement.  This Indicator is based on Pivot Lines and Support-Resistance zones. Now we can Plot Standard/Classic; Fibonacci; Demark; Camarilla nd Woodies Pivot Levels as per our requirements. Steps to Setup the Indicator: Install the Custom Indicator; Set the Pivot Type; Period and Time ( We recommend to use t
FiboZoneLines Short Description Automatically draws multi-layered Fibonacci zone lines from your manually placed Fibonacci retracement. No repainting. Fully customizable. Overview FiboZoneLines is a powerful Fibonacci-based indicator for MetaTrader 5 that automatically generates a complete set of multi-layered support and resistance lines from a single manually drawn Fibonacci retracement object on your chart. Unlike standard Fibonacci tools, FiboZoneLines divides the entire retracement range in
Phoenix Fibonacci
Nigel Nii Darku Narnor Darko
This indicator, often referred to as an Auto-Fibonacci Retracement Tool, is a technical analysis script designed to identify potential support and resistance levels based on the "Golden Ratio." Unlike the standard manual tool, this version automatically scans a specific lookback period (e.g., the last 100 candles) to find the absolute Swing High and Swing Low, drawing the levels for you in real-time. How to Use it for Trading 1. Entering a BUY Trade (Long) You use the Fibonacci levels to find "
FREE
Bar Sequential
Maximiliano Frisione Figueroa
This indicator can help you clearly identify trend changes in both bullish and bearish markets. The indicator compares the closing price of the last candle with the closing price of the candle "X" periods ago (input parameter). In an uptrend, an initial number '1' is plotted if a candle closes higher than the closing of a candle "X" periods ago. In a downtrend, an initial number '1' is plotted if a candle closes below the closing of a candle "X" periods ago. Subsequent numbers are plotted when e
FREE
Pulsar X
Dmitriq Evgenoeviz Ko
PULSAR X — Gold Market Momentum Monitoring The XAUUSD market doesn't forgive simple decisions. High volatility, false breakouts, and aggressive reactions to news make classic indicator-based strategies vulnerable. PULSAR X is a next-generation algorithmic system designed to accurately operate in market congestion and impulse exhaustion conditions. This is not a trend bot or an averaging mechanism. PULSAR X analyzes the moment when crowd pressure loses its force and the market moves from chaos t
Smart Trendlines MT5
Suvashish Halder
5 (3)
Smart Trendlines – No.1 Trendlines Indicator Smart Trendlines is a precision tool that automatically draws trendlines based on every valid pivot point, helping traders identify key support and resistance zones. It continuously adjusts as new market pivots form, providing a live and accurate reflection of price structure. Whether you’re tracking trends, preparing for reversals, or anticipating breakouts — this indicator keeps you one step ahead. It works seamlessly across all assets including For
Sequential Lock Fibo (v19) For sensitivity:Default is level is 80/20 make 65/35,65/40 Sequential Lock Fibo is a precision trend-trading tool designed for the MetaTrader 5 platform. It solves the two most common problems in Fibonacci trading: "repainting" (signals that disappear) and "freezing" (missing re-entry opportunities in long trends). This indicator combines a strict Trend Filter , a mechanical Setup Identifier , and a unique Sequential Logic engine to provide high-probability, non-repain
Buyers of this product also purchase
SuperScalp Pro
Van Minh Nguyen
4.63 (24)
SuperScalp Pro – Advanced Multi-Filter Scalping Indicator System SuperScalp Pro is an advanced scalping indicator that combines the classic Supertrend with multiple intelligent confirmation filters to help identify trading opportunities. It works efficiently across multiple timeframes from M1 to H4, with optimized performance on XAUUSD, BTCUSD, and major Forex pairs. The indicator provides clear Buy and Sell signals, along with automatically calculated entry price, stop loss, and take profit lev
Divergence Bomber
Ihor Otkydach
4.9 (89)
Each buyer of this indicator also receives the following for free: The custom utility "Bomber Utility", which automatically manages every trade, sets Stop Loss and Take Profit levels, and closes trades according to the rules of this strategy Set files for configuring the indicator for various assets Set files for configuring Bomber Utility in the following modes: "Minimum Risk", "Balanced Risk", and "Wait-and-See Strategy" A step-by-step video manual to help you quickly install, configure, and s
Entry In The Zone and SMC Multi Timeframe is a real-time 2-in-1 market analysis tool that combines market structure analysis and a No Repaint BUY / SELL signal system into a single indicator, built on Smart Money Concepts (SMC) — a widely adopted framework used by professional traders to understand market structure. This indicator helps you see the market more clearly, make decisions based on structure rather than guesswork, and focus on high-probability zones where price is more likely to react
SignalTech MT5 is an unique fully rule based trading system for EURUSD, USDCHF, USDJPY, AUDUSD, NZDUSD, EURJPY, AUDJPY, NZDJPY, CADJPY.  All the winning trades with chart setups are published on the comments page. 2026-05 3493 Pips (Until 05-21 NY Closed) 2026-04 2243 Pips 2026-03 2165 Pips 2026-02 2937 Pips 2026-01 2624 Pips 2025-12 1174 Pips It can generate signals with Buy/Sell Arrows and Pop-Up/Sound Alerts. Each signal has clear Entry and Stop Loss levels, which should be automatically flag
Azimuth Pro
Ottaviano De Cicco
5 (7)
Azimuth Pro V2: Synthetic Fractal Structure and Confirmed Entries for MT5 Overview Azimuth Pro is a multi-level swing structure indicator by Merkava Labs . Four nested swing layers, swing-anchored VWAP, ABC pattern detection, three-timeframe structural filtering, and closed-bar confirmed entries — one chart, one workflow from micro-swings to macro-cycles. This is not a blind signal product. It is a structure-first workflow for traders who care about location, context, and timing. V2 Launch Offe
Power Candles MT5
Daniel Stein
5 (8)
Power Candles V3 - Self-Optimizing Strength Indicator Power Candles V3 turns currency and instrument strength into an actionable trade plan on every chart it is attached to. Instead of just coloring candles, it runs a live auto-optimization in the background and hands you the best Stop Loss, Take Profit and signal threshold for the symbol in front of you. One click adopts it for live trading - entry, Stop Loss and Take Profit rays appear on the chart at the exact prices, and alerts fire with dir
ARIPoint
Temirlan Kdyrkhan
1 (1)
ARIPoint is a powerful trading companion designed to generate high-probability entry signals with dynamic TP/SL/DP levels based on volatility. Built-in performance tracking shows win/loss stats, PP1/PP2 hits, and success rates all updated live. Key Features: Buy/Sell signals with adaptive volatility bands Real-time TP/SL/DP levels based on ATR Built-in MA Filter with optional ATR/StdDev volatility Performance stats panel (Success, Profit/Loss, PP1/PP2) Alerts via popup, sound, push, or email Cu
FX Trend MT5 NG
Daniel Stein
5 (4)
FX Trend NG: The Next Generation Multi-Market Trend Intelligence Overview FX Trend NG is a professional multi-timeframe trend and market monitoring tool designed to give you a complete structural overview of the market in seconds. Instead of switching between dozens of charts, you instantly see which symbols are trending, where momentum is fading, and where strong alignment exists across timeframes. This tool is part of the Stein Investments ecosystem - 18+ tools plus Max, your 1-on-1 AI tradi
TREND CATCHER INDICATOR Trend Catcher Indicator analyzes market price movements, using a combination of the author’s proprietary and customized adaptive trend-analysis indicators.  It identifies the true market direction by filtering out short-term noise and focusing on underlying momentum strength, volatility expansion, and price structure behavior.  It also uses a combination of smoothing and trend-filtering customized indicators such as moving averages, RSI, and volatility filters.   Real ope
New Update of   Smart Trend Trading System MT5 For  2026 Market: If You Buy this Indicator you will Get my Professional Trade Manager + EA  for FREE . First of all Its worth emphasizing here that this Trading System is Non-Repainting   , Non Redrawing and Non Lagging Indicator Which makes it ideal from both manual and robot trading .  [Online course] , [manual] and [download presets] . The Smart Trend Trading System MT5 is a comprehensive trading solution tailored for new and experienced traders
KT Alpha Hunter Arrows MT5
KEENBASE SOFTWARE SOLUTIONS
Most arrow indicators give you a signal and leave you to figure out the rest. KT Alpha Hunter Arrows gives you the full trading plan. Every signal arrow prints with a full plan already drawn: entry line, stop-loss, four take-profit levels, and a live edge verdict telling you whether this symbol and time-frame is worth trading right now. An included Trade Manager EA handles the execution after you enter, so discipline stays intact when the market gets loud. Non-repaint. Closed-bar signals only. B
Introducing   Quantum Breakout PRO , the groundbreaking MQL5 Indicator that's transforming the way you trade Breakout Zones! Developed by a team of experienced traders with trading experience of over 13 years,   Quantum Breakout PRO   is designed to propel your trading journey to new heights with its innovative and dynamic breakout zone strategy. Quantum Breakout Indicator will give you signal arrows on breakout zones with 5 profit target zones and stop loss suggestion based on the breakout b
Gem SIGNAL
Shengzu Zhong
5 (1)
GEM Signal Pro GEM Signal Pro is a trend-following indicator for MetaTrader 5, designed for traders who want clearer signals, more structured trade setups, and practical risk management directly on the chart. Instead of showing only a simple arrow, GEM Signal Pro helps present the full trade idea in a cleaner and more readable way. When conditions are confirmed, the indicator can display the entry price, stop loss, and take profit targets on the chart, helping traders review the setup more effic
This dashboard shows the latest available   harmonic patterns   for the selected symbols, so you will save time and be more efficient /   MT4 version . Free Indicator:   Basic Harmonic Pattern Comparison of "Basic Harmonic Pattern" vs. "Basic Harmonic Patterns Dashboard" Indicators Feature Basic Harmonic Pattern Basic Harmonic Patterns Dashboard Functionality Detects and displays harmonic patterns on a single chart Searches multiple symbols and timeframes for harmonic patterns, displays res
Btmm state engine pro
Garry James Goodchild
5 (4)
BTMM State Engine Pro is a MetaTrader 5 indicator for traders who use the Beat The Market Maker approach: Asian session context, kill zone timing, level progression, peak formation detection, and a multi-pair scanner from a single chart. It combines cycle state logic with a built-in scanner dashboard so you do not need the same tool on many charts at once. What it does Draws the Asian session range; session times can follow broker server offset or be set in inputs. Tracks level progression (L
FX Power MT5 NG
Daniel Stein
5 (31)
FX Power: Analyze Currency Strength for Smarter Trading Decisions Overview FX Power is your go-to tool for understanding the real strength of currencies and Gold in any market condition. By identifying strong currencies to buy and weak ones to sell, FX Power simplifies trading decisions and uncovers high-probability opportunities. Whether you’re looking to follow trends or anticipate reversals using extreme delta values, this tool adapts seamlessly to your trading style. Don’t just trade—trade
Atomic Analyst MT5
Issam Kassas
3.94 (31)
New Update of   Atomic Analyst MT5 For  2026 Market: If You Buy this Indicator you will Get my Professional   Trade Manager + EA  for   FREE . First of all Its worth emphasizing here that this Trading Indicator is   Non-Repainting   , Non Redrawing and Non Lagging Indicator   Indicator, Which makes it ideal from both manual and robot trading.  User manual: settings, inputs and strategy . The Atomic Analyst  is a PA Price Action Indicator that uses Strength and Momentum of the price to find a bet
OrderFlux | Footprint Orderflow for MetaTrader 5 Version 2.0 – Real-time Bid/Ask Visualization for Active Traders OrderFlux is a footprint and orderflow indicator for MT5. It shows not only where the price has moved, but what happens inside the movement: Bid/Ask volume per price level, delta, imbalance, and volume distribution. Many charts only show you the final result of a candle. OrderFlux shows you the path to get there. This is exactly what helps when you want to read market participation i
Quantum TrendPulse
Bogdan Ion Puscasu
5 (25)
Introducing Quantum TrendPulse , the ultimate trading tool that combines the power of SuperTrend , RSI , and Stochastic into one comprehensive indicator to maximize your trading potential. Designed for traders who seek precision and efficiency, this indicator helps you identify market trends, momentum shifts, and optimal entry and exit points with confidence. Key Features: SuperTrend Integration: Easily follow the prevailing market trend and ride the wave of profitability. RSI Precision: Detect
RelicusRoad Pro MT5
Relicus LLC
4.96 (24)
RelicusRoad Pro: Quantitative Market Operating System 70% OFF LIFETIME ACCESS (LIMITED TIME) - JOIN 2,000+ TRADERS Why do most traders fail even with "perfect" indicators? Because they trade Single Concepts in a vacuum. A signal without context is a gamble. To win consistently, you need CONFLUENCE . RelicusRoad Pro is not a simple arrow indicator. It is a complete Quantitative Market Ecosystem . It maps the "Fair Value Road" price travels on, distinguishing between random noise and true structur
Grabber System MT5
Ihor Otkydach
4.83 (23)
Let me introduce you to an excellent technical indicator – Grabber, which works as a ready-to-use "All-Inclusive" trading strategy. Within a single code, it integrates powerful tools for technical market analysis, trading signals (arrows), alert functions, and push notifications. Every buyer of this indicator also receives the following for free: Grabber Utility for automatic management of open orders Step-by-step video guide: how to install, configure, and trade with the indicator Custom set fi
First of all Its worth emphasizing here that this Trading Tool is Non Repainting , Non Redrawing and Non Lagging Indicator , Which makes it ideal for professional trading . [Online course] ,   and   [manual] The Smart Price Action Concepts Indicator is a very powerful tool for both new and experienced traders . It packs more than 20 useful indicators into one , combining advanced trading ideas like Inner Circle Trader Analysis and Smart Money Concepts Trading Strategies . This indicator focuses
Trend Forecaster
Alexey Minkov
5 (7)
Trend Forecaster – Since 2023. The Trend Forecaster indicator utilizes a unique proprietary algorithm to determine entry points for a breakout trading strategy. The indicator identifies price clusters, analyzes price movement near levels, and provides a signal when the price breaks through a level. The Trend Forecaster indicator is suitable for all financial assets, including currencies (Forex), metals, stocks, indices, and cryptocurrencies. You can also adjust the indicator to work on any time
Meridian Pro
Ottaviano De Cicco
5 (2)
Meridian Pro 2.00: Professional Multi-Timeframe Trend Matrix for MT5 Meridian Pro 2.00 is a professional adaptive trend matrix for MetaTrader 5. It combines the original Meridian trend engine, a clean chart ribbon, closed-bar signal arrows, an 8-timeframe dashboard, Fuel momentum, weighted consensus, synthetic HTF processing and chart-native higher-timeframe context lines. The goal is simple: read current trend, multi-timeframe structure, strength, momentum and EA-ready state from one discipline
Reversal Master for MT5 Reversal Master for MT5 is a non‑repainting reversal indicator for MetaTrader 5. It helps you detect potential market reversal points and shows the maximum favourable price movement after each historical signal, so you can better understand how price behaved after similar situations in the past. The MT5 version keeps the familiar reversal‑signal logic of the original Reversal Master for MT4, but adds improved visualisation, historical statistics and a points summary panel
Blahtech Supply Demand MT5
Blahtech Limited
4.54 (13)
Was: $299  Now: $99  Supply Demand uses previous price action to identify potential imbalances between buyers and sellers. The key is to identify the better odds zones, not just the untouched ones. Blahtech Supply Demand indicator delivers functionality previously unavailable on any trading platform. This 4-in-1 indicator not only highlights the higher probability zones using a multi-criteria strength engine, but also combines it with multi-timeframe trend analysis, previously confirmed swings a
PZ Trend Trading MT5
PZ TRADING SLU
3.8 (5)
Capture every opportunity: your go-to indicator for profitable trend trading Trend Trading is an indicator designed to profit as much as possible from trends taking place in the market, by timing pullbacks and breakouts. It finds trading opportunities by analyzing what the price is doing during established trends. [ Installation Guide | Update Guide | Troubleshooting | FAQ | All Products ] Trade financial markets with confidence and efficiency Profit from established trends without getting whips
Smart Multi-Layer Breakout & Pullback Detector for MetaTrader 5 "Smart Simple Fast!" Are you tired of missing high-probability breakout entries? Are you spending hours scanning multiple charts, trying to align breakouts with trend direction and currency momentum — only to miss the move? Break Pullback solves all of that in one indicator. What Is Break Pullback? Break Pullback is a professional-grade MetaTrader 5 indicator built specifically for traders who trade market structure, breakouts, an
The AX Forex Indicator MT5 is a sophisticated trading tool designed to provide traders with a comprehensive analysis of multiple currency pairs. This   powerful indicator   simplifies the complex nature of the forex market, making it accessible for both novice and experienced traders. AX Forex Indicator uses   advanced algorithms   to detect trends, patterns and is an essential tool for traders aiming to enhance their forex trading performance. With its robust features, ease of use, and reliabl
Contact me after purchase to get EA based on this indicator as Bonus ChandraSAR Optimizer: The Self-Adapting Quantitative Trend Engine Most trend indicators fail for one simple reason: markets change, but static parameters don't. ChandraSAR Optimizer bridges the gap between simple signal generation and advanced algorithmic testing. It is a dynamic trend-following system for MetaTrader 5 that solves the problem of shifting volatility by embedding a highly efficient, array-based Walk-Forward opti
More from author
Candle Color Day - Colored Candlestick Indicator by Day of the Week What is it? A simple visual tool that colors candlesticks on a chart depending on the day of the week. Monday is one color, Tuesday is another, and so on. Have you ever wondered how often prices behave a certain way on specific days of the week? This indicator helps you see such patterns. Who is it for? For traders who: Want to quickly determine the day of the week using historical data Look for seasonal patterns in price a
FREE
This utility displays economic news directly on the chart. It shows upcoming events, the time until their release, their importance, and sends notifications. For: For traders who follow economic news For those who trade on the news For traders who want to receive timely alerts For users who need a simple and intuitive calendar right on the chart Key Features News Panel - Shows the nearest economic event on the chart Currency Filter - Displays only news for the currencies of your trading
FREE
Account Info AS Ьis a powerful information script for MetaTrader 4 that displays complete information about your trading account directly on the chart. The script provides all the necessary data for account analysis, risk management, and trading decision making. Main Features Complete Financial Information Account Type (Demo/Real/Contest) Balance, Equity, and Margin Free Margin in Cash and Percentage Margin Level Current Profit/Loss Risk Management Margin Call and Stop Out Levels Margin
FREE
Candle Color Day - Colored Candlestick Indicator by Day of the Week What is it? A simple visual tool that colors candlesticks on a chart depending on the day of the week. Monday is one color, Tuesday is another, and so on. Have you ever wondered how often prices behave a certain way on specific days of the week? This indicator helps you see such patterns. Who is it for? For traders who: Want to quickly determine the day of the week using historical data Look for seasonal patterns in price a
FREE
Account Info AS
Alexandr Saprykin
Account Info AS is a powerful information script for MetaTrader 5 that displays complete information about your trading account directly on the chart. The script provides all the necessary data for account analysis, risk management, and trading decision making. Main Features Complete Financial Information Account Type (Demo/Real/Contest) Balance, Equity, and Margin Free Margin in Cash and Percentage Margin Level Current Profit/Loss Risk Management Margin Call and Stop Out Levels Margin C
FREE
This indicator is for the MT5 platform Version 4.4 A professional indicator for detecting the Engulfing Pattern with a flexible confirmation system on lower timeframes. Key Features: Flexible timeframe settings Fully customizable lower timeframes for confirmation Any combination can be used: M1-M5-M15, M5-M15-H1, M15-H1-H4, etc. Suitable for any trading style and strategy Three-level signal confirmation Weak confirmation (customizable timeframe) — yellow arrows Medium confirmation (custo
Smart Pivot Points for MetaTrader 4 — Clear Levels for Smart Trading Smart Pivot Points is a professional indicator for MetaTrader 4 that automatically calculates and displays a full set of key trading levels on the chart. It transforms the chaos of price action into a clear structured map, highlighting support, resistance, price balance, and potential target zones. Designed for traders who value clarity, the tool works in any market: Forex, cryptocurrencies (Bitcoin, Ethereum), stock indices,
Trend Candle — Instant Trend Reading Indicator The Trend Candle indicator automatically colors your chart candles, turning complex analysis into a visually understandable picture. Instantly determine market strength and direction: green for an uptrend, red for a downtrend, and gray for a neutral phase. The tool is based on the synchronization of two adaptive filters, providing clear signals without unnecessary noise. Key Benefits Instant trend visualization: Market direction is determined at
The reduced price is valid for early buyers! After that, the price will be $100. Engulfing Pattern Dashboard — Multi-symbol Engulfing Pattern Scanner with Confirmation on Lower Timeframes Product Description Engulfing Pattern Dashboard is a powerful and convenient tool for traders based on the classic Japanese candlestick pattern, the Bullish/Bearish Engulfing. The indicator automatically scans up to 30 trading instruments simultaneously, identifying new signals in real time and displaying the
This indicator is for the MT4 platform is here  Version 4.4 Professional indicator for detecting Engulfing Candlestick Patterns with multi-timeframe confirmation. Key Features: Flexible Timeframe Configuration Fully customizable lower timeframes for confirmation Use any combination: M1-M5-M15, M5-M15-H1, M15-H1-H4, etc. Adapts to any trading style and strategy Three-Level Signal Confirmation Weak confirmation (custom TF) - yellow arrows Medium confirmation (custom TF) - blue arrows Strong confir
Trande Candle
Alexandr Saprykin
Trend Candle — Instant Trend Reading Indicator The Trend Candle indicator automatically colors your chart candles, turning complex analysis into a visually understandable picture. Instantly determine market strength and direction: green for an uptrend, red for a downtrend, and gray for a neutral phase. The tool is based on the synchronization of two adaptive filters, providing clear signals without unnecessary noise. Key Benefits Instant trend visualization: Market direction is determined at
Filter:
No reviews
Reply to review