Harmonic Patterns Osw MT5
- Indicatori
-
William Oswaldo Mayorga Urduy
 MQL4 and MQL5 trader and developer since February 2019, delivering projects in under one day and providing post-delivery technical support.
Optimized code, advanced logic, and high-quality code. - Versione: 1.1
- Aggiornato: 20 maggio 2024
- Attivazioni: 5
Manuale utente: Harmonic Patterns OSW MT5
1. Introduzione e scopo
Harmonic Patterns OSW è uno strumento di analisi algoritmica avanzato progettato per rilevare automaticamente strutture geometriche di prezzo basate sui livelli di Fibonacci. L'indicatore utilizza un motore di ricerca collegato all'algoritmo ZigZag per filtrare il rumore di mercato e individuare aree ad alta probabilità in cui il prezzo tende a invertirsi. Il suo obiettivo è identificare pattern come Gartley, Pipistrello, Farfalla, Granchio e Squalo, consentendo ai trader di anticipare le inversioni di mercato con precisione professionale.
2. Guida ai parametri (Menu di inserimento)
Selezione del pattern (MOSTRA ARMONICHE)
Mostra indefinito: mostra strutture tecniche che, pur non rientrando in una categoria classica, mantengono una geometria di Fibonacci rilevante per l'analisi manuale.
Mostra Gartley / Pipistrello / Farfalla / Granchio / Squalo: singoli pulsanti per attivare o disattivare la ricerca di ciascun pattern specifico in base alla propria strategia.
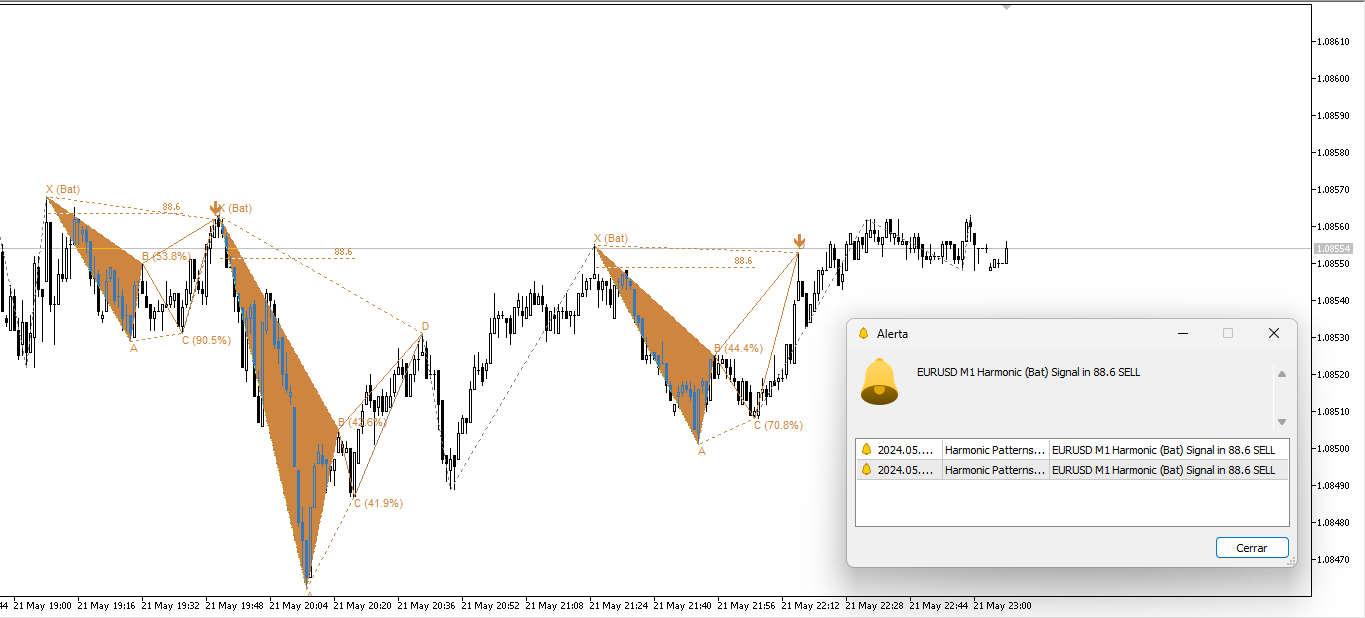
Sistema di avvisi (ALERTS)
Segnale a candela: definisce la tempistica delle notifiche. Candle_0 avvisa in tempo reale quando il livello viene raggiunto; Candle_1 avvisa una volta che la candela è confermata (più conservativo).
Invia avviso PC / Mail / Mobile: attiva notifiche sonore, email o notifiche push all'app MT5 sul tuo dispositivo mobile.
Configurazione visiva e geometria
Colore rialzista / ribassista: personalizza i colori delle strutture di acquisto (rialzista) e vendita (ribassista).
Gradi consentiti: questo è il fattore di tolleranza. Se un livello dovrebbe essere del 38,2% e si configurano 5 gradi, l'indicatore convaliderà il punto se è compreso tra il 33,2% e il 43,2%, compensando la mancanza di precisione del mercato.
Candle Delete Harmonics: controlla la chiarezza del grafico rimuovendo i vecchi pattern dopo il numero specificato di candele (ad esempio, 1000) per evitare confusione visiva.
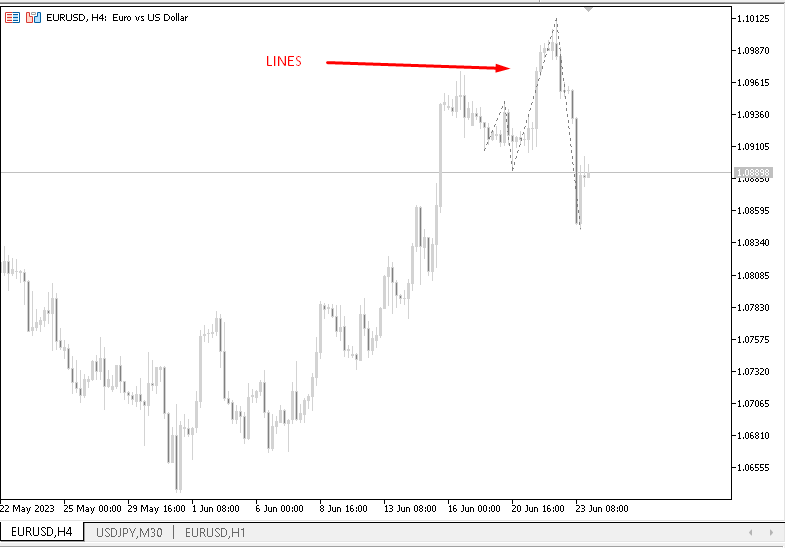
Mostra Linee: mostra gli impulsi e i ritracciamenti (linee di tendenza) che l'indicatore sta analizzando, anche prima che un pattern sia completato.
Impostazioni ZigZag
Profondità / Deviazione / BackStep: controlla la sensibilità del rilevamento dei picchi. Valori bassi rilevano movimenti rapidi (scalping); valori alti filtrano i trend più ampi (oscillazioni).
3. Interpretazione visiva e funzionamento
Identificazione del Pattern
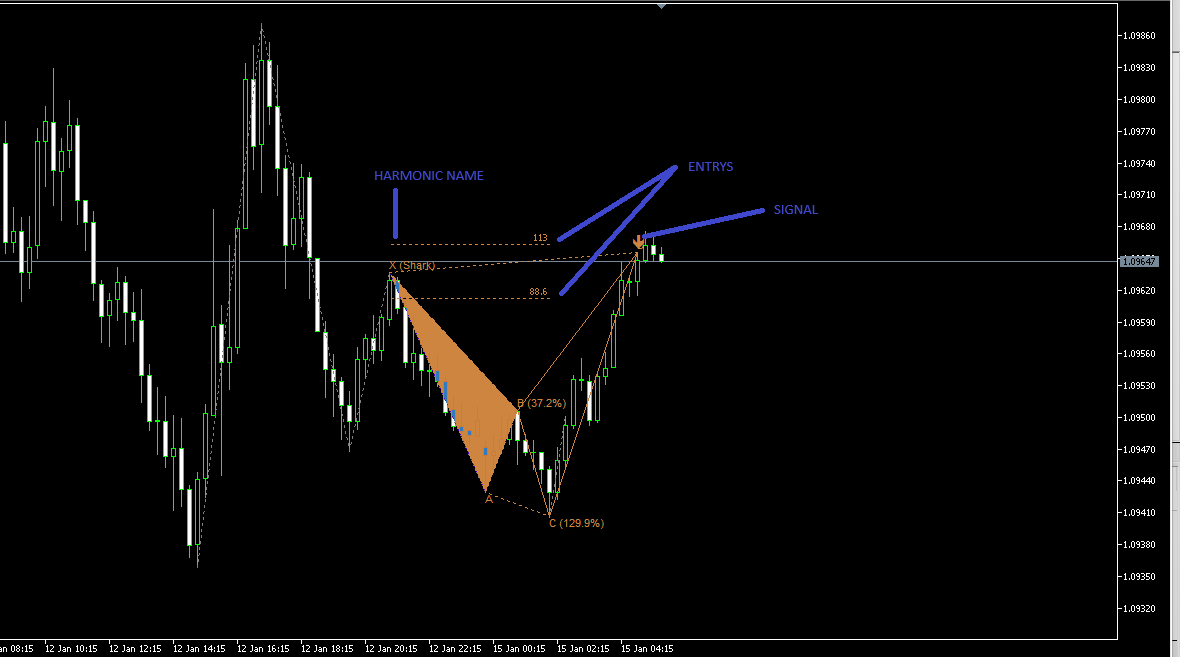
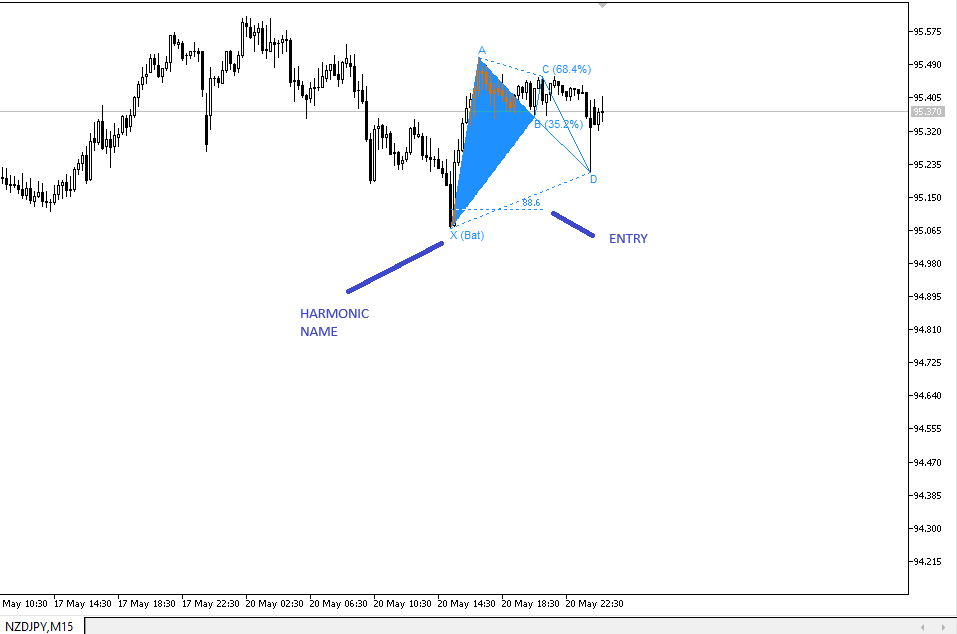
L'indicatore disegnerà dei triangoli che collegano i punti X, A, B, C e D. La percentuale di ritracciamento rilevata apparirà accanto ai punti B e C. Quando il prezzo raggiunge la Zona di Inversione (punto D), il sistema proietterà livelli di ingresso specifici (ad esempio, "Ingresso ACQUISTO 88,6").
Esecuzione del Segnale
Conferma: attendi che appaia la freccia del segnale (blu per acquisto / marrone per vendita).
Esecuzione: si consiglia di aggiungere un'analisi manuale (candele di rifiuto o livelli di supporto) al raggiungimento del punto D.
Uscita (TP): il sistema proietta automaticamente tre obiettivi basati su Fibonacci: TP1 (38,2%), TP2 (61,8%) e TP3 (100%).
4. Raccomandazioni
Intervalli temporali: funziona in modo più affidabile sugli intervalli temporali H1, H4 e D1.
Gestione del rischio: posizionare lo Stop Loss al di fuori del punto X o del livello D previsto.
Contesto: evitare di fare trading durante eventi di notizie macroeconomiche ad alto impatto, poiché la volatilità spesso invalida la geometria armonica.