Everything about RSI
Calculation
The RSI is a fairly simple formula, but is difficult
to explain without pages of examples. Refer to Wilder's book
for additional calculation information.
The basic formula is:
RSI = 100 - --------1001 + RS
RS = Average Gain / Average Loss
Average Gain = [(previous Average Gain) x 13 + current Gain] / 14
First Average Gain = Total of Gains during past 14 periods / 14
Average Loss = [(previous Average Loss) x 13 + current Loss] / 14
First Average Loss = Total of Losses during past 14 periods / 14
Note: "Losses" are reported as positive values.
Below you can find an spreadsheet to calculate RSI manually
Trading systems:
RSI of Moving Average trading system: original thread is here.
MAofRSI trading system: elite section thread.
Some example of using RSI on D1 chart: this page.
Signal-generator to show MAs crossing when overlayed on RSI: thread with trading sstem with new indicators coded.
RSI_mode_system is here.
Ideas:
RSI ADX Stochastic: trading system development thread.
Simple MA Cross w RSI and Stochastic filter: just an idea with rules.
RSI EA: the other idea to create EA.
NewTrend Oscillator vs RSI-14: good evaluation thread.
Laguerre RSI with Filter: some evaluation.
Indicators:
Dynamic Zone RSI: good public thread with some indicators and trading systems examples.
SMA_RSI indicator with many versions: indicators and explanation.
RSI in Histogram: good thread with some indicators.
MTF RSI Bar Indicators: original thread.
RSICross_Signal_v1 and RSI_X2_alarm indicators: elite section post.
RSI with alert is here and here.
RSI MA Signal and T3_RSI indicators: original thread.
RSI indicators: thread with many RSI indicators posted - SelfAdjustRSI_v1; KRSI (good indicator); #RSI-3TF; D_RSI,; DT-RSI-Sig; Dynamic Zone RSI; Fisher RSI Oscillator; F-RSI; Laguerre RSI; RSI trader v0.10; RSI (as a custom indicator); RSI-3TF; RSIFilter_v1; SMARSI_v1, v2 and v3; StepRSI_v2; StepRSI_v5.2; T3_RSI; TrendRSI_v1.
Inverse Fisher Transform of RSI: small thread with 2 versions of the indicator.
RSIFilter indicators: thread with original article as an idea and indicator based on it with simple and MTF versions.
RSI in 3 Time Frames in one window by one indicator: original thread.
Bollinger Band of RSI: indicator.
Trend RSI Indicator: elite section post with indicator and settings; and public thread with indicator.
RSI & Momentum Color+Alarm: small thread with very good indicators.
Moving Average Cross with RSI Confirmation: thread with few indicators combined in one indicator with the rules.
RSIvar_v1 indicator: thread with indicator using any kind of ma indiocator with the settings:
Code:
Price = 0; // Applied Price(0-Close;1-Open;2-High;3-Low;4-Median;5-Typical;6-Weighted)
Length = 27; // Period of evaluation
MA_Mode = 1; //Mode of MA (0-SMA;1-EMA;2-SMMA;3-LWMA)
Hi ND,
What happen with this thread? Looks like the old thread was disappeared & the link doesn't work.
It was bug or something: when moderating the first post of the thread so the whole thread may be disappeared sometimes (i did not delete the thread and did not moderate the forum in that time). It is possible to restore using forum database backup but the whole forum only and not a particular thread.
Thus, it is the new thread instead of old one.
It was bug or something: when moderating the first post of the thread so the whole thread may be disappeared sometimes (i did not delete the thread and did not moderate the forum in that time). It is possible to restore using forum database backup but the whole forum only and not a particular thread. Thus, it is the new thread instead of old one.
Yes. It was my problem when I was moderating the first post. Removing one posts ended in a thread deletion. One of many things that vbulletin needs to fix or warn  .
.
I made this RSI pack zip file with the 45 RSI based indicators I have (with the exception of Elite ones).
hi
hi newdigital
I dont like that some indicators suddenly dissapear like mladens rsi band or channels...
i think in the elite section
regards
lodol2
No,
It was explained.
...i think in the elite section
regards
lodol2It is on this public post https://www.mql5.com/en/forum/178733 inside the attachments.
... indicators suddenly dissapear ....
Guys, as ND explained: this thread by mistake has been deleted - many links gone (very sorry) - so we have to restore it what's possible - add indis, build the thread again...
RSI_Color_RSI_v1.01_Maxim.mq4 (14.0 KB) ( Mladen's Color_RSI_v1.01 with all bells and wistles )
RSIPeriod = 14;
PriceType = 5;
timeFrame = "Current time frame";
OverBought = 70;
OverSold = 30;
showArrows = true;
ArrowUpColor = LimeGreen;
ArrowDnColor = Maroon;
UpDnArrowSize = 0;
RevUpColor = MediumSeaGreen;
RevDnColor = Red;
RevArrowSize = 1;
Signal_Gap= 1.3;
alertsOn = false;
OBOS_Level_crossAlert = false;
Level_50_crossAlert = true;
alertsMessage = true;
alertsSound = false;
alertsEmail = false;
MaxArrowsScreensX = 3;
- Free trading apps
- Over 8,000 signals for copying
- Economic news for exploring financial markets
You agree to website policy and terms of use
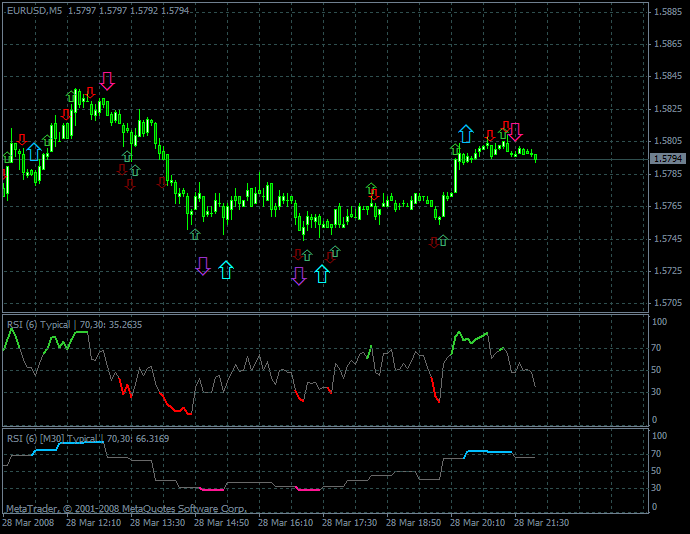
RSI indicator
We are continuing discussion about the indicators.
We have the following thread:
Parabolic SAR indicator
Momentum indicator
Stochastic Oscillator
Divergence Indicator
Now we are talking about RSI.
"Technical Analysis from A to Z":
The Relative Strength Index ("RSI") is
a popular oscillator.
It was first introduced by
Welles Wilder in an article
in Commodities (now known as Futures)
Magazine in June, 1978.
Step-by-step instructions on calculating
and interpreting
the RSI are also provided in
Mr. Wilder's book,
New Concepts in Technical
Trading Systems.
The name "Relative Strength Index"
is slightly misleading
as the RSI does not compare
the relative strength of two securities,
but rather the internal strength of
a single security.
A more appropriate name might
be "Internal Strength Index."
Relative strength charts that compare
two market indices,
which are often referred to as
Comparative Relative Strength.
Wilder, J. Welles. New Concepts
in Technical Trading Systems. Greensboro, NC: Trend Research, 1978.[/CODE]
When Wilder introduced the RSI,
he recommended using a 14-day RSI.
Since then, the 9-day and 25-day
RSIs have also gained popularity.
Because you can vary the number
of time periods
in the RSI calculation, I suggest
that you experiment
to find the period that works best for you.
(The fewer days used to calculate the RSI,
the more volatile the indicator.)
The RSI is a price-following oscillator
that ranges between 0 and 100.
A popular method of analyzing the RSI
is to look for a divergence
in which the security is making a new high,
but the RSI is failing to surpass its previous high.
This divergence is an indication of an impending reversal.
When the RSI then turns down and
falls below its most recent trough, it is said
to have completed a "failure swing."
The failure swing is considered a confirmation
of the impending reversal.
In Mr. Wilder's book, he discusses five uses
of the RSI in analyzing commodity charts.
These methods can be applied to other security
types as well.[CODE]Tops and Bottoms.
The RSI usually tops above 70 and bottoms below 30.
It usually forms these tops and bottoms before
the underlying price chart.
Chart Formations.
The RSI often forms chart patterns such
as head and shoulders (page 215) or triangles (page 216)
that may or may not be visible on the price chart.
Failure Swings.
also known as support or resistance penetrations or breakouts).
This is where the RSI surpasses a previous high (peak) or
falls below a recent low (trough).
Support and Resistance.
The RSI shows, sometimes more clearly than price themselves,
levels of support and resistance.
Divergences.
As discussed above, divergences occur when the price makes
a new high (or low) that is not confirmed by a new high (or low) i
n the RSI. Prices usually correct and move in the direction
of the RSI.
For additional information on the RSI, refer
to Mr. Wilder's book:
on amazon com
for example.
Calculation
The RSI is a fairly simple formula, but is difficult
to explain without pages of examples. Refer to Wilder's book
for additional calculation information.