
What it is
ATT Strategy Journal is an account journal that lives on a chart. It reads the terminal's trade history, rebuilds closed and open positions from the deals and splits the result by Expert Advisor, strategy, symbol and magic number. Every row receives a score from 0 to 100, a grade, risk marks and a short written verdict built from its own figures. The rebuilt ledger is checked against the account balance to the cent.
The panel only reads. It contains no trading calls: no order is opened, modified or closed, and no DLL is used. Two side effects exist outside trading. A symbol of a position may be added to Market Watch so that the terminal loads its price history. The chart that hosts the panel hides its own scales, grid and trade levels and gives its keyboard to the panel while the panel runs; the chart's previous settings return when the panel is removed.
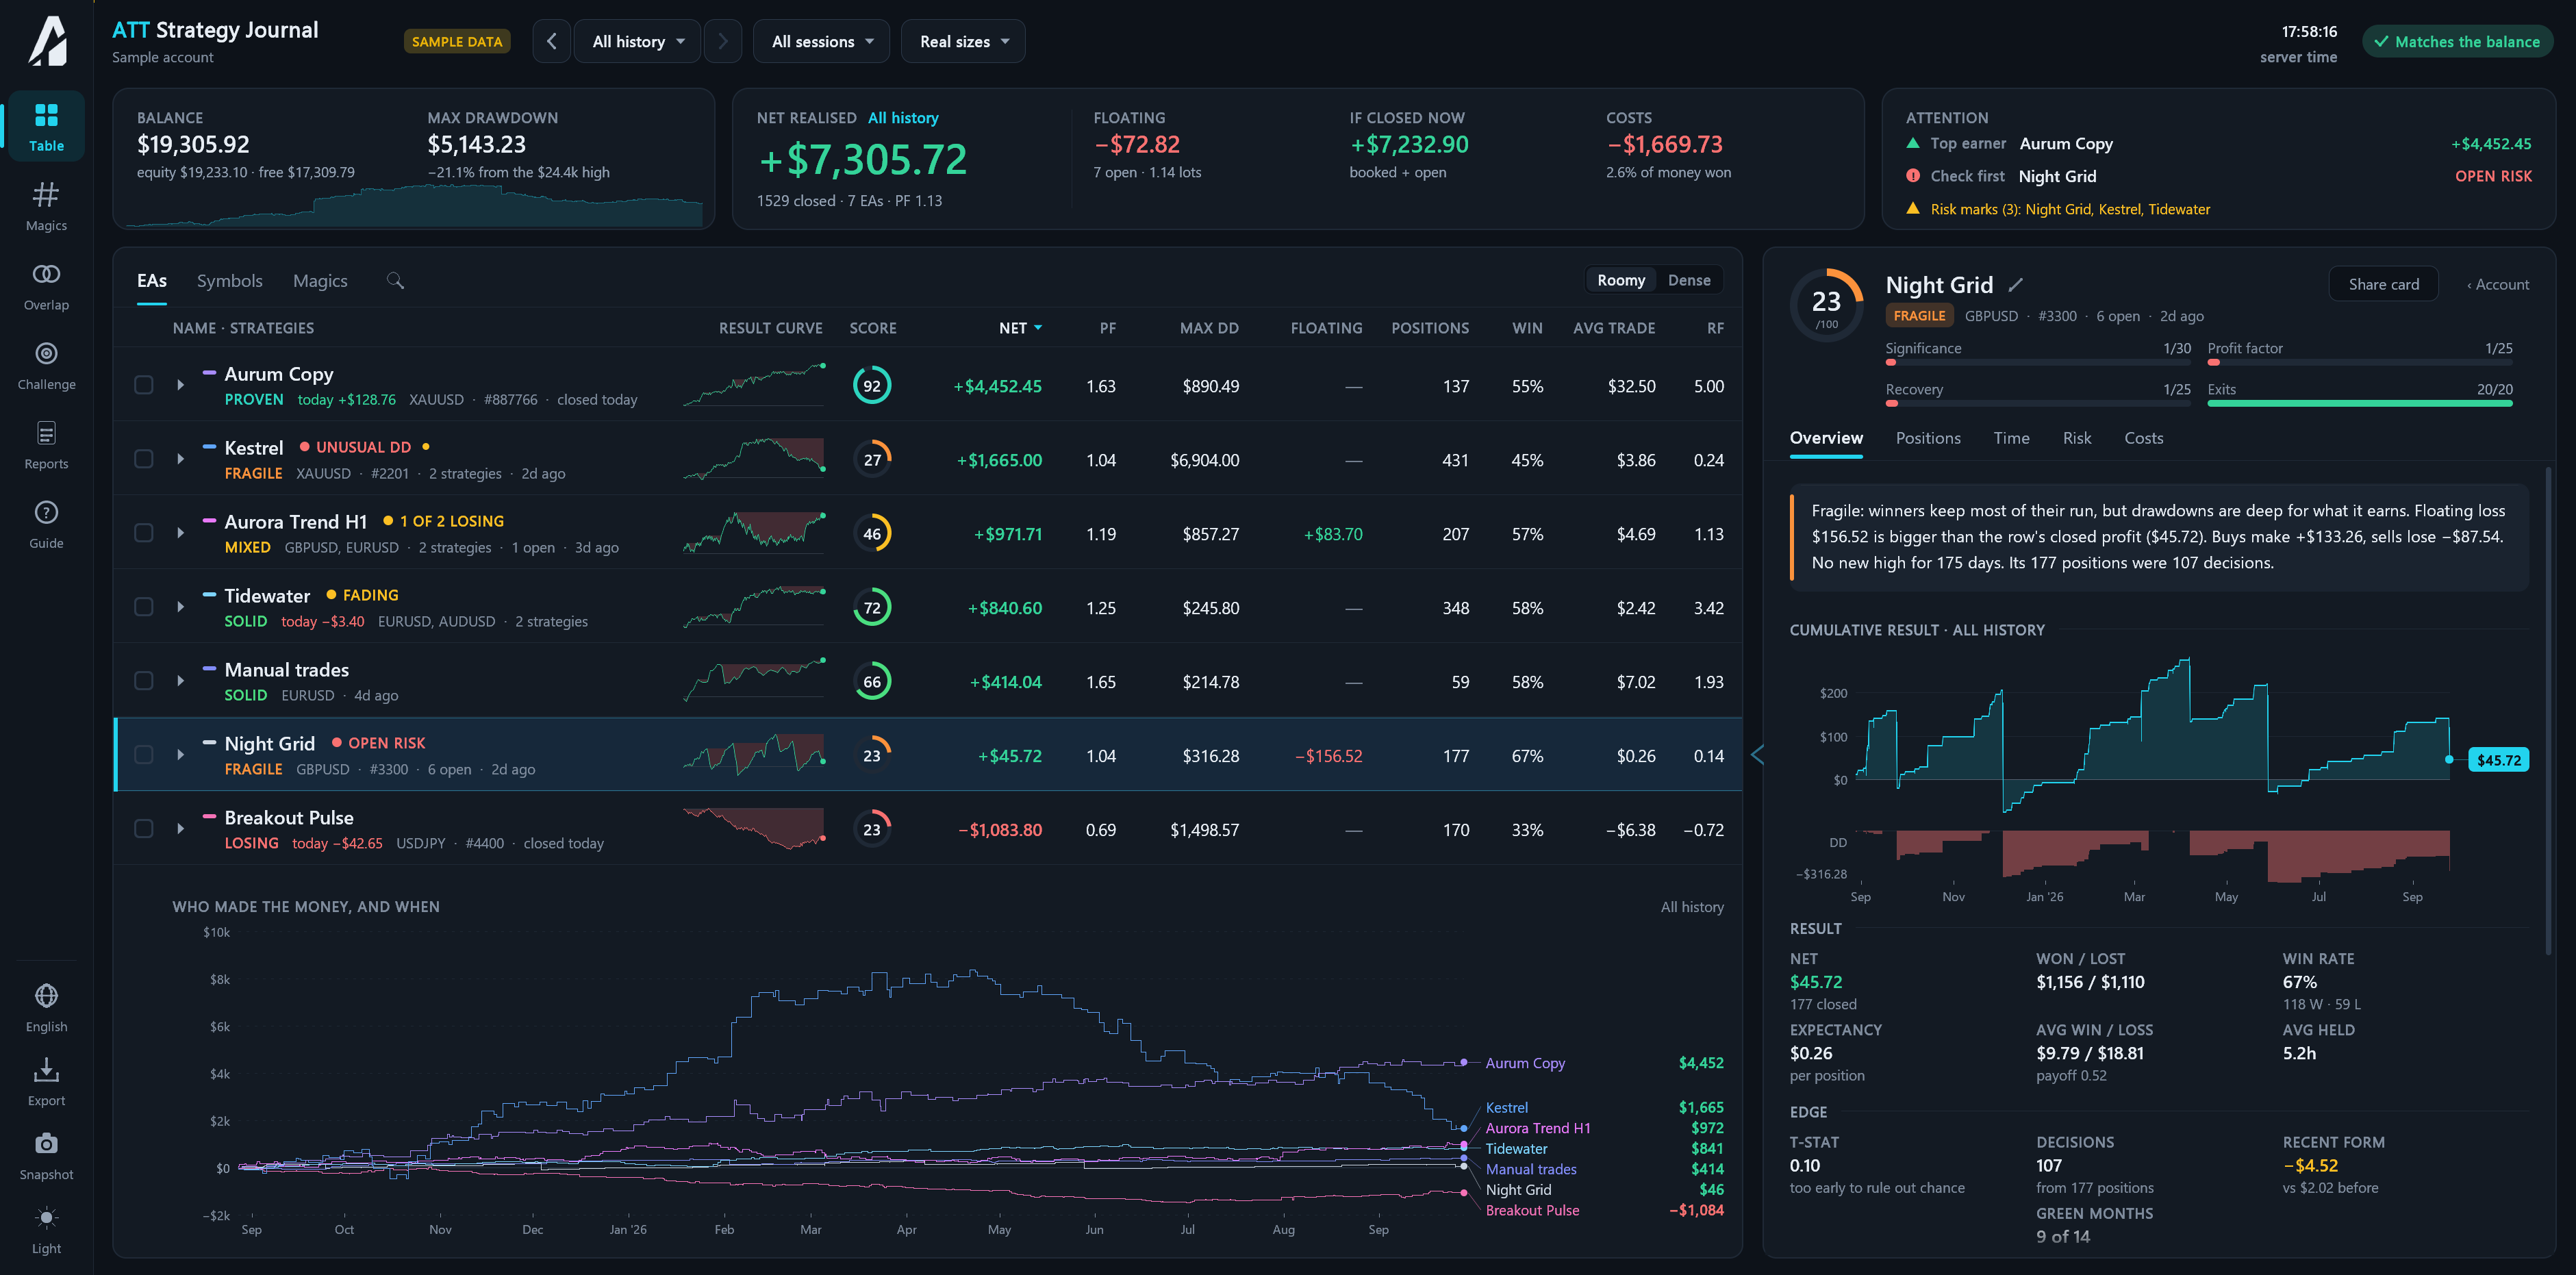
Fig. 1. The panel with one row open: the table of Expert Advisors on the left, the inspector of the selected row on the right.
Installation
The utility is distributed through the MQL5 Market and is installed from the terminal; no files are copied by hand.
- The product is listed on the Market tab of the terminal's Toolbox window, or on its product page at mql5.com. Buying, renting and downloading the demo require a signed-in MQL5.community account: Tools → Options → Community.
- After the purchase the terminal downloads and installs the product itself. It appears in the Navigator under Expert Advisors → Market.
- The utility is dragged from the Navigator onto a separate chart of any symbol and timeframe. Algorithmic trading does not need to be allowed: the panel does not trade.
Updates arrive in the same place, in the list of purchased products on the Market tab. The number of activations is stated on the product page. The free demo from the Market, like every Market demo, runs in the Strategy Tester only. In the visual mode of the tester the panel shows a sample account built on the tester's own bars and marked SAMPLE DATA, so the table, the inspector and the tools can be seen before buying. The figures that come from price bars (worst and best point of positions, the equity drawdown, the Exits part of the score) are not computed in the tester.
Quick start
- In the Toolbox window, on the History tab, the context menu item All History is selected. The panel counts only the history the terminal has loaded.
- The panel is attached to a separate chart and takes the whole chart window. The first reading of the history takes a few seconds; price work continues in the background.
- The badge in the top right corner reads Matches the balance when deposits, withdrawals and every closed result rebuild the account balance exactly. An amount in its place is the difference, most often caused by incomplete history.
- The period list in the top bar sets the time frame, the tabs above the table switch between EAs, Symbols and Magics.
- A click on a row opens it in the inspector on the right: verdict, score parts, result curve and the tabs Overview, Positions, Time, Risk and Costs. Esc returns the inspector to the whole account.
- Hovering any figure, column header, mark or score ring shows what it means and how it was calculated, in the row's own numbers.
Everyday tasks
Which EA earns and which only looks good. The table sorted by SCORE puts the most trustworthy records on top. A click on a row opens its verdict: it names the reason for the grade and the main risk in plain figures. The Attention block shows the top earner and the row to check first.
What the account would look like without an EA. Ticking rows shows the balance, result and drawdown without them, before anything is changed. If the account looks better, Leave out removes them from every total (it asks first and can be undone).
Is the profit real or is risk hidden behind it. The Risk tab compares the drawdown by closed trades with the drawdown by equity. The marks EQUITY DIPS, HOLDS LOSERS and OPEN RISK flag strategies that wait out losses or carry large open trades.
Is an EA getting worse. The Time tab shows the score at the end of every month and the result by month; the mark FADING appears when the latest trades earn clearly less than before.
Do two EAs take the same risk. The Overlap page shows which EAs win and lose on the same days. Twins behave like one larger position; a hedge pair cushions each other.
A prop-firm challenge. With the Challenge page switched on (input Track prop-firm limits), the room left before the daily loss and the maximum drawdown limits is always visible, and alerts arrive at 50% and 80% of each limit and when it is reached.
Broker and execution. The Costs tab shows commission, swap and slippage by symbol and by month, and whether fills got worse lately.
A backtest next to the live account. Strategy Tester reports can be opened on the same board (Reports) and read with the same grades and marks.
Sharing a result. Share card saves a picture of one row without the account number and broker; a click on the account line masks the number before a snapshot of the whole panel.
The screen
The panel is read from the left rail, across the top, then down through the table and the inspector.
Fig. 2. The panel by areas.
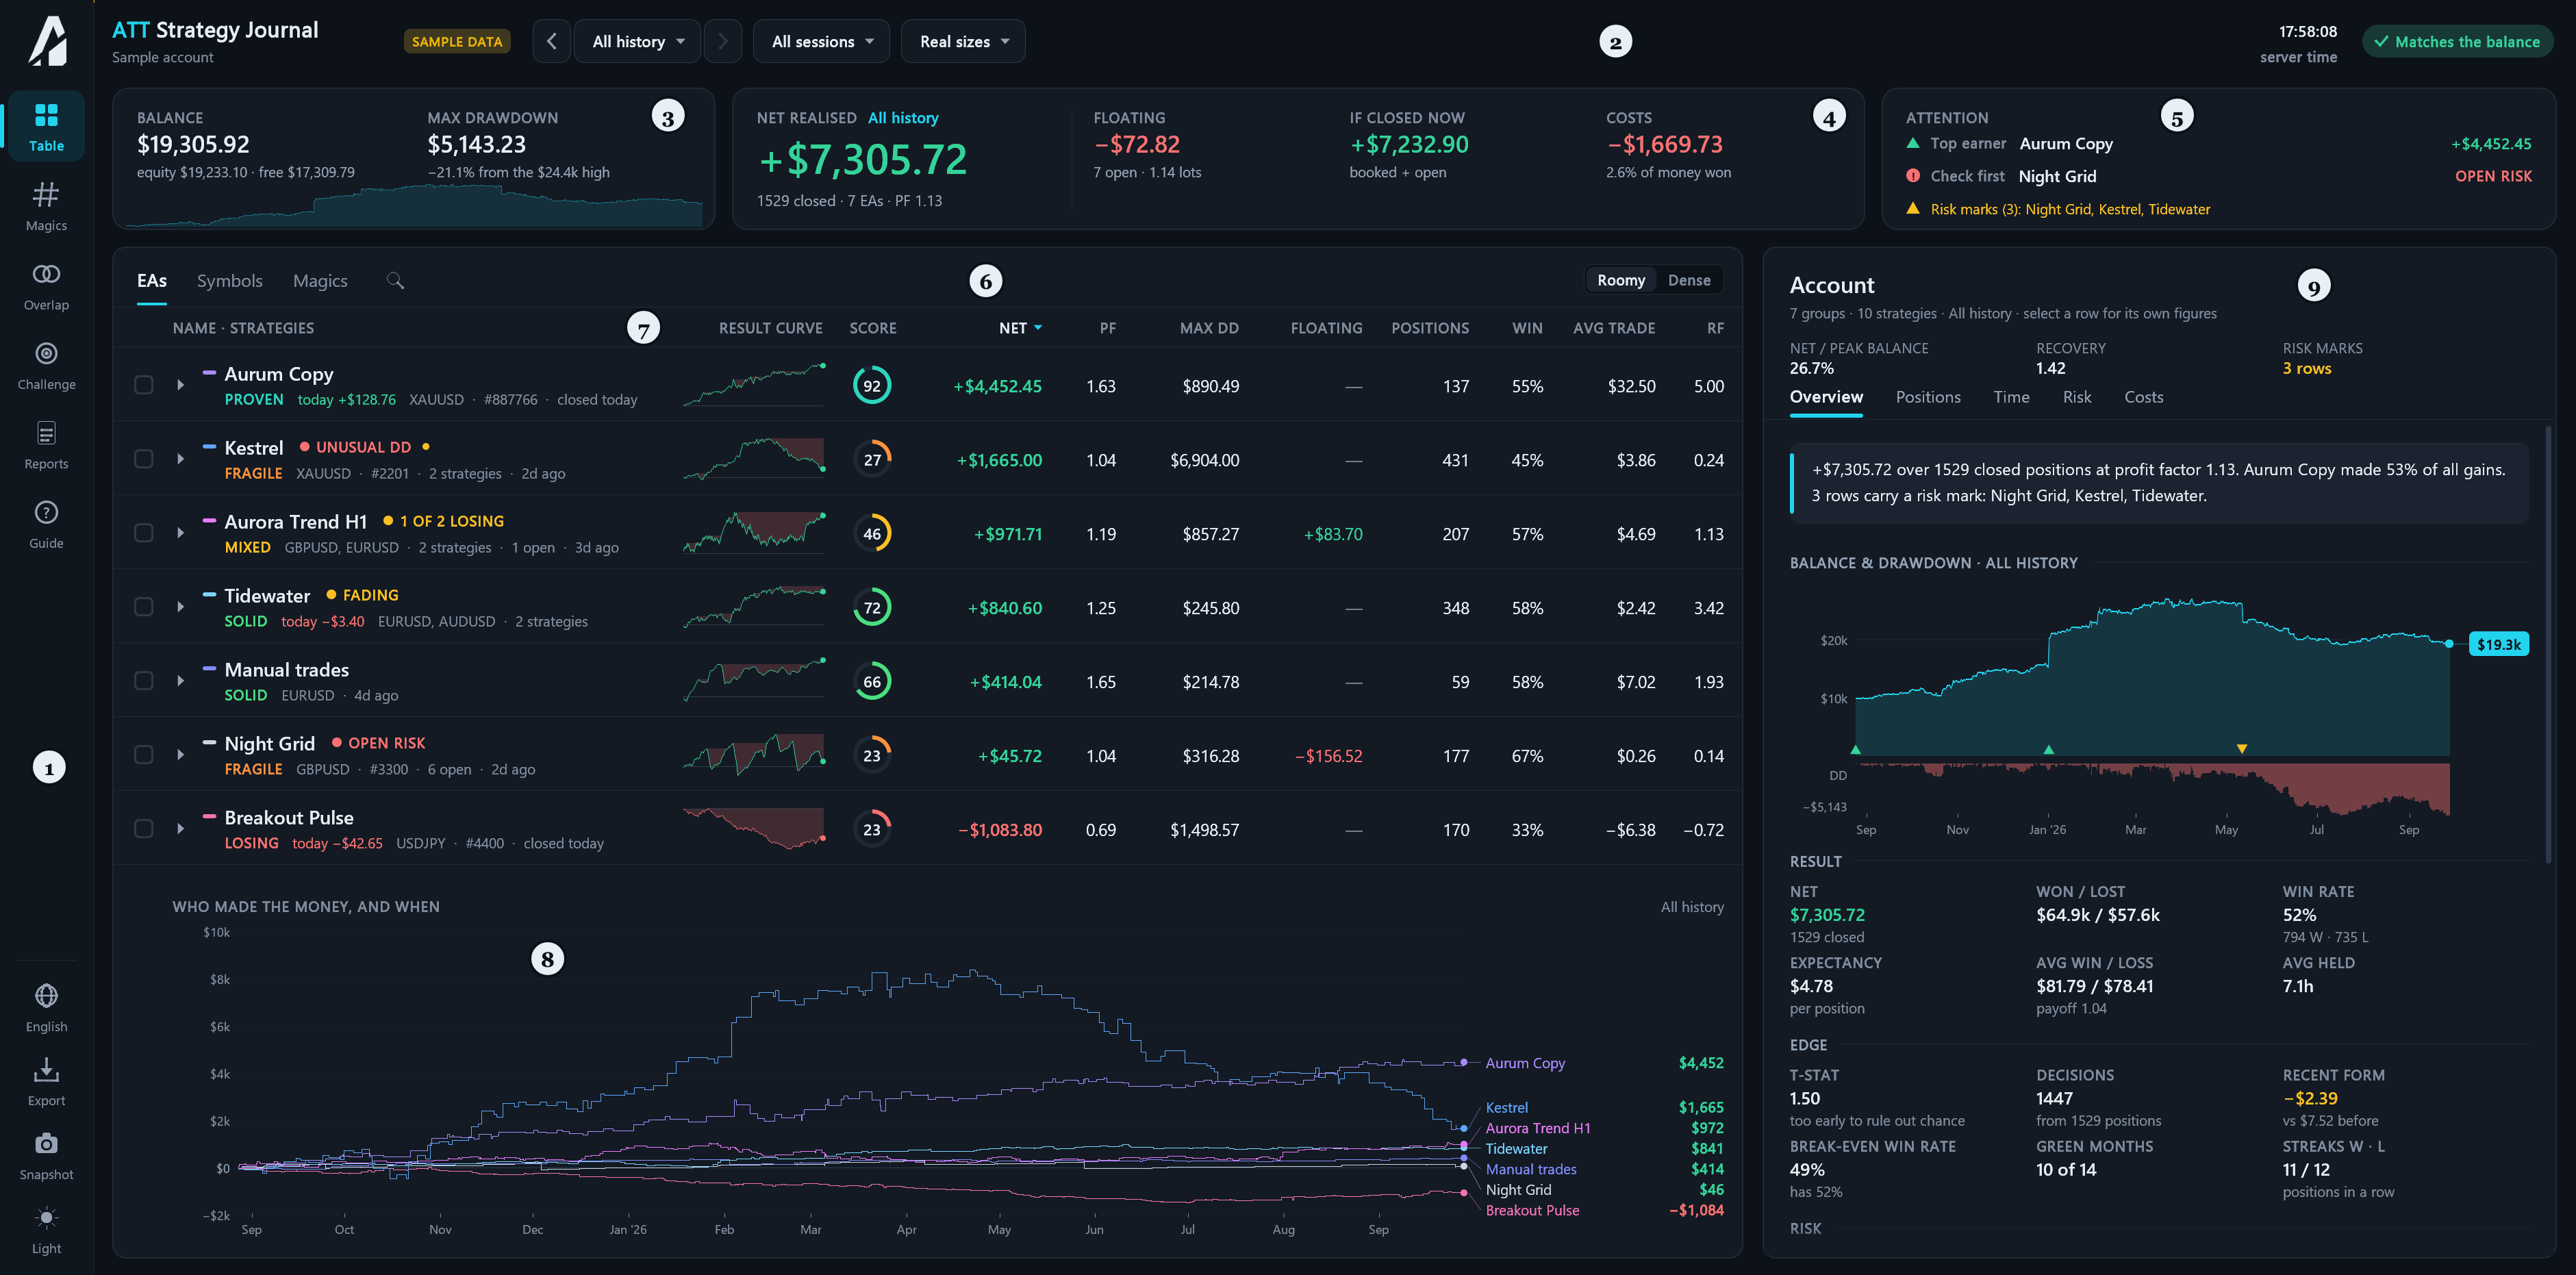
- Rail: Table, Magics, Overlap, Challenge, Reports and Guide; at the bottom the interface language, Export, Snapshot and the theme switch.
- Top bar: product name and account line, the source badge when the figures are not the live account (SAMPLE DATA, BACKTEST, WHAT-IF), the period with its step arrows, the session filter, the lot mode, the server time with the state of prices, and the balance check.
- Account block: balance, equity and free margin as the terminal reports them, the maximum drawdown of the balance in the period and the balance curve.
- Result block: net realised result of the period, floating result, the result if everything were closed now, and costs.
- Attention block: the top earner, the row to check first and the rows that carry a risk mark (OPEN RISK, EQUITY DIPS, UNUSUAL DD, HOLDS LOSERS or FADING). A click on a name opens that row.
- Table toolbar: the views EAs, Symbols and Magics, search, and the Roomy / Dense switch. With rows ticked, the toolbar turns into the actions for them.
- Table: one row per EA (or per symbol, or per magic number), unfolding into strategies.
- Who made the money, and when: the cumulative closed result of every row on one time axis, drawn under the rows when there is room.
- Inspector: the whole account, or the selected row, or a tool page.
The account line under the product name shows the account number and the broker. A click on it masks the number down to its last two digits for screenshots, and a second click shows it again.
The server time carries the state of prices under it. Prices fresh: every symbol held has a quote from the last five minutes, so the floating figures are current. Some prices stale: part of the held symbols has no fresh quote and that part of the floating result stands at the last price. No fresh prices: no held symbol is quoted, as over a weekend. Offline: the terminal has lost its server. With no open position nothing depends on live prices and no state is shown. The server time also defines "today" and the sessions.
Periods, sessions and lot mode
Fig. 3. The period list and the controls of the top bar.
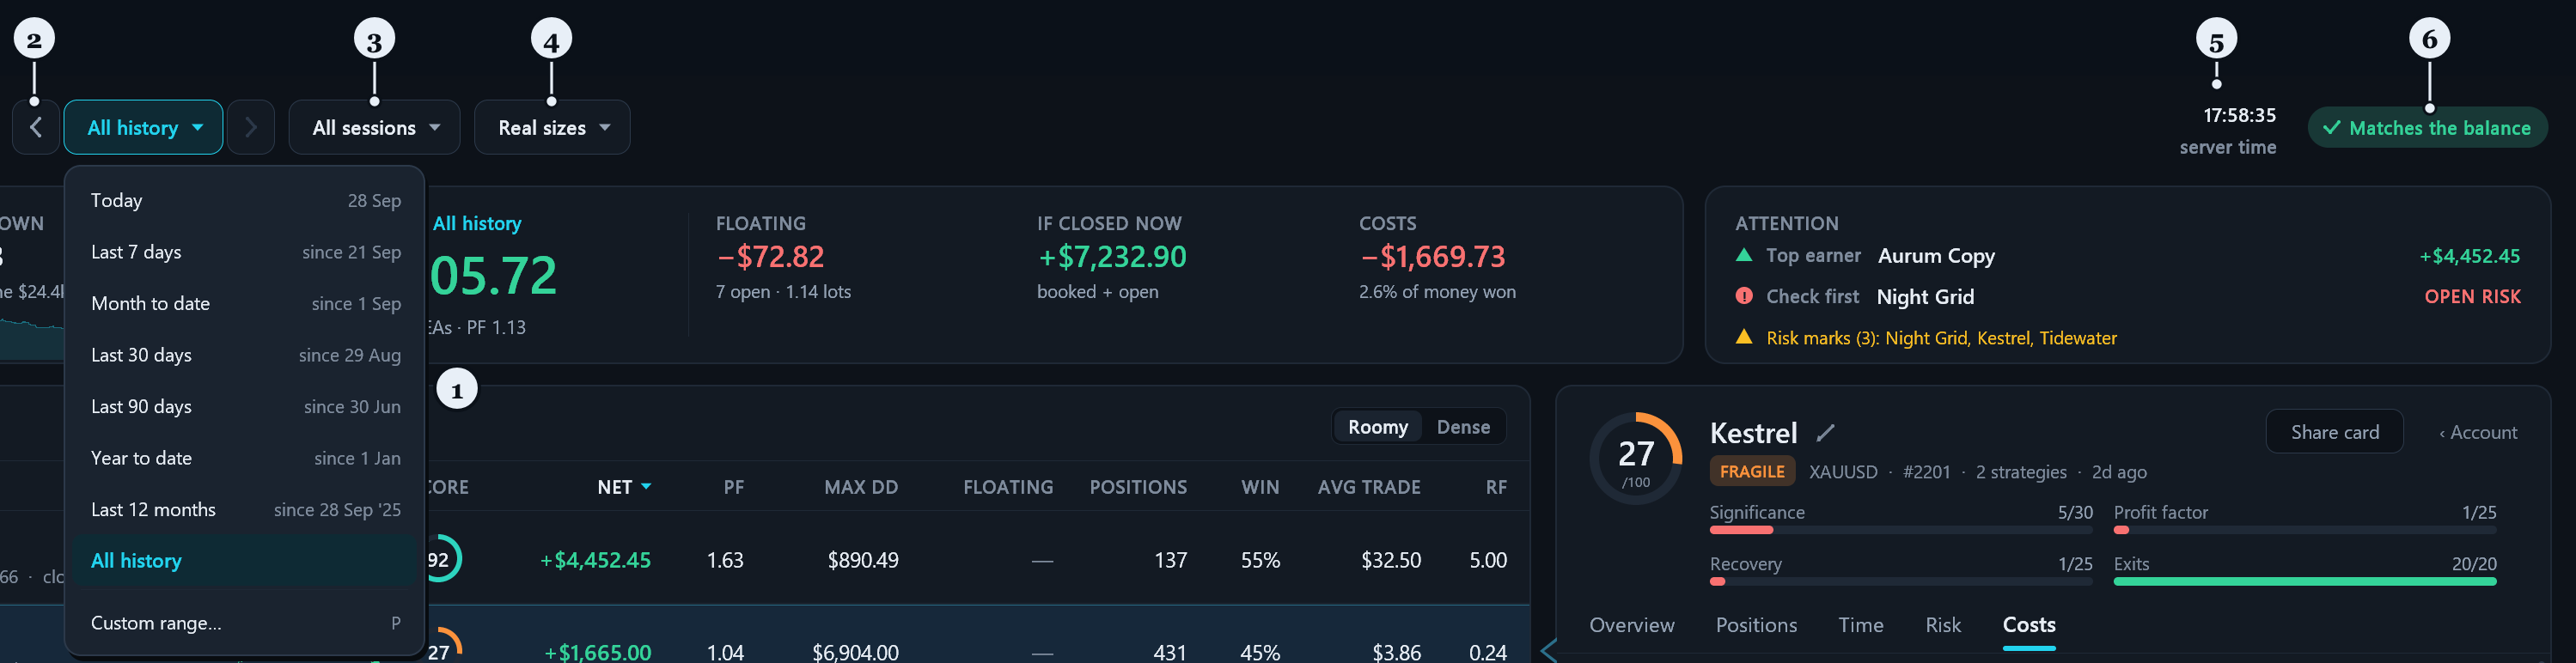
- Period list: Today, Last 7 days, Month to date, Last 30 days, Last 90 days, Year to date, Last 12 months, All history and Custom range. Each line shows the date the period starts from.
- Step arrows: one period shorter or longer. The keys ← and → do the same.
- Session filter: All sessions, Asia, London or New York, by the opening time of each position. S moves to the next session.
- Lot mode: Real sizes or Same size 0.01.
- Server time and the state of prices.
- Balance check.
Custom range opens a small box with two dates in the form 2026.01.01 - 2026.03.31; Enter applies them. P opens the same box from the keyboard.
A position belongs to a period by its closing time. The input Book a position on the day it opened switches this to the opening time.
Same size 0.01 replays every trade at 0.01 lot. A grid ladder or a martingale becomes flat, and it shows whether the edge sits in the entries or only in the position sizing. Every money figure in this mode is a what-if: the top bar shows WHAT-IF · 0.01 LOT, the balance check is paused, exports are disabled and alerts are silent.
How the panel reads the account
Positions, not deals. A position closed in several parts is still one position and counts once. Every result already includes commission, swap and fees.
Netting accounts. Reversals and several EAs trading the same symbol are handled: every EA keeps its own trades and its own money, even though the terminal shows one common position.
EAs and strategies. A strategy is a magic number together with the comment of its trades; the EA name is read from the comment, so copies of one EA on different symbols appear as one EA with several strategies. Trades without a magic number appear as Manual trades. When an EA writes a different comment on every trade (a copied signal, for example), the panel keeps it as one strategy. All of this can be changed: names with the pencil, grouping with Group and Ungroup, merging and splitting of comments on the Magics page, and the inputs of the Strategies group.
Grids and baskets. Trades opened together, or closed together as one basket, are judged as one decision, so a grid is not graded like a long run of separate wins. The money still counts every position. The input Entries this many seconds apart are one decision sets how close in time trades must be.
Balance check. Deposits, withdrawals, bonuses and the results of all positions are added up and compared with the account balance. Money paid in or out is never counted as a drawdown. When the check shows an amount instead of Matches the balance, the terminal's history is usually incomplete (see If something looks wrong).
The table
Fig. 4. Rows of the table, one EA unfolded into its strategies.
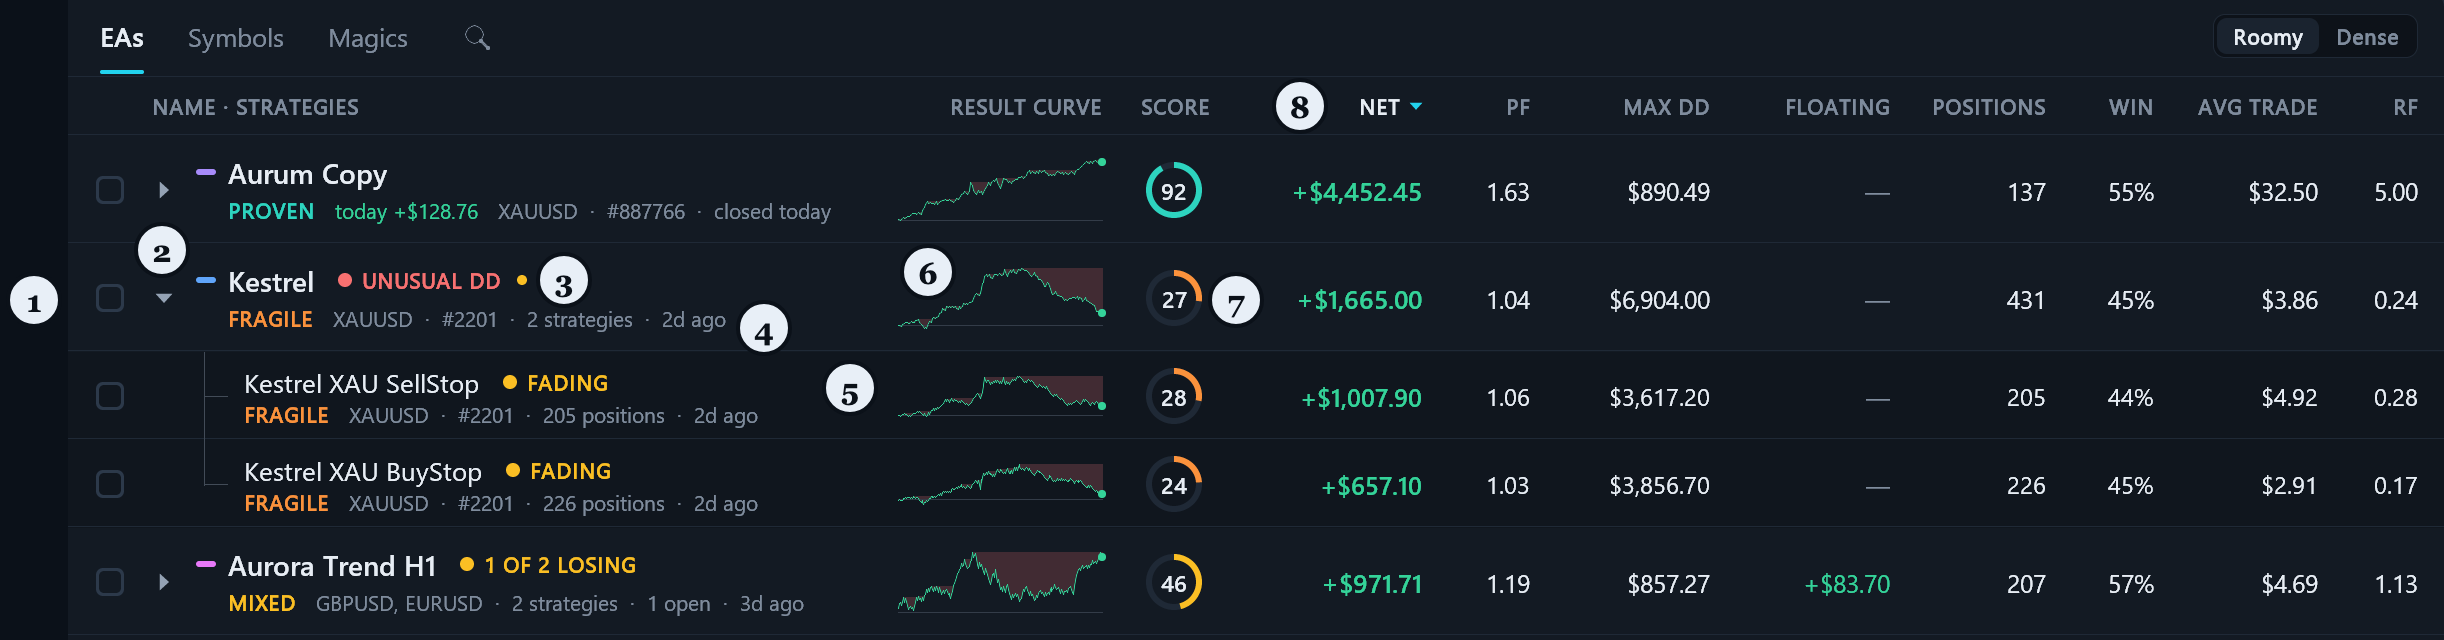
- Tick box: ticked rows are previewed out of the account (see below).
- Arrow: unfolds the EA into its strategies.
- Name and the main mark of the row; small dots after the mark stand for its other marks.
- Second line: the grade word, today's result, symbols, magic number, the number of strategies and open positions, and the time since the last close.
- Strategy rows inside the EA.
- Result curve: the cumulative closed result, with the drawdown shaded under its running high.
- Score ring: the score out of 100 in the colour of the grade.
- Column headers: a click sorts by the column, a second click reverses the order.
| Column | Meaning |
|---|---|
| SCORE | the score ring; sorted by score |
| NET | closed result after commission, swap and fees; under it, what the row added or lost today |
| PF | profit factor: money won divided by money lost |
| MAX DD | deepest fall of the row's closed result from its own high |
| FLOATING | floating result of what the row holds now, swap included |
| POSITIONS | positions closed in the period; a partly closed position counts once |
| WIN | share of closed positions that made money; break-even counts as neither |
| AVG TRADE | average result of one closed position |
| RF | recovery factor: net result divided by the maximum drawdown |
Roomy shows two-line rows with the grade and the facts; Dense shows one line per row and fits more rows on screen (key K). The magnifier, or the key /, finds a row by name; Esc clears the search. The mouse wheel scrolls the table; PgUp, PgDn and Home page through it.
Ticked rows. Ticking rows previews the account without them: the Account and Result blocks add "excl. ticked" figures, drawdown included, and nothing is changed until an action is chosen. The toolbar then offers Leave out (Delete), Group (M), Ungroup (N) and Clear (Esc).
Fig. 5. Two rows ticked: the toolbar actions and the account figures without them.

- The number of ticked rows and the actions for them.
- The figures of the account without the ticked rows.
Leave out takes the rows out of every total after a confirmation. A row left out is dimmed and ends with a Bring back chip; the "left out" button in the toolbar (key O) shows or hides such rows, and I brings every row back. Leaving out is stored for each view separately. Group puts the strategies of the ticked rows under one EA, and the pencil next to the EA's name in the inspector renames it; Ungroup returns them to the automatic grouping.
Score and grades
The score from 0 to 100 answers one question: how much trust the row's record deserves. It looks at four things, shown as bars in the inspector with their points:
- Significance: whether the result stands out from chance, given how many decisions it rests on.
- Profit factor: how much is won for every unit lost.
- Recovery: how much the row earns against its deepest drawdown, open losses included.
- Exits: how much of the best move the winning trades keep, from price history.
Large open losses and the danger marks hold the score down, because closed statistics alone cannot see them. The score ranks rows against each other; it is not a forecast. Hovering the ring or a part shows the row's own figures behind it, and the Guide page lists the parts.
| Grade | Meaning |
|---|---|
| PROVEN | score 80 to 100: a long, significant and steady record |
| SOLID | score 65 to 79 |
| PROMISING | score 50 to 64 |
| MIXED | score 35 to 49 |
| FRAGILE | score 0 to 34: a weak record, or large risks behind it |
| LOSING | lost money in the period; such rows are ranked by their profit factor |
| TOO EARLY | fewer decisions than the input Decisions a row needs before it gets a grade (25 by default) |
Marks
Marks point at what the closed trades alone do not show. Red means danger, amber a warning, grey information. A row shows its most important mark as a coloured word and a small dot for every other one; the inspector explains each mark in the row's own figures.
| Mark | Colour | What it means | Where to look |
|---|---|---|---|
| OPEN RISK | amber, red | the floating loss is large against what the row has earned; red when it is bigger than all of it | Risk tab, open positions |
| EQUITY DIPS | red | open positions pulled equity far below what the closed trades show | Risk tab, drawdown four ways |
| UNUSUAL DD | red | the current drawdown is deeper than the row's own history makes normal | Risk tab, Time tab |
| HOLDS LOSERS | amber | many winners were deep in loss before they closed: losing trades are held until they turn | Risk tab, the chart of worst points |
| IN THE RED | red | lost money while still too new to be graded | Overview |
| FADING | amber | the latest decisions earn clearly less than the earlier ones | Time tab, score at month end |
| n OF m LOSING | amber | the EA is in profit as a group, but n of its m strategies lose money | the EA's strategy rows |
| QUIET nD | grey | nothing open and no close for n days (input A row turns QUIET after this many days without a close) | Positions tab |
The Attention block lists the rows with the marks OPEN RISK, EQUITY DIPS, UNUSUAL DD, HOLDS LOSERS and FADING; the other marks stay on the rows. Check first points to the row that needs a look most.
The inspector
With no row selected, the inspector shows the whole account: a written summary, the balance and its drawdown over all history with markers for money paid in and out, and groups of figures for the result, the edge, the risk, costs and exposure, and sides and exits. The same tabs as for a row sit above it.
Fig. 6. The inspector of a row.
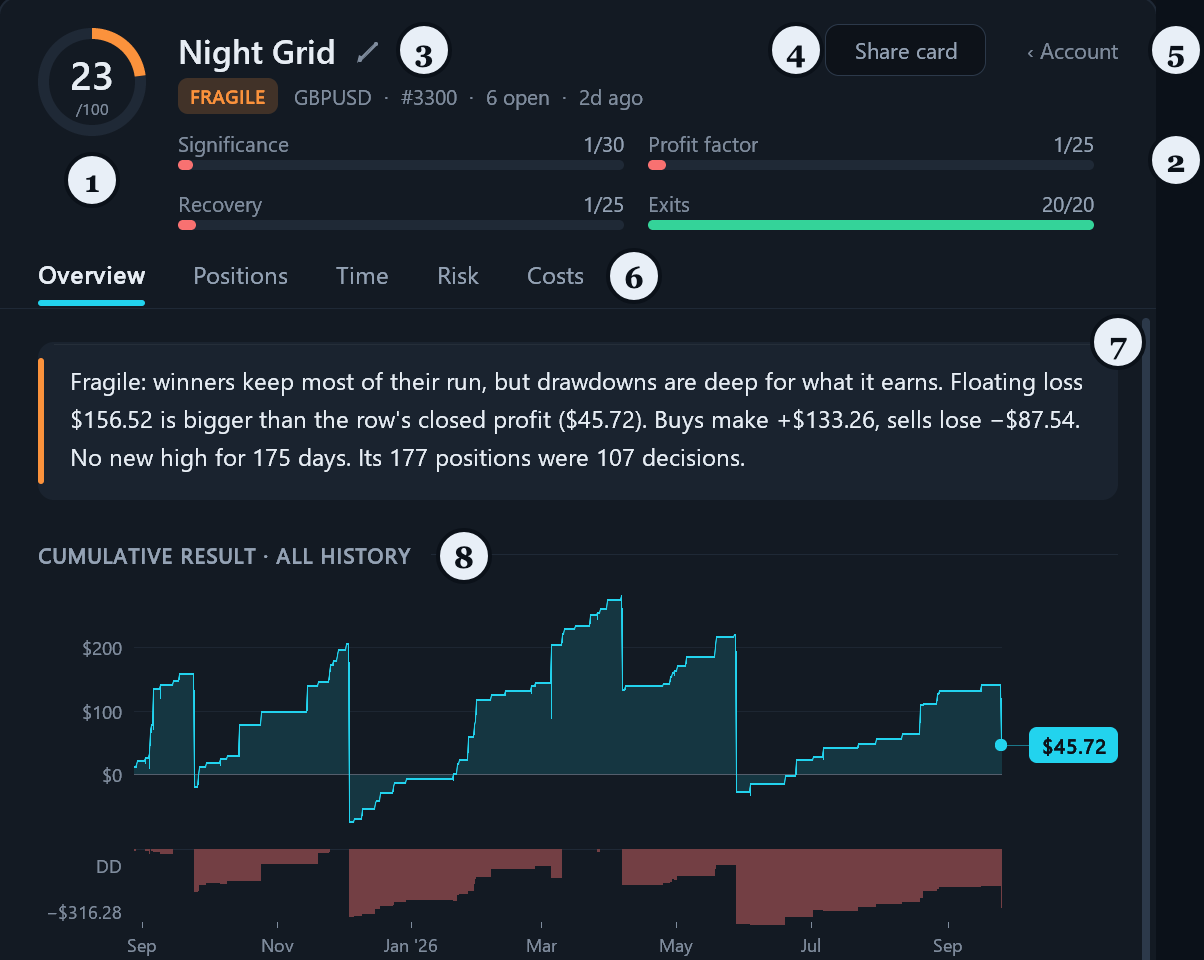
- Score ring.
- The four parts of the score in points. Hovering a part explains it.
- Pencil: renames the strategy or the EA; the name is kept for this account.
- Share card: saves a picture of the row (see Export).
- Account: back to the whole account (Esc).
- Tabs: Overview, Positions, Time, Risk, Costs.
- Verdict: two to four sentences with the row's own figures. It names the grade and the reason, the most serious mark, and up to two findings, such as costs that turn the entries into a loss, an edge that lives on one side or in one session, losers held much longer than winners, or stop-outs.
- Cumulative result with the drawdown band under it.
Overview. The verdict, the result curve and the figures in groups. Result: net, won and lost, win rate, expectancy, average win and loss with the payoff, average holding time. Edge: whether the result stands out from chance (T-STAT with its reading in words), decisions against positions, recent form against the earlier average, the win rate needed to break even, green months, streaks of wins and losses. Risk: maximum drawdown, equity drawdown with open losses included, a stress estimate from reshuffling the same trades (MONTE CARLO 95%), current drawdown, the longest time under water, average worst and best point. Sides and exits: long against short, holding time of winners against losers, and how positions ended (stop-loss, take-profit, closed by the EA, closed by hand, stop-outs) with what each group made.
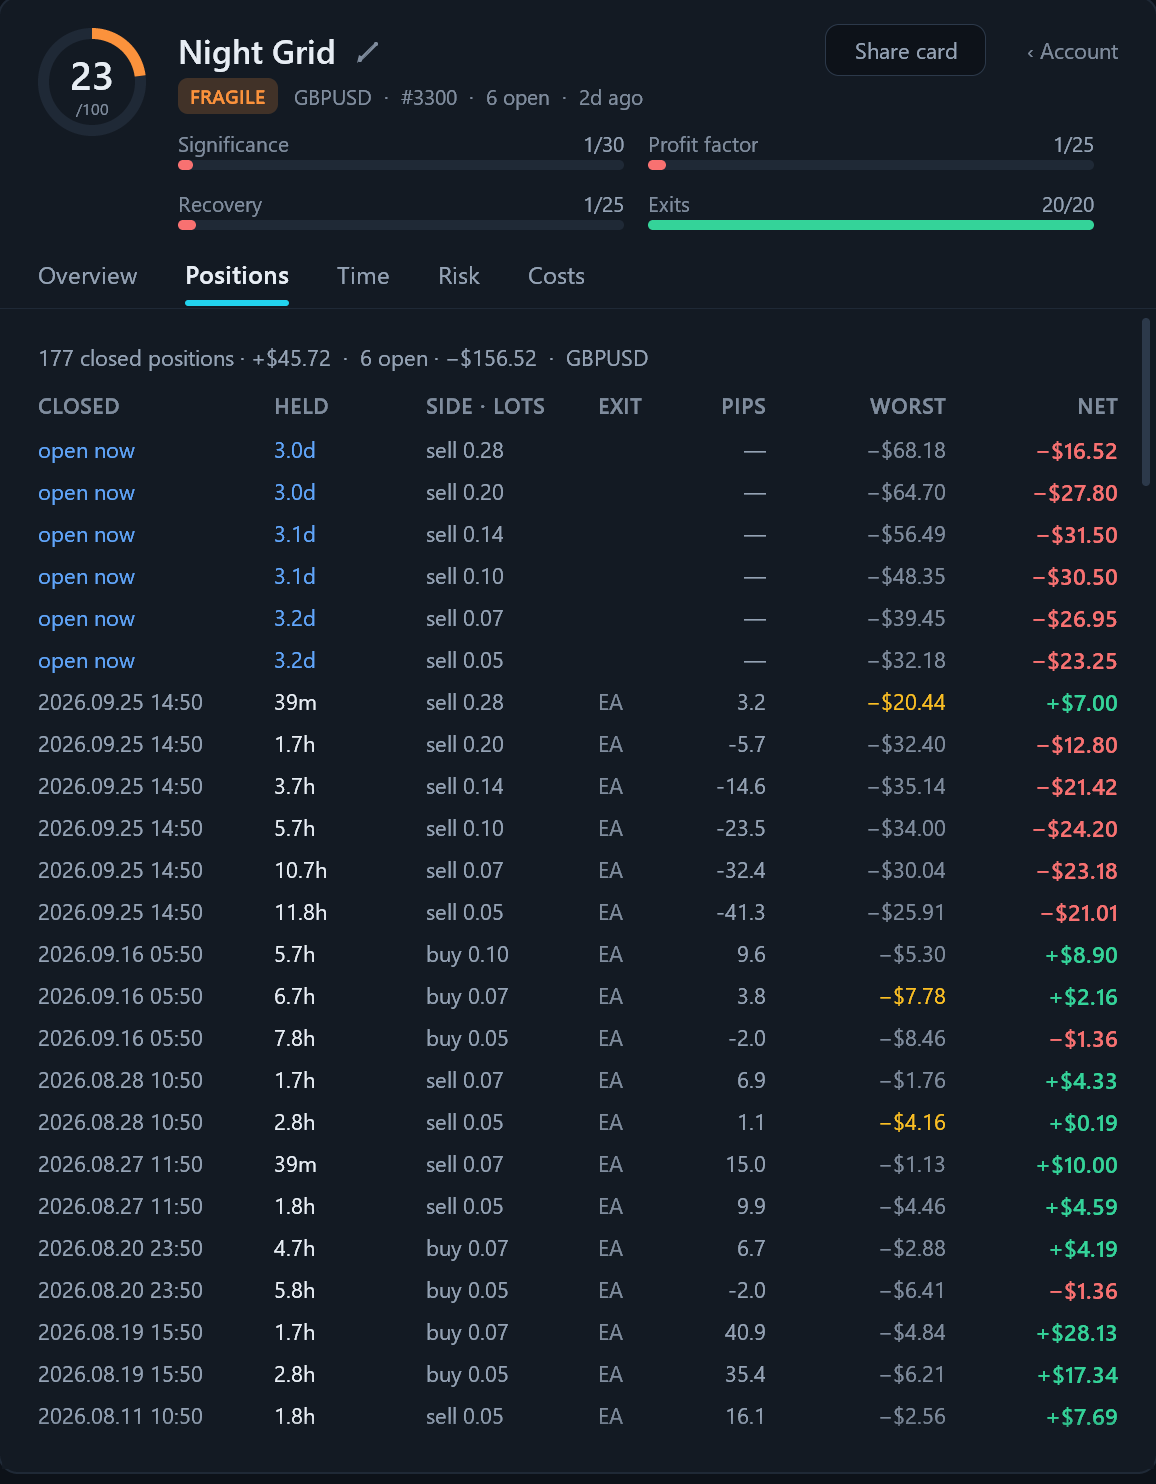
Positions. The row's positions from new to old: close time, holding time, side and lots, exit reason (SL, TP, EA, hand, SO for stop-out), pips, the worst point while open and the net result. Open positions come first. A worst point shown in amber belongs to a win that first fell more than twice what it finally made. The full list goes to the position log export.
Fig. 7. Positions tab.
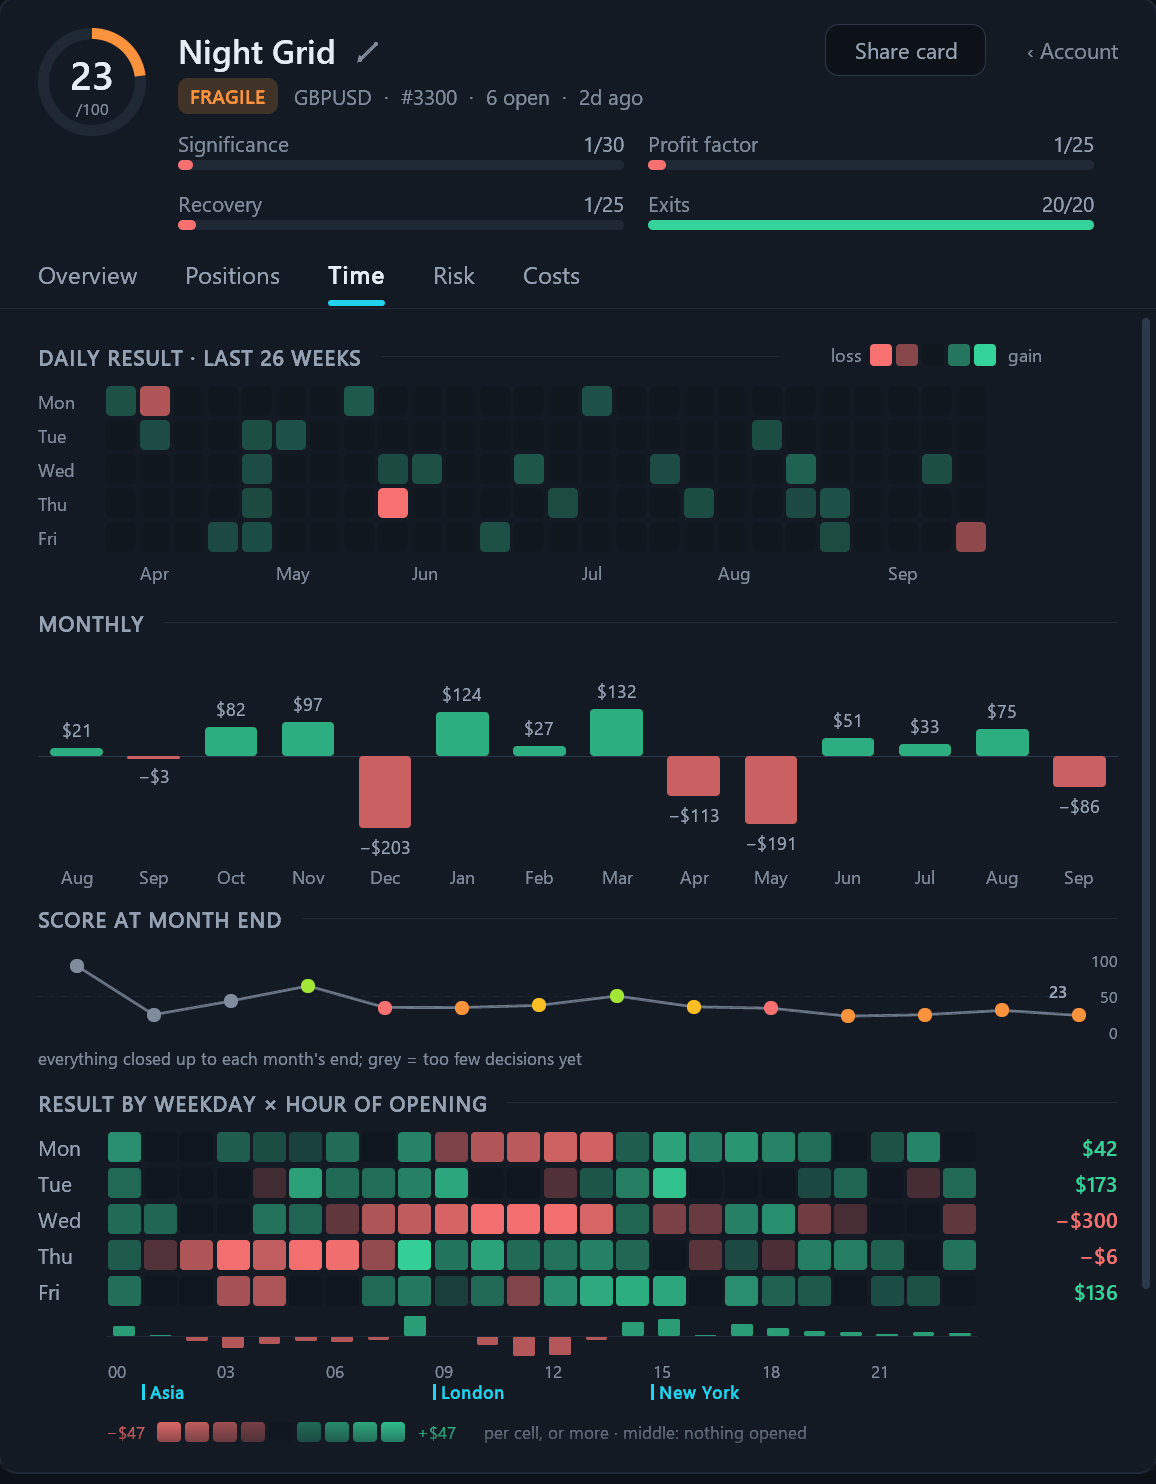
Time. The daily result of the last weeks as a calendar, the monthly result, the score at the end of each month (grey while there were too few decisions), which shows whether the row is getting better or worse, the result by weekday and hour of opening with the session starts marked, and the sessions.
Fig. 8. Time tab.
Risk. The drawdown measured four ways: by equity with open losses, by closed trades, a stress estimate from reshuffling the same trades in a different order, and the current distance below the high. When the equity bar is much longer than the closed-trades bar, the strategy carries more risk than its history of closes suggests. Under them the price coverage, the excursions (average worst and best point, exit efficiency, drawdown against the row's own peak profit, days under water, the worst losing run) and the chart of how deep each position went against how it ended. Dots on the dashed line closed at their worst point; amber diamonds are wins that first sat deep in loss. Many amber diamonds mean the result depends on waiting out losses. Open positions of the row close the tab.
Fig. 9. Risk tab.
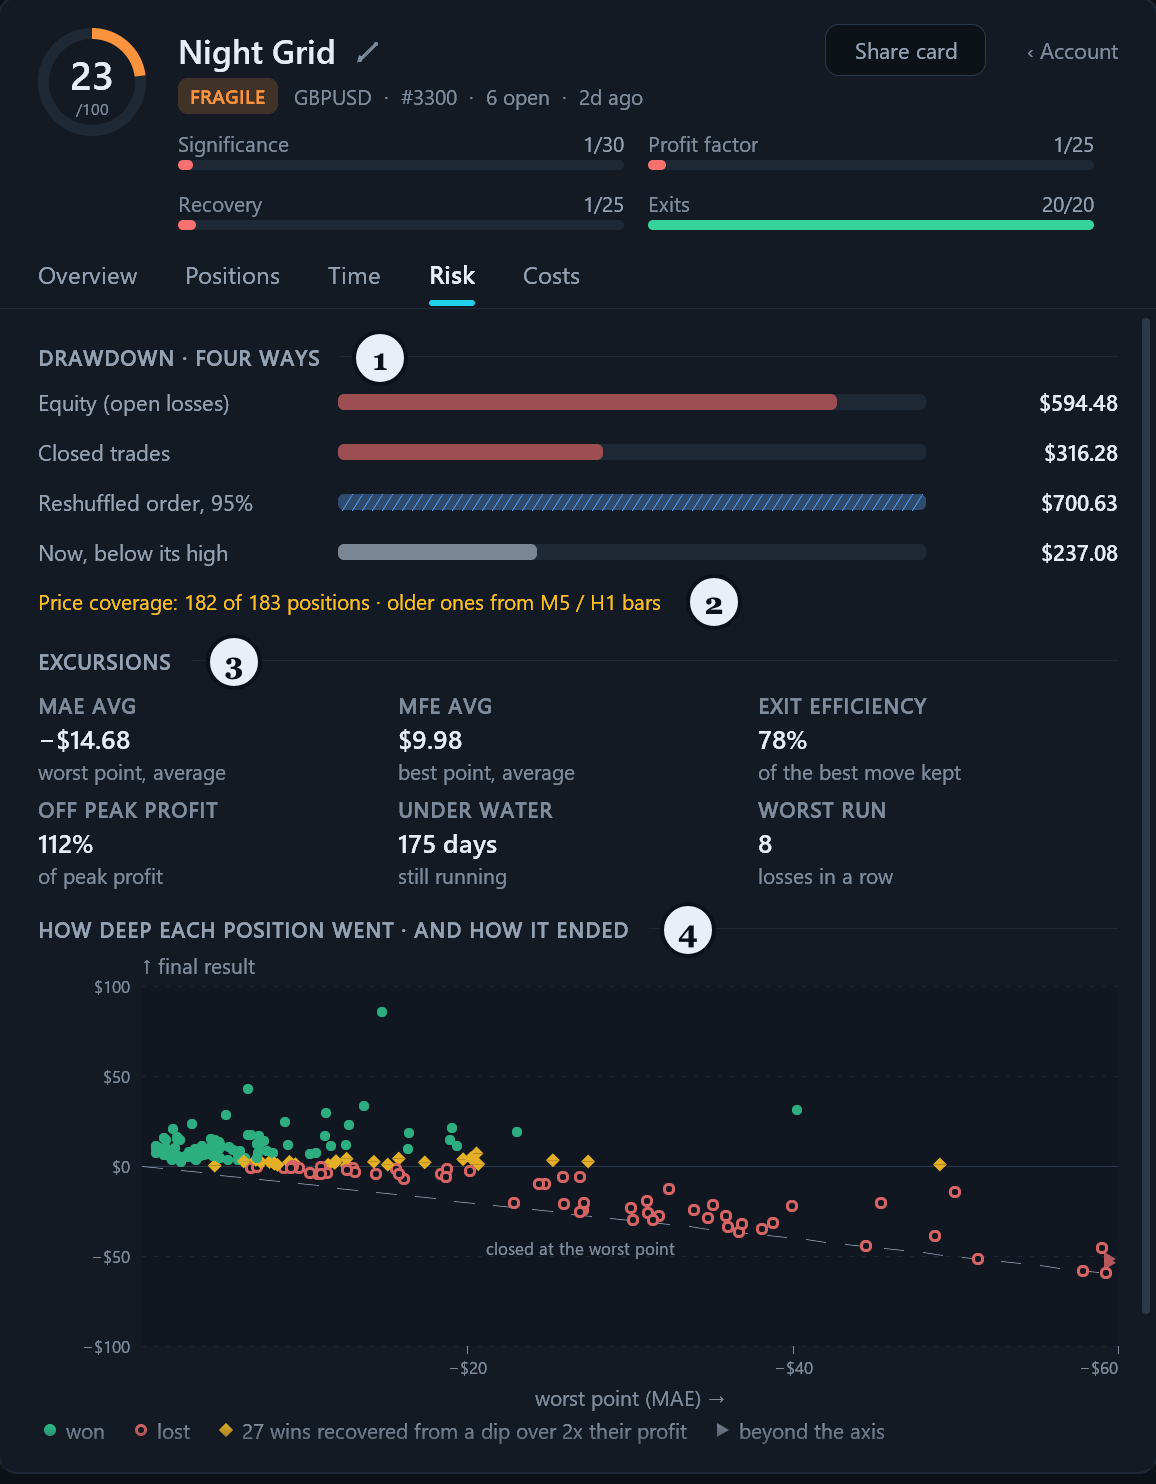
- Drawdown four ways.
- Price coverage: how many positions have price data and from which bars.
- Excursions.
- Worst point against the final result, one dot per closed position.
Costs. The path from gross profit to net through commission, swap and fees, the costs against the money won (the sum of the winning positions), slippage of exits and of pending entries with the number of fills that could be measured, the worst fill, fills by symbol (worse, exact or better than the level, commission per lot, swap per lot and day, fill time), slippage per measured fill by month with a note whether it is getting worse, and costs by month.
Fig. 10. Costs tab.
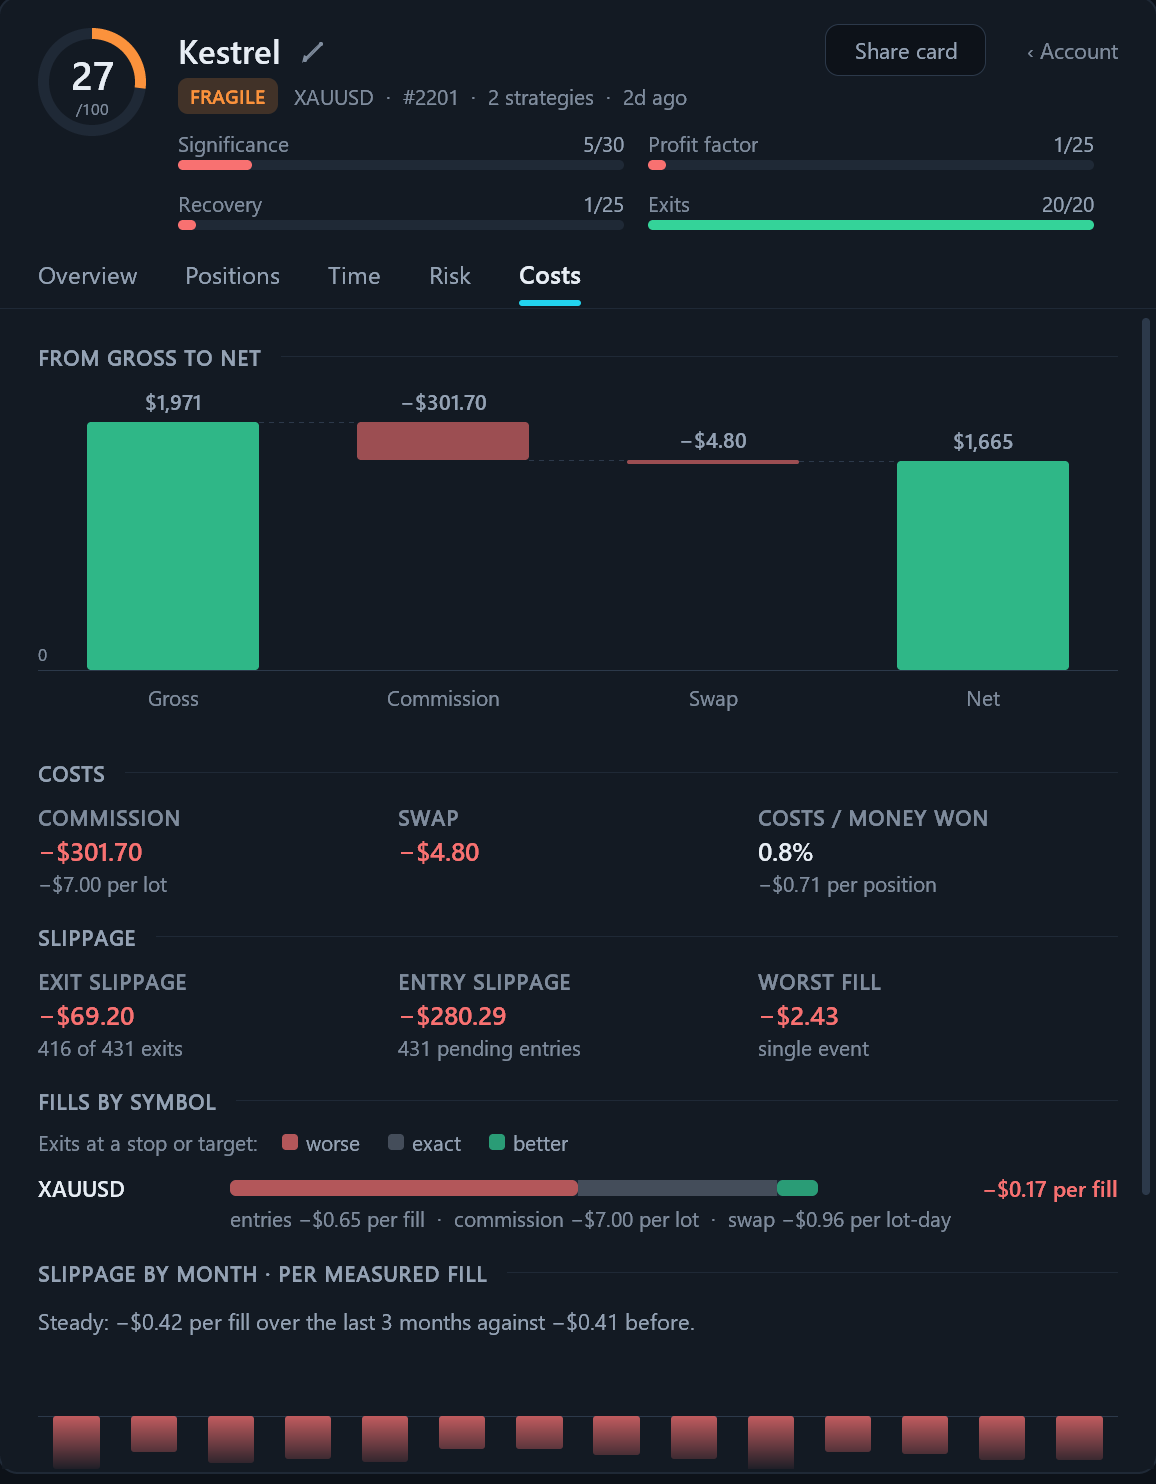
Exit slippage is measured against the stop-loss and take-profit levels the server held; entry slippage only on pending orders, because a market order names no price to compare the fill with.
Prices: worst point, best point and equity drawdown
For every position the panel finds, from the terminal's price history, how deep it went against the trade and how far it went in favour before it closed. From these points it rebuilds the equity drawdown over the whole history, not only for the time the panel has been running. This is where a strategy that sits through losses and closes them near zero shows its real depth: its closed trades look clean, its equity does not.
On the first start the panel reads prices in the background, and the figures fill in as it goes; the results are kept, so later starts are quick. How many positions already have price data is stated on the Risk tab. For very old positions the broker may have no detailed price history; such positions are counted with coarser bars or left out of these figures, and the coverage line says so.
Tools
Magics
Fig. 11. The Magics page with one magic number open.
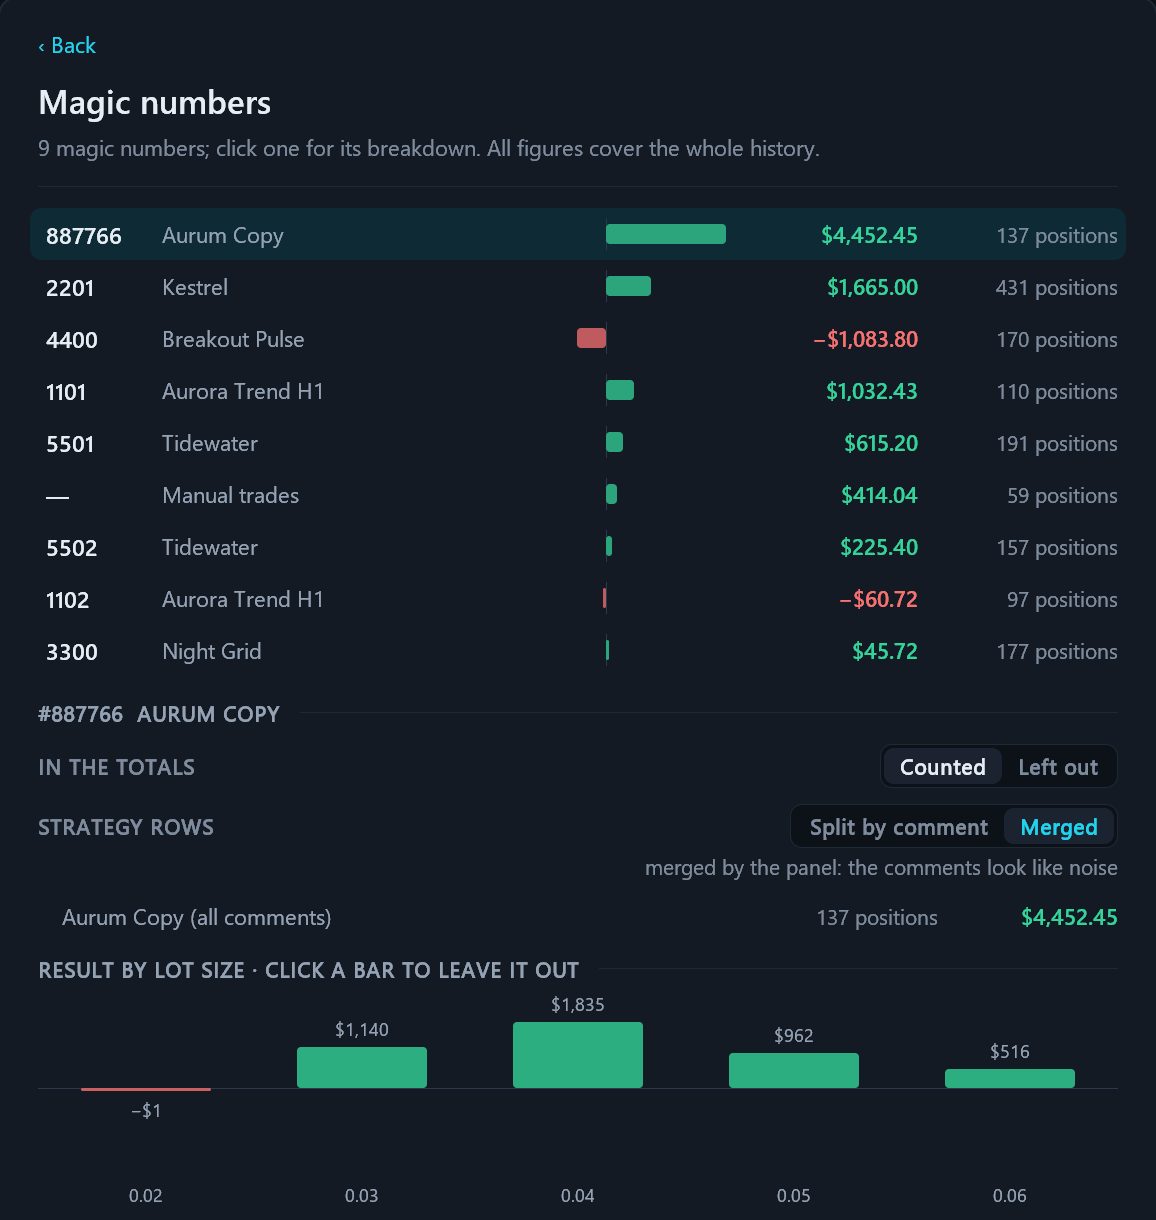
The page lists every magic number of the account with its EA, net result and number of positions over the whole history. A click on a magic opens its breakdown:
- In the totals: Counted or Left out. A magic left out drops out of every total, and the line on top of the page shows what was left out and offers Bring back.
- Strategy rows: Split by comment or Merged. Merged puts every comment of the magic into one strategy; the note "merged by the panel" appears when the panel did it on its own because the comments looked like noise.
- The strategies inside the magic with their positions and result.
- Result by lot size: one bar per lot size. A click on a bar leaves that lot size out, so it is visible where a grid or a martingale keeps its losses. More than 16 lot sizes are treated as sizing by risk, and the bars are not shown.
Overlap
Fig. 12. The Overlap page.
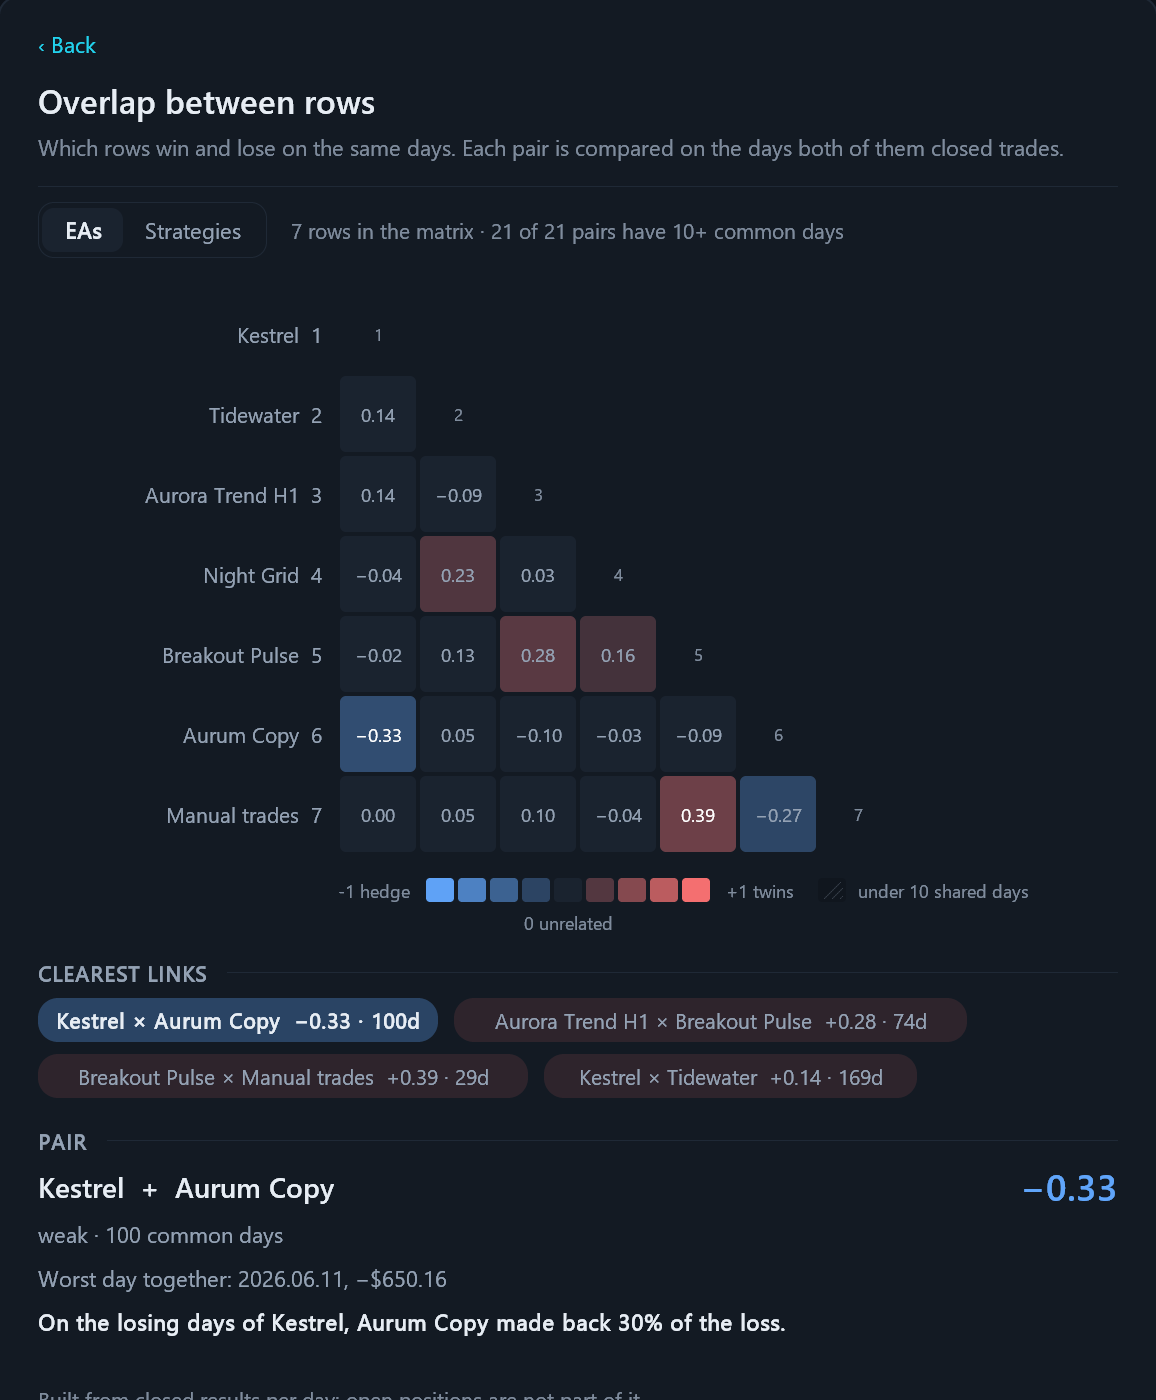
A correlation matrix of EAs or strategies by daily closed results. A pair is compared only on the days both rows closed trades, and only when it has enough shared days (10 by default, the input Shared trading days a pair needs); a hatched cell has too few. Up to 20 of the most active rows are compared. The colour runs from hedge (−1) through unrelated (0) to twins (+1). Under the matrix the clearest links are listed, ranked by how certain each link is: strength and shared days together, so a strong link on a few days comes after a weaker one on many; a click on a link or a cell shows the pair: strength in words (from very weak to very strong), shared days, the worst day together and one sentence on what the pair means for sizing. Open positions are not part of the matrix.
Challenge
Fig. 13. The Challenge page.
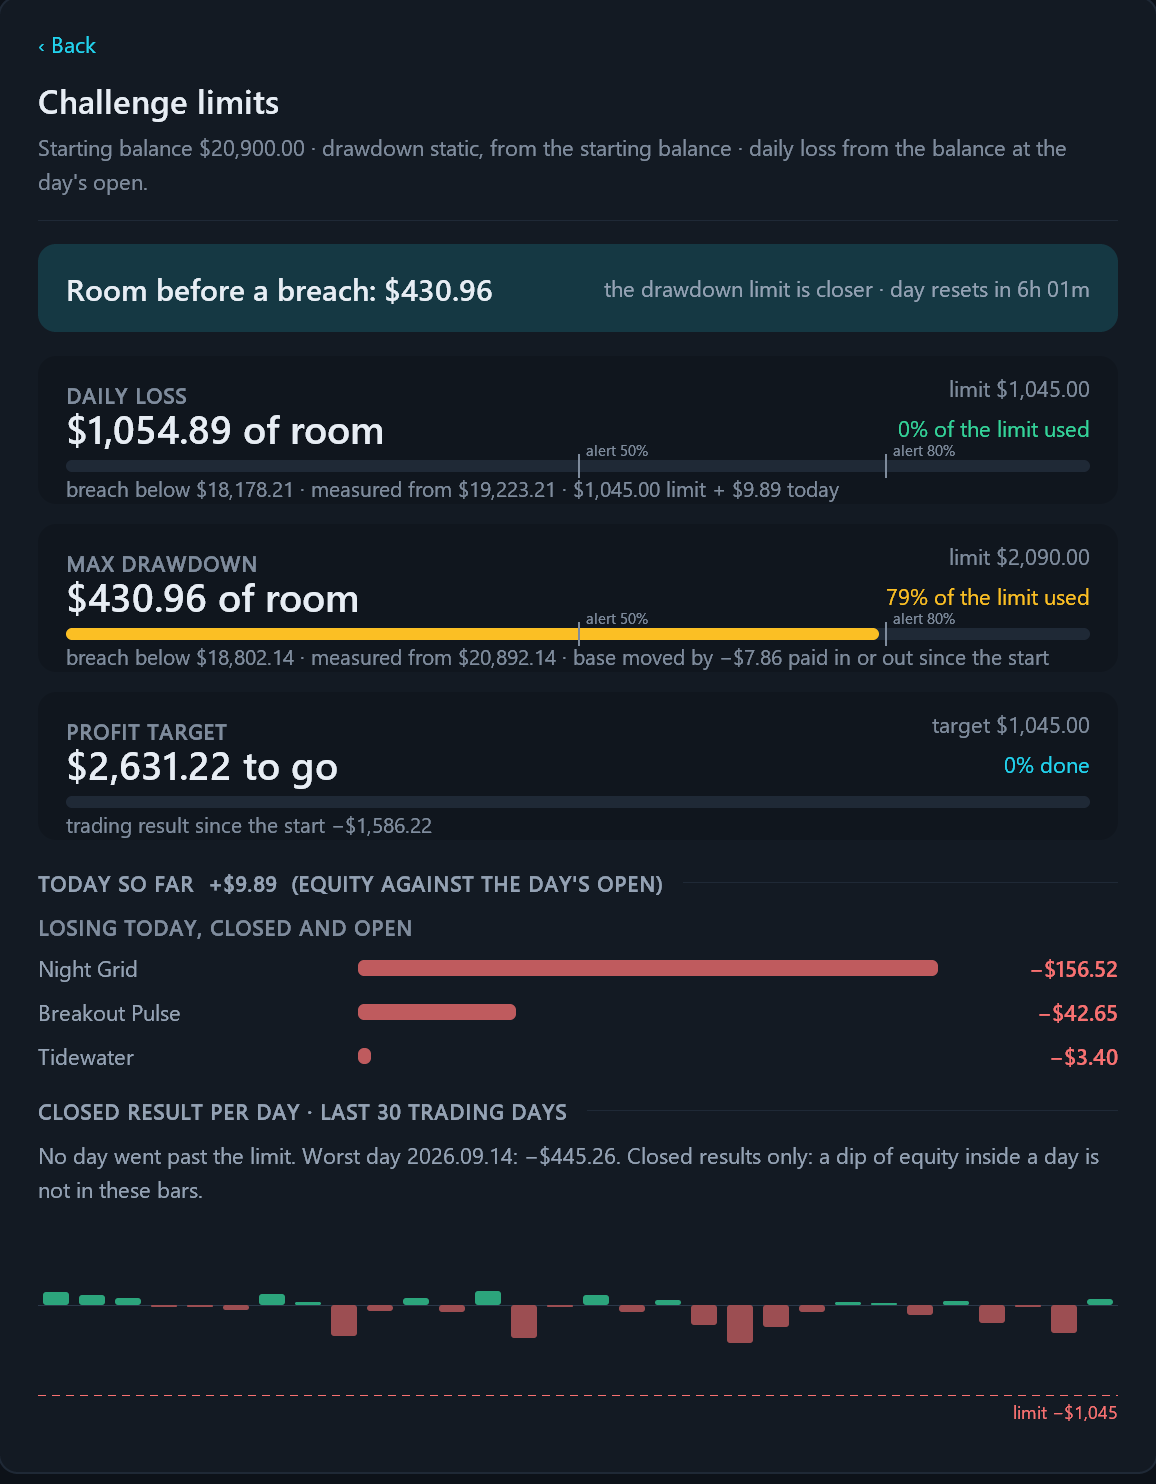
Limits of a prop-firm challenge with the room left on each. The page is switched on with the input Track prop-firm limits, group Prop limits. The daily loss and the maximum drawdown are set in money or in percent of the starting balance; the profit target the same way (0 turns it off). The maximum drawdown is measured statically from the starting balance, trailing from the highest balance, or trailing from the highest equity. The daily loss is measured from the balance at the day's open, from the higher of balance and equity at the day's open, or from the day's highest equity.
The banner shows the room before a breach and which limit is closer. Each card shows the room, the limit, the share used with ticks at the two alert levels (50% and 80%), and the level where the breach happens. Below: today's result against the day's open, the rows losing today (closed and open) and the closed result of the last 30 trading days against the daily limit.
The equity at the day's open is known only when the panel was running in the first minutes of the day; otherwise the balance at the day's open is used, which the history rebuilds exactly, and the card says so. Money paid in or out since the start moves the base, and the card states by how much.
Reports
Strategy Tester reports can be put on the same board in place of the account:
- In the Strategy Tester: Backtest tab, right-click, Report, HTML.
- The report is saved into the folder MQL5\Files\ATT-Strategy-Journal\TesterReports (File → Open Data Folder opens the terminal's data folder).
- The Reports page lists the reports it finds; ticked reports are loaded with Load.
Each report becomes one row named after its Expert Advisor; the magic number is taken from the report's inputs when the EA lists it. Exits are matched to entries by volume and then by the tester's own profit, and the number of inferred pairings is shown in the top bar. The board is marked BACKTEST, the periods count back from the last close in the reports, and names and rows left out are stored apart from the account. Back to account in the top bar returns to the live figures. The Challenge page and the position log are not available for reports.
Guide
The Guide page (F1) lists the grades, the parts of the score, every mark with the rows that carry it right now, the elements of the table, the columns and the keys.
Export, snapshot, card and alerts
- Export (rail, key W): two CSV files with English headers in the account folder, the summary of every row and the position log with every position, its strategy, costs, slippage, worst and best point and whether it is in the current scope.
- Snapshot (rail): the panel as a PNG in the Screens folder.
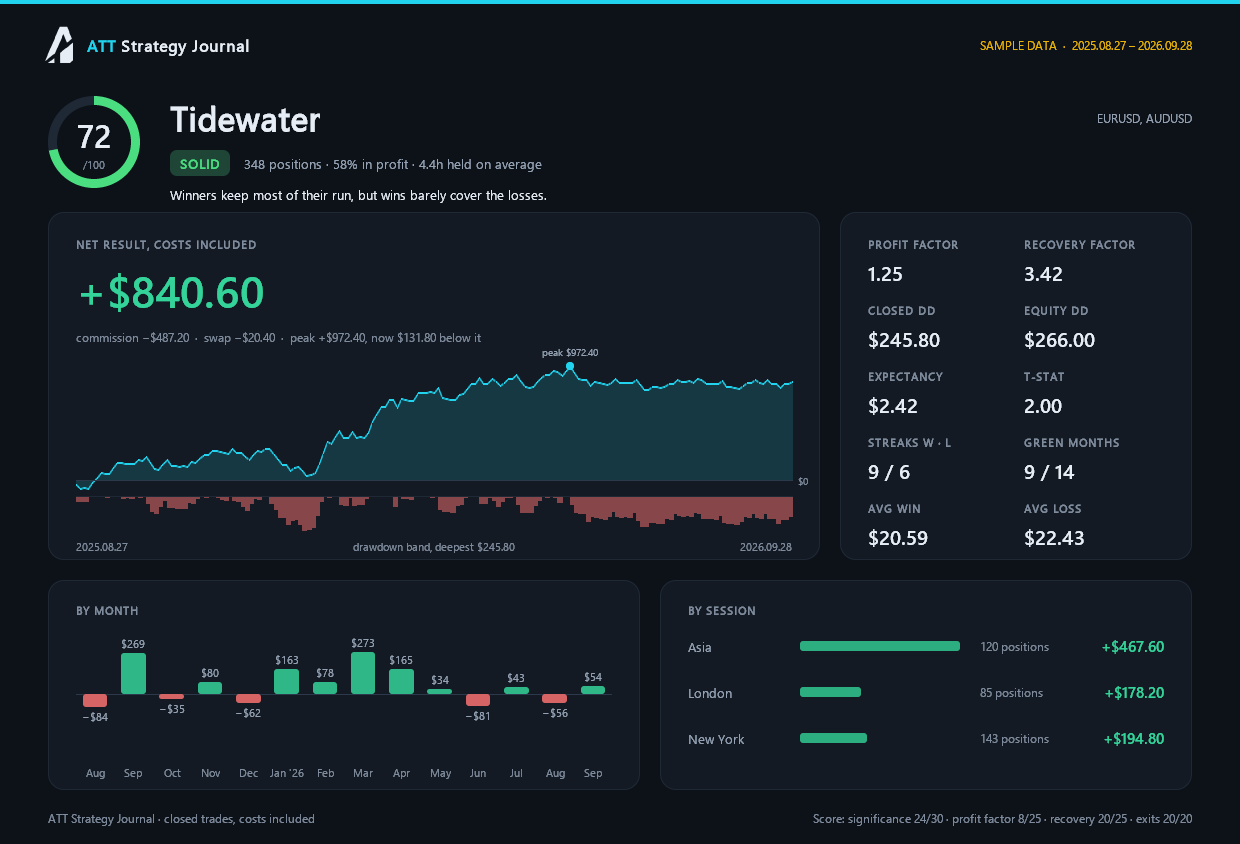
- Share card (inspector): a 1240 × 844 PNG of the selected row with its score, grade, net result, curve with the drawdown band, key figures, months and sessions. The card carries no account number and no broker; the data source and the dates are always printed on it.
- Alerts: sound, pop-up, push notification and e-mail when a challenge limit reaches 50%, 80% and 100% of its size, and when a row gains one of the three danger marks OPEN RISK (red), EQUITY DIPS or UNUSUAL DD. Push and e-mail need the terminal's settings (Tools → Options → Notifications and Email). Alerts work on the live account only and stay silent in the what-if mode.
Fig. 14. The share card of a row.
Languages and themes
The interface is available in English, Russian, Chinese, Spanish, Portuguese, Japanese, German, Korean, French, Italian, Turkish and Arabic. The input Language is set to Auto by default, which follows the terminal's language. The globe at the bottom of the rail switches the language at once; the choice is remembered for every account until the input is changed. The verdicts, marks and dates follow the language too.
Night and Day themes are switched at the bottom of the rail or with L. The Size input scales the panel; Automatic follows the screen density. On a small chart window the panel shrinks to keep its whole layout visible.
Settings
| Group | Input | Default | Meaning |
|---|---|---|---|
| Panel | Language | Auto | interface language; Auto follows the terminal |
| Panel | Theme | Night | Night or Day (L in the panel) |
| Panel | Size | Automatic | Automatic by screen density, 90%, 110% or 125% |
| Panel | Data | Account | the account; in the Strategy Tester the sample account |
| Analysis | Decisions a row needs before it gets a grade | 25 | fewer decisions: TOO EARLY |
| Analysis | Entries this many seconds apart are one decision | 90 | the setup window; 0 never joins entries |
| Analysis | A row turns QUIET after this many days without a close | 21 | threshold of the QUIET mark |
| Analysis | Asia / London / New York session starts, server hour | 1 / 9 / 15 | session start by server time |
| Analysis | Include trades without a magic number | true | manual and mobile trades as the row Manual trades |
| Analysis | Book a position on the day it opened | false | periods by opening time instead of closing time |
| Strategies | Read strategy and EA names from trade comments | true | off: rows are named by magic number |
| Strategies | Put strategies with a shared name under one EA | true | off: every strategy is its own row |
| Strategies | Merge a magic's comments when they look like per-trade noise | true | automatic merge of noisy comments |
| Strategies | Comments to join across magic numbers | empty | comma separated; * at the end makes a prefix |
| Strategies | Your names | empty | 12345=Name for a magic, 12345/comment=Name for one strategy |
| Prop limits | Track prop-firm limits | false | turns on the Challenge page and its alerts |
| Prop limits | Starting balance | 0 | 0: the first deposit |
| Prop limits | Daily loss limit / in % | 5 / true | in money, or in percent of the starting balance |
| Prop limits | Maximum drawdown limit / in % | 10 / true | the same |
| Prop limits | Profit target / in % | 10 / true | 0 turns the target off |
| Prop limits | How the maximum drawdown is measured | static | static, trailing from the highest balance, trailing from the highest equity |
| Prop limits | How the daily loss is measured | balance at the day's open | balance at the open, higher of balance and equity at the open, the day's highest equity |
| Alerts | Pop-up / Sound / Push / E-mail | false / true / false / false | alert channels |
| Correlation | Shared trading days a pair needs | 10 | minimum shared days for a pair in the matrix |
| Diagnostics | Write raw deals and measures on start | false | a service export for support requests |
Keys
The panel takes the keyboard of its chart while it runs, so letters and digits do not open the chart's quick navigation; the chart's own keys and scrolling return when the panel is removed.
| Key | Action |
|---|---|
| ← → | previous or next period |
| P | custom date range |
| S | next session |
| Q | next view: EAs, Symbols, Magics |
| L | Night or Day theme |
| K | one-line or two-line rows |
| / | find a row by name |
| Delete | leave the ticked rows out of the totals |
| O | show the rows left out |
| I | bring every row back |
| M | group the ticked rows under one EA |
| N | ungroup the ticked rows |
| W | save the CSV files |
| Z | read the history again |
| PgUp PgDn Home | page the table |
| F1 | the Guide page |
| Esc | close a list, clear the search, close a page, clear the ticks, back to the account |
Files
Everything the panel writes stays in the terminal's data folder (File → Open Data Folder), in MQL5\Files\ATT-Strategy-Journal:
- one folder per account and server, with the names, groups and rows left out chosen in the panel, the layout of the board and the stored price results;
- inside it, Exports, Screens and Cards: CSV files, snapshots and cards, with the date and time in the file name;
- TesterReports: the Strategy Tester reports for the Reports page.
Deleting an account folder resets only the choices made in the panel; the account history itself is not affected.
If something looks wrong
| Symptom | Cause and action |
|---|---|
| The balance check shows a difference | Incomplete history: History tab of the Toolbox, right-click, All History; then Z reads the history again. |
| The number of trades differs from another tool | Partial closes: a position counts once here. The position log export shows the deals of each position. |
| One EA is split into many rows | Its comment changes from trade to trade: Merged on the Magics page, or M on the ticked rows, which puts them under one EA. |
| Two different EAs appear as one | They share a comment prefix: the input Put strategies with a shared name under one EA is turned off, or Ungroup (N) on the ticked rows. |
| The equity drawdown or the Exits part is empty | Price history is still loading, or the broker has no bars for very old positions; the Risk tab states the coverage. |
| No marks or grades on a new account | Fewer decisions than the minimum: the row is TOO EARLY until it has 25 decisions (input). |
| The text is too large or too small | The Size input. |
Limitations
- The panel works on a real or a demo account; in the Strategy Tester it shows the sample account, without the price-bar figures.
- A complete result needs the complete account history loaded in the terminal.
- The worst and best points and the equity drawdown are rebuilt from price bars, not from ticks, so they are close estimates. The depth of price history depends on the broker.
- The equity at the day's open for the challenge limits is known only when the panel was running at the start of the day.
- Entry slippage is measured only for pending orders: a market order has no requested price.




