JET Pattern Classifier (Free + PRO): the predominant market direction read by a machine learning classifier

JET Pattern Classifier is a new indicator for MetaTrader 5 that uses a machine learning classifier to read each closed bar and show the predominant direction of the market on the price chart. It comes in two editions: JET Pattern Classifier, free, with the arrows where the direction changes and fixed settings, and JET Pattern Classifier PRO, which adds the direction score of each bar, candles colored by score, trend and strength filters, editable settings, calculation on a higher timeframe, a 4-timeframe panel, alerts and data for Experts.
How it works
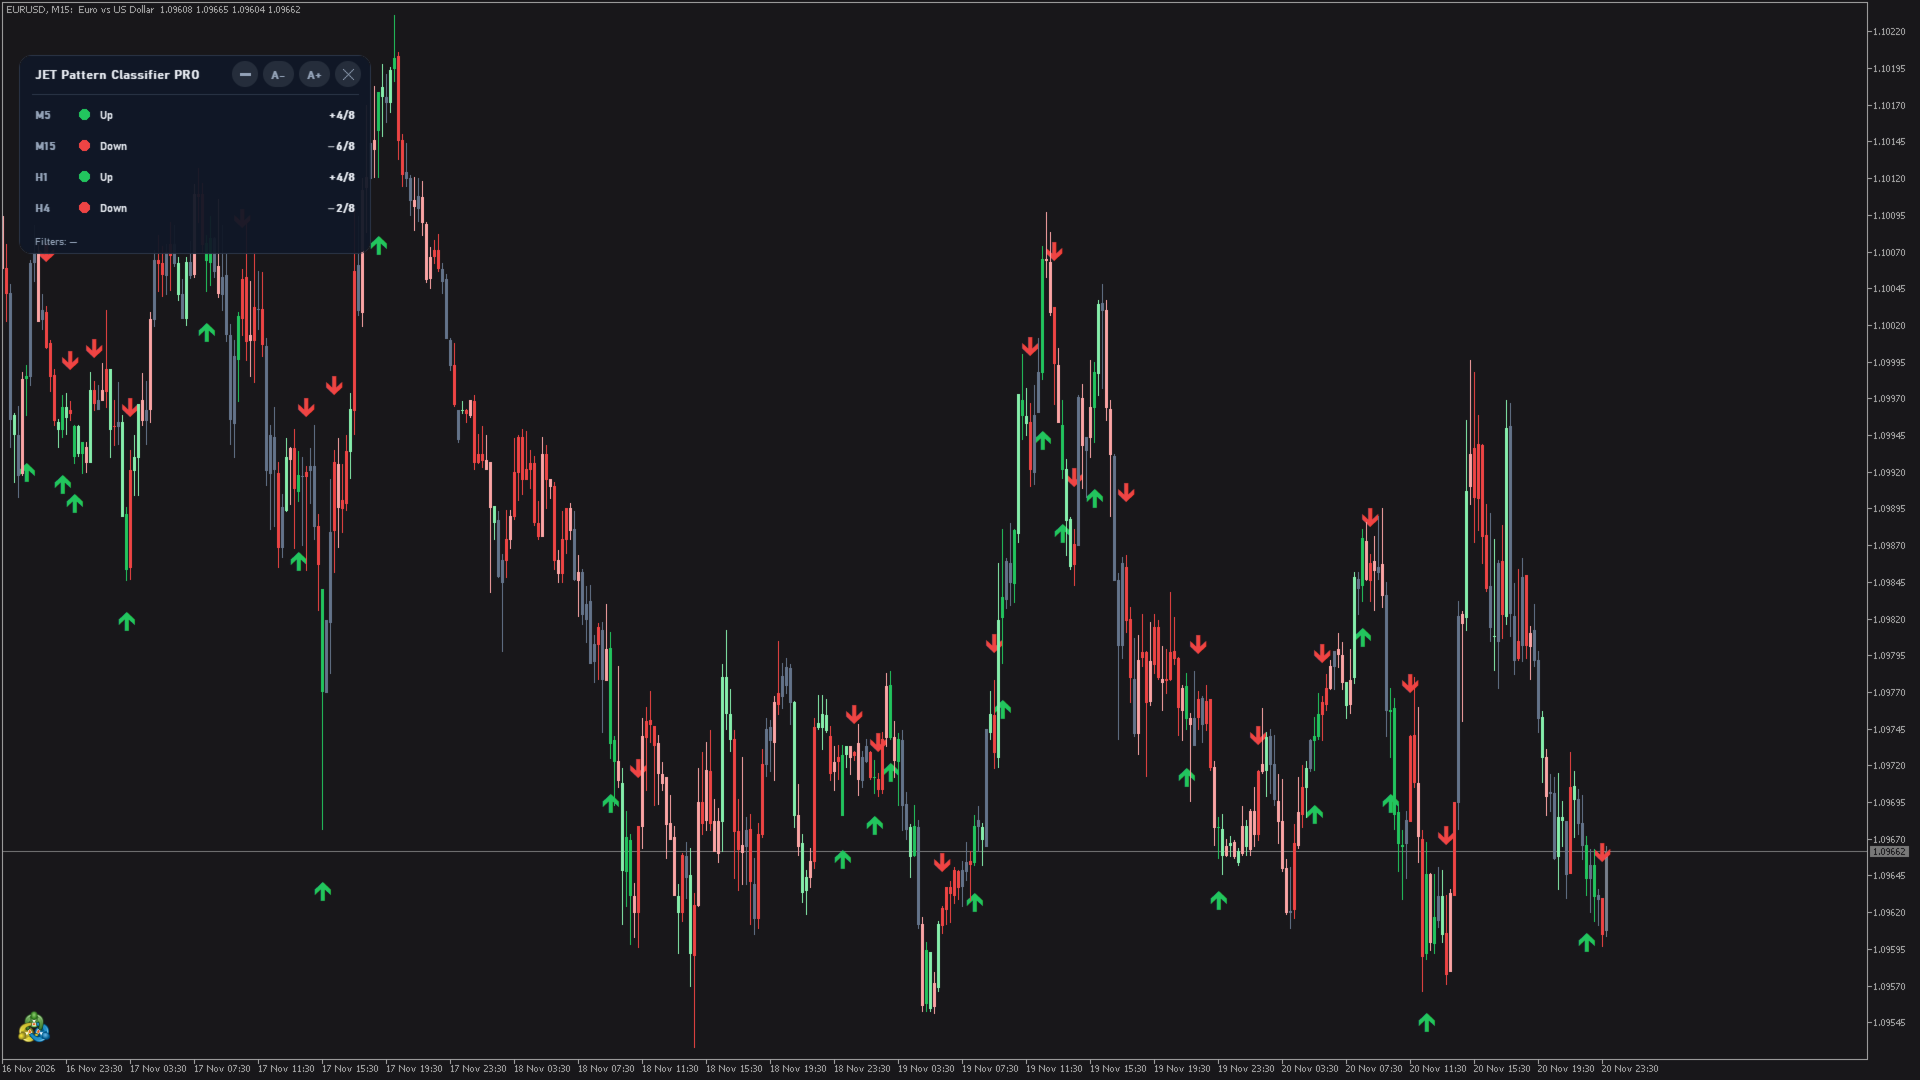
On each closed bar, the classifier gives a direction score: positive values point up, negative values point down, and the larger the value, the stronger the predominant direction. When the direction changes, an arrow appears on that bar: a green arrow below the bar for up, a red arrow above the bar for down. In the PRO version, the candles are also colored by the score.
Each bar is classified only once, when it closes, using only the data available up to that bar: the score, the direction and the arrows of closed bars never change, so nothing repaints. The forming bar is not classified and never has a signal. It is an indicator only: it never opens, closes or changes orders.
Free or PRO?
| Free | PRO | |
|---|---|---|
| Direction change arrows on closed bars, no repainting | yes | yes |
| Bars calculated | 3,000 | 5,000 by default (up to 20,000) |
| Direction score of each bar | — | yes |
| Candles colored by score (strong up to strong down) | — | yes |
| Editable sensitivity and history settings | — (fixed) | yes |
| Trend filter and strength filter | — | yes |
| Calculation on a higher timeframe | — | yes |
| Editable colors | — | yes |
| Panel with 4 timeframes, dark / light / automatic theme, interface in 11 languages | — | yes |
| Alerts: popup, sound, push notification, e-mail | — | yes |
| Data for Experts (iCustom buffers) | — | yes |
| Programmatic use (Draw graphics, Max bars to draw, Max bars to calculate) | — | yes |
The free version draws only the arrows, with the default settings of the PRO version and dark colors, on 3,000 bars so the chart opens quickly. A small note in the window reminds you of what the PRO version adds.
What you see in the PRO version
- Candles colored by score in five colors: strong up, weak up, neutral, weak down and strong down. A candle is strong when its score reaches Minimum score for a direction up or down, weak when the score is positive or negative but below that value, and neutral when the score is 0. The forming candle keeps its normal color. Can be turned off.
- Direction change arrows on closed bars: green below the bar for up, red above the bar for down. Can be turned off.
- A new direction starts on the first closed bar with a strong score on the other side that passes the filters; weak and neutral bars keep the current direction.
- Optional trend filter and strength filter, to keep only the signals that agree with the trend or that appear with enough market strength.
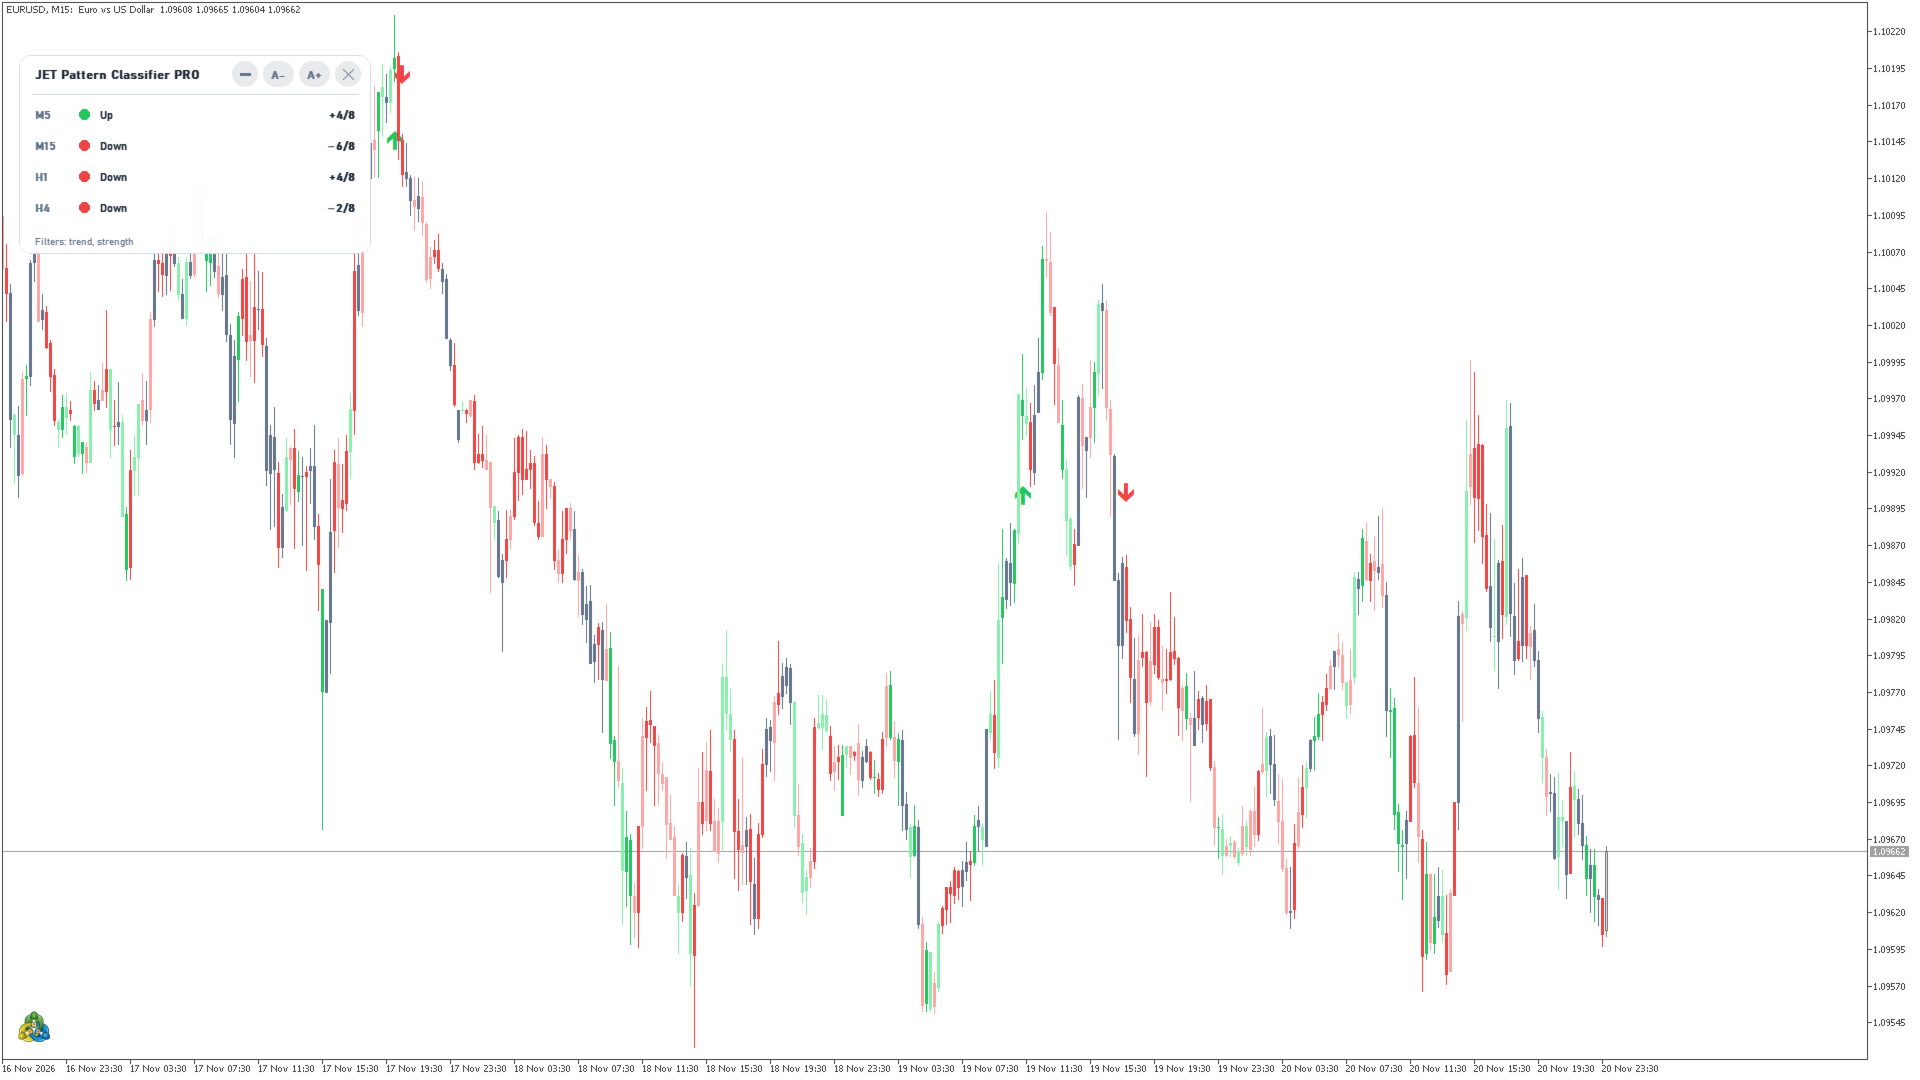
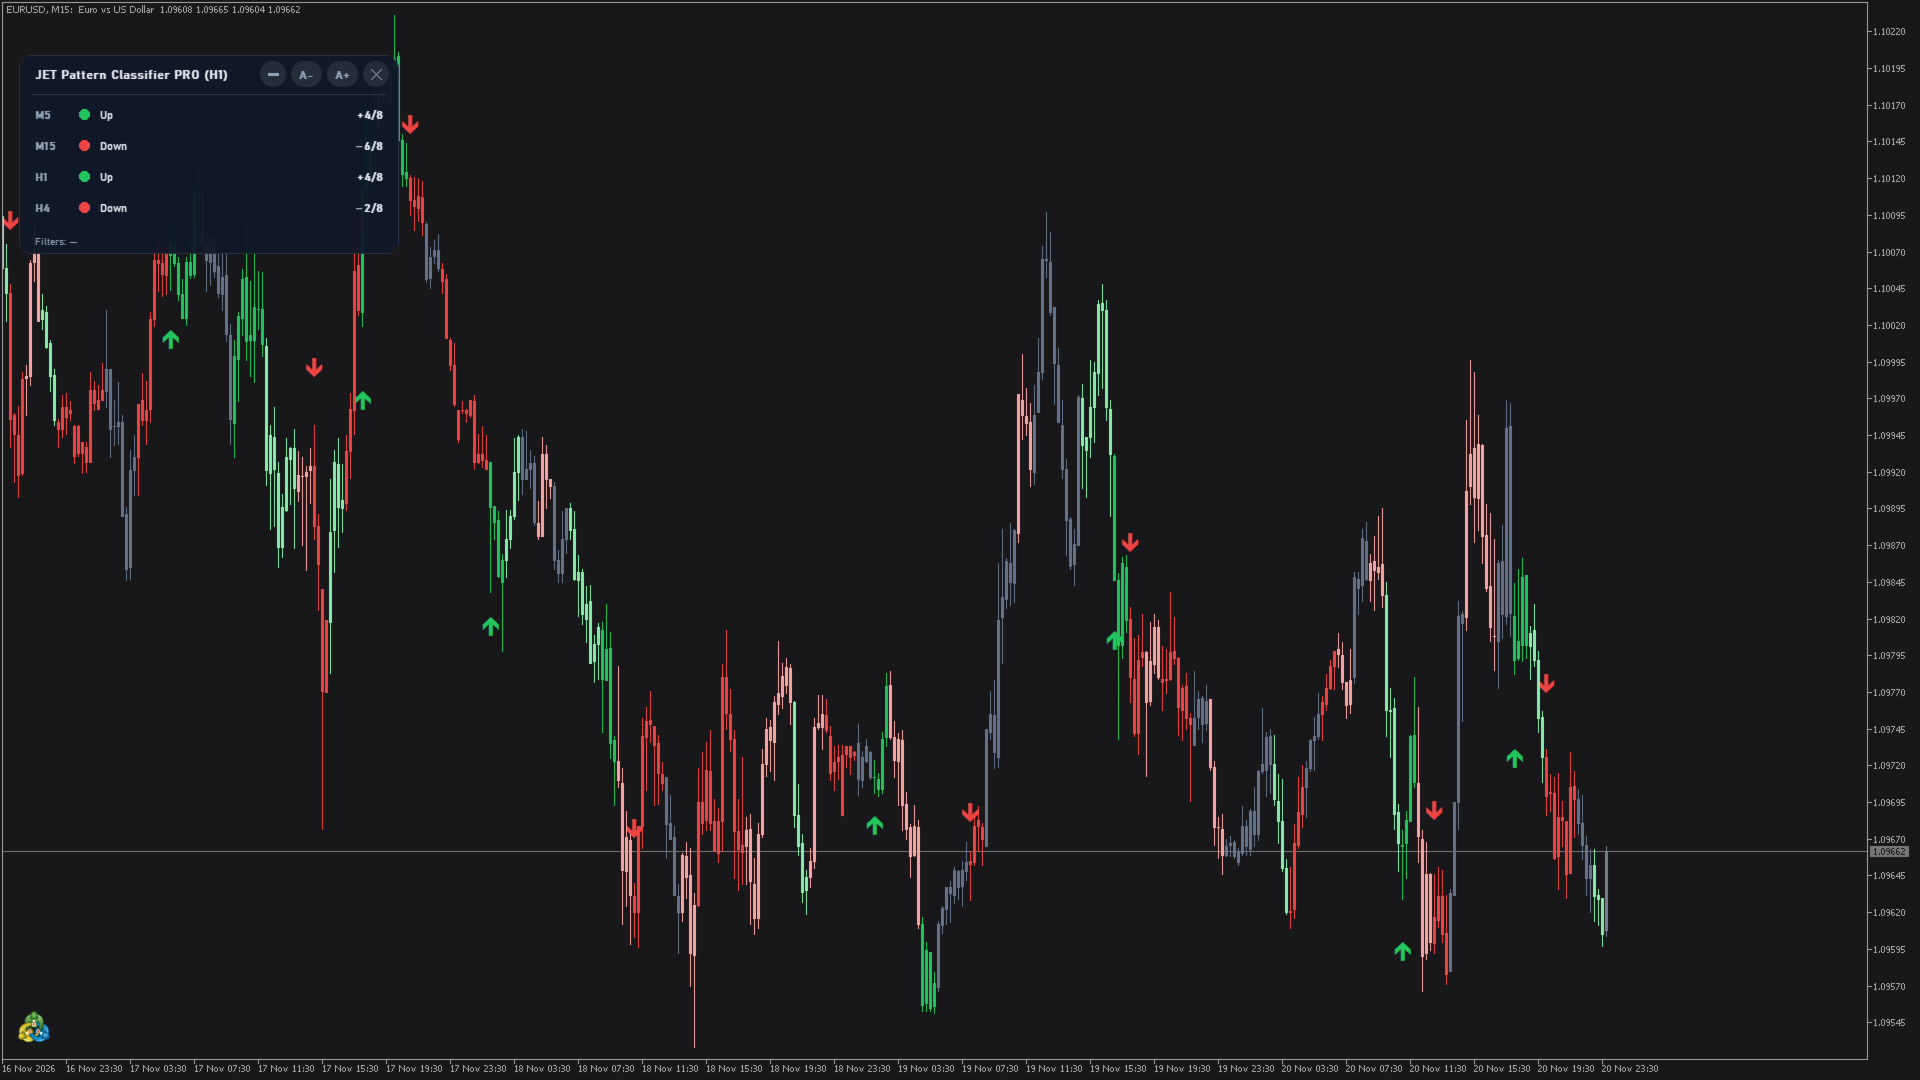
- Calculation on a higher timeframe (for example H1 on an M15 chart).
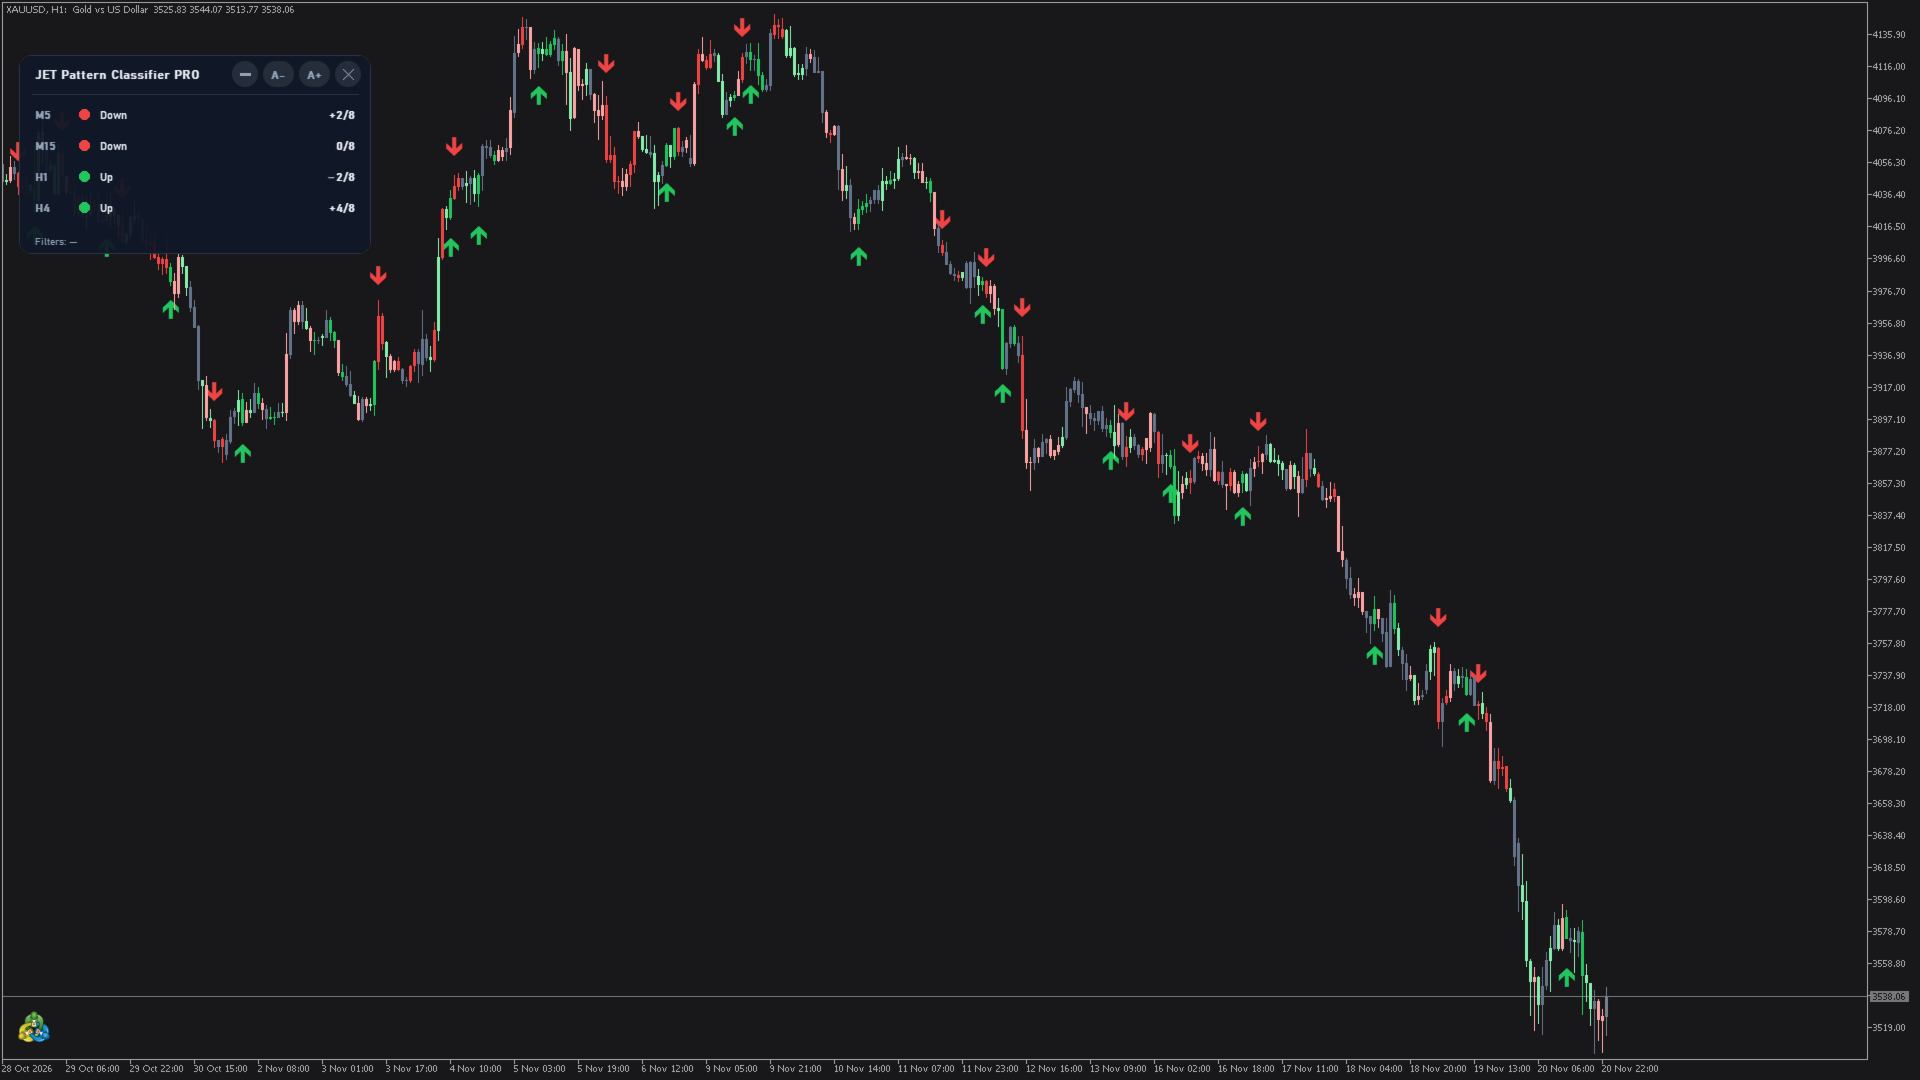
- State panel with 4 timeframes: the direction and the score of the last closed bar of each timeframe, and the filters in use.
Settings and timeframes
The labels below are the ones of the indicator's input window.
- Calculation: Inputs used (2-5), Input 1 length (2-100), Input 2 length A (2-100), Input 2 length B (2-100), Input 3 length (2-100), Input 4 length (2-100), Input 5 length (2-100), Look-ahead of the history (1-50 bars), Comparisons (k, 1-30), Minimum score for a direction (1-k), History used (200-10000 bars) and Spacing (1-20 bars) are the sensitivity and history settings: they make the reading more or less sensitive and use more or less history. The default values are a balanced starting point.
- Minimum score for a direction (1-k) is the score a bar needs to set a direction and to get a strong color: lower values give more direction changes, higher values a steadier direction.
- Bars to calculate (500-20000): 5,000 by default. Timeframe of the calculation (current or higher): for example H1 on an M15 chart; the score, the colors and the arrows then follow the closed bars of that timeframe.
- Filters (off by default): Trend filter, with Trend filter length (10-1000), keeps only the directions that agree with the trend (a larger length follows a longer trend). Strength filter, with Strength filter minimum (0-100), keeps only the signals that appear with at least that market strength. A signal blocked by a filter does not change the direction.
- Display: Arrows on direction changes, Color the candles by score and the five colors Strong up, Weak up, Neutral, Weak down and Strong down.
- Nothing is recalculated on each tick: the score, the colors and the arrows change only when a bar closes.
Alerts on the closed bar
- Direction changed (message "Direction changed to up" or "Direction changed to down") and Score reached the maximum (+k / -k) (message "Score at the maximum (up)" or "Score at the maximum (down)"). The second one fires on the bar where the score reaches the maximum, not again while it stays there.
- Each alert has its own mode: Off, Popup, Sound, Smartphone notification, Popup + Sound, Notification + Sound, Popup + Notification or Popup + Sound + Notification. Sound chooses the sound (alert2 by default) and Also by e-mail also sends the alerts by e-mail.
- By default, only Direction changed is on (Popup + Sound).
Data for Experts (iCustom)
- Buffer 0: score (whole number; positive = up, negative = down; empty on the forming bar)
- Buffer 1: direction before the filters (+1 = up, -1 = down, 0 = neutral)
- Buffer 2: direction (+1 = up, -1 = down, 0 = none yet)
- Buffer 3: direction change on this bar (+1 = up, -1 = down, 0 = none)
- Buffer 4: bars since the last change
- Values are valid on closed bars (index 1 or higher); on bar 0 the score is empty and the change is 0.
- With a higher timeframe, the values come from the last closed bar of that timeframe, mapped to the chart bars; a signal shows on the first chart bar after that bar closes.
Panel (PRO)
- Four timeframes (M15, H1, H4 and D1 by default), set in Panel timeframe 1 to Panel timeframe 4; Show the panel turns it on or off. Each row shows a colored dot, the direction "Up", "Down" or "Neutral" and the score of the last closed bar of that timeframe.
- The footer shows the filters in use: "Filters: trend, strength", or "Filters: —" when both are off. With a higher calculation timeframe, it appears in the title, for example "JET Pattern Classifier PRO (H1)".
- Right after the indicator is attached, a row may show "Loading..." for a few seconds while the terminal prepares that timeframe. If the terminal does not have enough history for it, the row shows "No history" with the bars available / needed instead of waiting without end.
- Title bar buttons: [–] collapses the panel to its title bar, [A-] / [A+] resize it from 60% to 200%, [X] removes the indicator with all its objects. Panel size (60-200 %) sets the starting size. The size and the collapsed state are saved for each chart. The panel can be dragged and always stays whole inside the chart.
- Theme: Dark (default), Light or Automatic (chart background).
- Language: Terminal language (default) or one of 11 languages: English, Português, Español, Русский, Deutsch, Français, Italiano, 中文, 日本語, 한국어, Türkçe. The panel and the alert messages use this language.
Programmatic use (PRO)
The last group of inputs, PROGRAMMATIC USE, is meant for Experts and dashboards that read the indicator through iCustom, often on many symbols at once. The default values keep the normal behavior.
- Draw graphics (true by default): with false, nothing is drawn on the chart (arrows, colored candles and panel). The data for Experts and the alerts stay the same.
- Max bars to draw (0 = all): arrows and colored candles only on the last N bars. The data for Experts does not change.
- Max bars to calculate (0 = all): the calculation covers only the last N bars; before them the buffers are empty.
- These inputs are at the end of the list, so the positions of the other inputs in an iCustom call do not change. Each input group also counts as one position in iCustom.
Works on any symbol and timeframe
- Forex, indices, stocks, metals, crypto and futures from any exchange, such as CME or B3, with any broker.
- Any chart timeframe; on a lower timeframe chart you can follow the reading of a higher timeframe.
Download
- JET Pattern Classifier — free direction change arrows.
- JET Pattern Classifier PRO — everything described above.
Questions and suggestions: send me a private message through my MQL5 profile.