JET Kernel Envelope (Free + PRO): a smooth center line colored by slope, with an envelope

JET Kernel Envelope is a new indicator for MetaTrader 5 that draws on the price chart a smooth center line colored by its slope, with an envelope above and below it. It comes in two editions: JET Kernel Envelope, free, with the line and the envelope on fixed settings, and JET Kernel Envelope PRO, which adds arrows on slope turns, marks when price closes outside the envelope and when it returns inside, editable settings, calculation on a higher timeframe, a 4-timeframe panel, alerts and data for Experts.
How it works
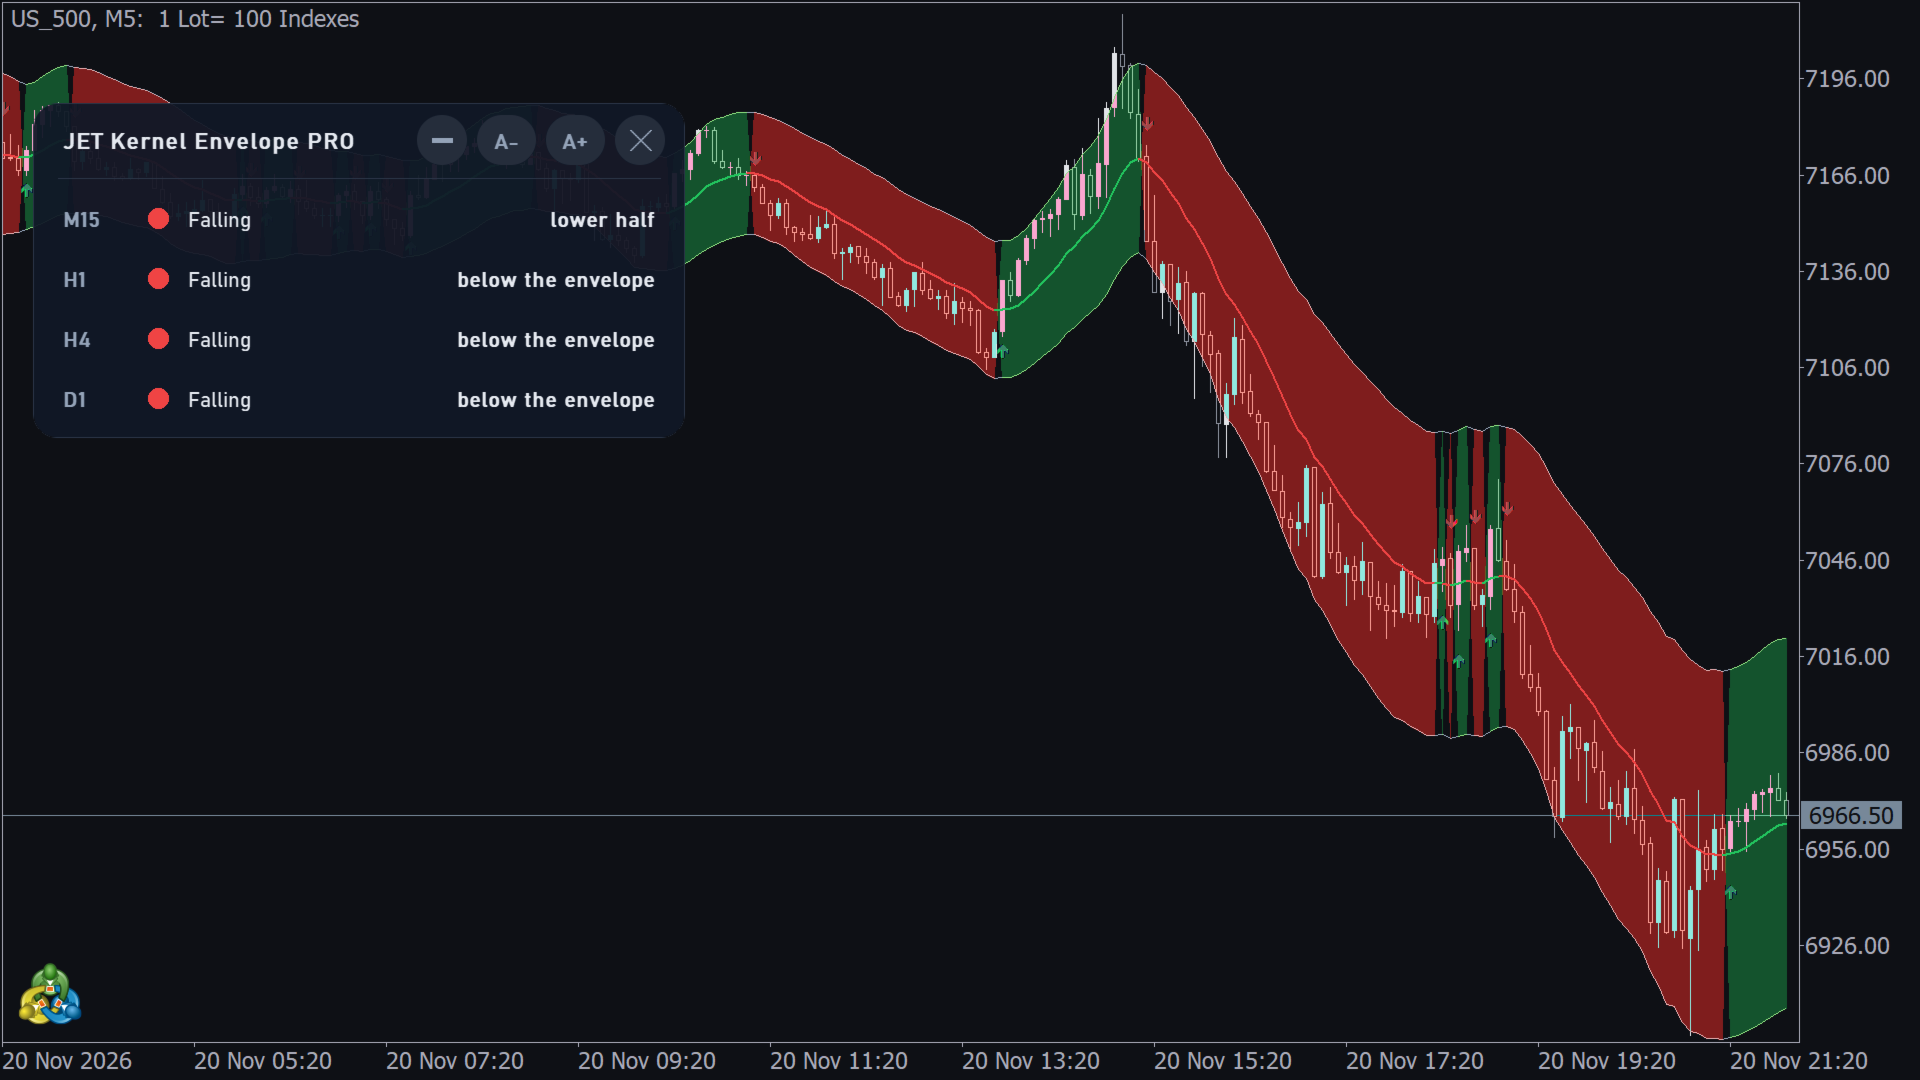
The center line follows price smoothly: it is green while it is rising and red while it is falling. The envelope above and below it shows how far price is stretched from the center line, and the area between its two edges is filled in the color of the slope.
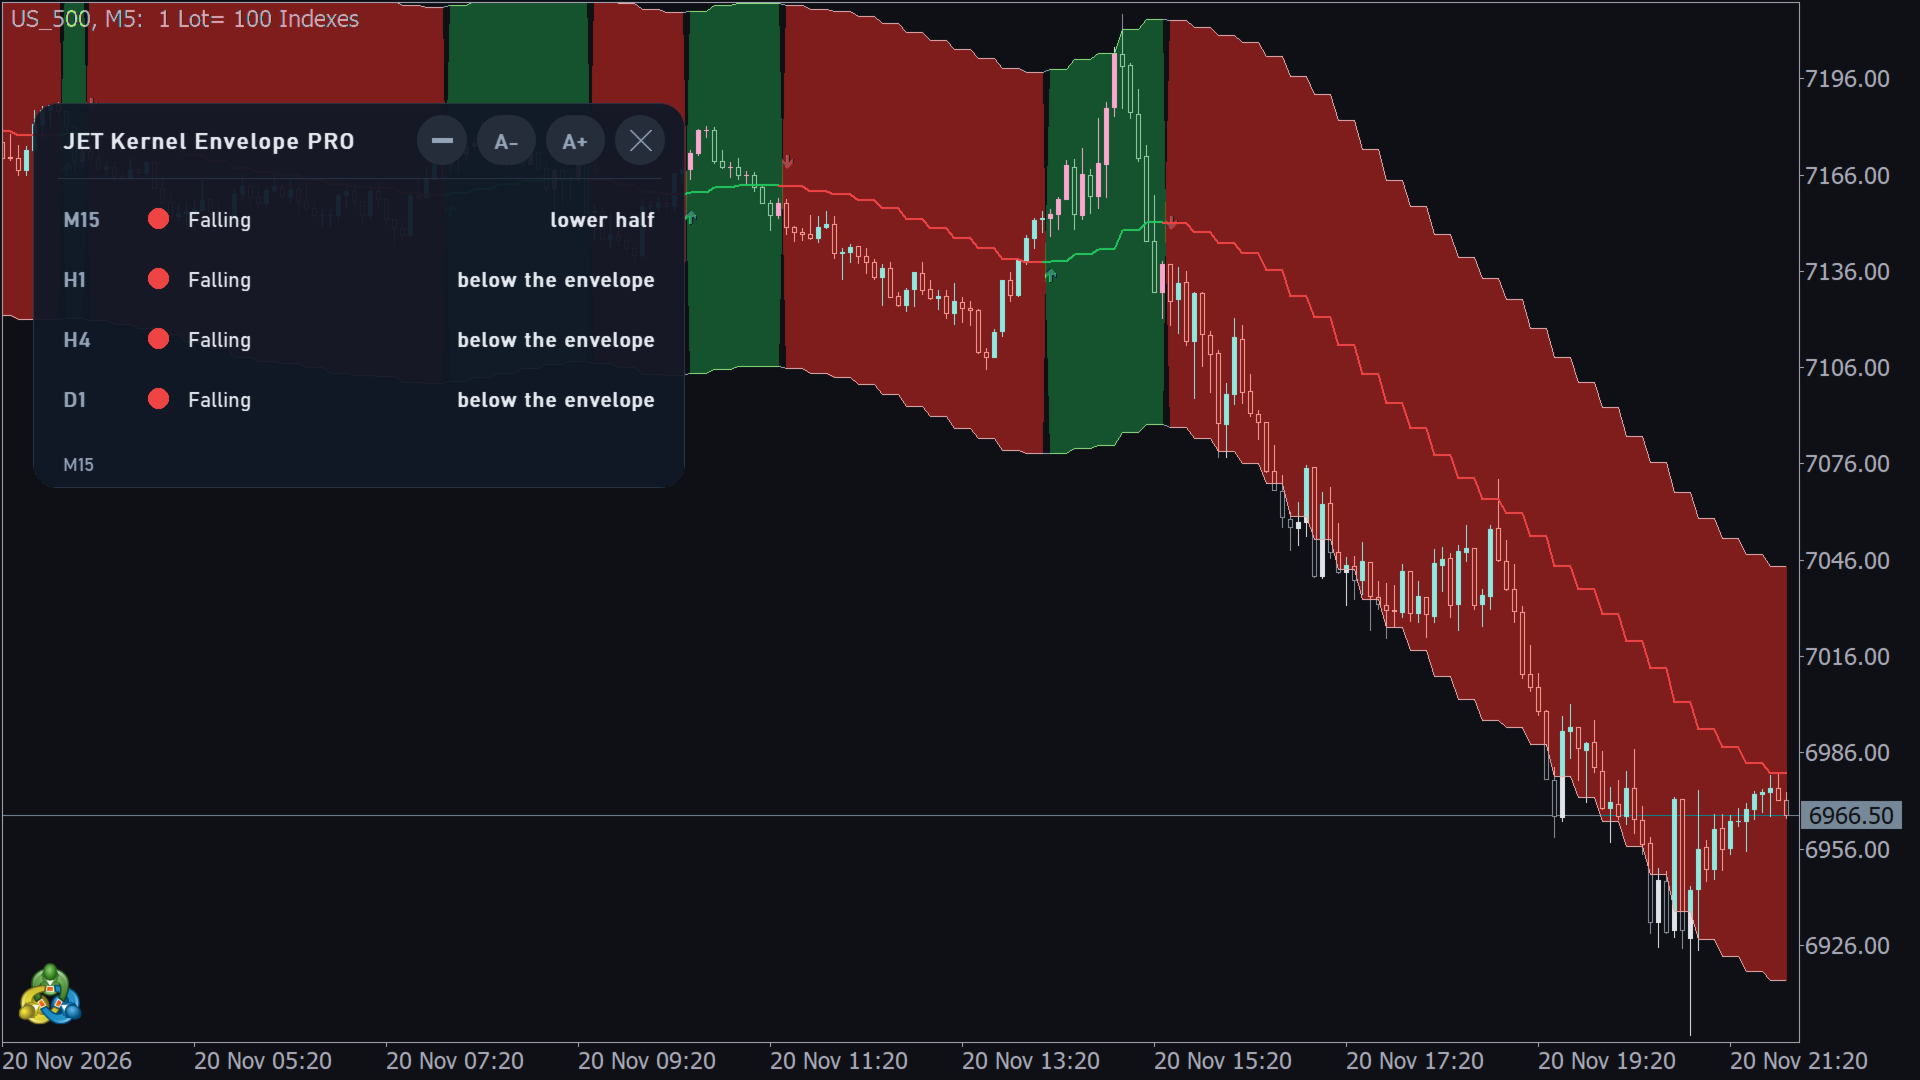
Signals (PRO). When the slope of the line turns, an arrow appears on the closed bar: a green arrow below the bar for a turn up, a red arrow above the bar for a turn down. Optional marks show the closed bar where price closes outside the envelope and the bar where it closes back inside.
The line uses only the bars up to each bar: the value of a closed bar never changes and the past is never redrawn. There is no projection into future bars. Signals are evaluated on the closed bar; the forming bar keeps updating until it closes. It is an indicator only: it never opens, closes or changes orders.
Free or PRO?
| Free | PRO | |
|---|---|---|
| Smooth center line colored by slope (green / red) | yes | yes |
| Upper and lower envelope with fill | yes | yes |
| Closed bars never repaint | yes | yes |
| Arrows on slope turns | — | yes |
| Marks on envelope exits and returns | — | yes |
| Editable settings: price, line style, smoothness, minimum slope change, envelope mode, width and length | — | yes |
| Editable colors and line width (Free: fixed dark colors) | — | yes |
| Calculation on a higher timeframe (Free: chart timeframe only) | — | yes |
| Panel with 4 timeframes, dark / light / automatic theme, 11 languages | — | yes |
| Alerts: popup, sound, push notification, e-mail | — | yes |
| Data for Experts (iCustom buffers) | — | yes |
The free edition has no inputs: it uses the default values of the PRO, on the chart timeframe, with dark colors. A small note in the window reminds you of what the PRO adds.
What the PRO shows
- Center line in green (rising) or red (falling), with editable width.
- Upper and lower envelope with a fill in the color of the slope. The envelope and the fill can each be turned off.
- Arrows on slope turns: green below the bar for a turn up, red above the bar for a turn down (on by default).
- Marks on envelope exits and returns (off by default): a dot above the bar when price closes above the envelope or closes back inside from above, and a dot below the bar when price closes below the envelope or closes back inside from below. Each mark is created on the closed bar and never changes.
- State panel with 4 timeframes: Rising or Falling, and where the close is relative to the envelope.
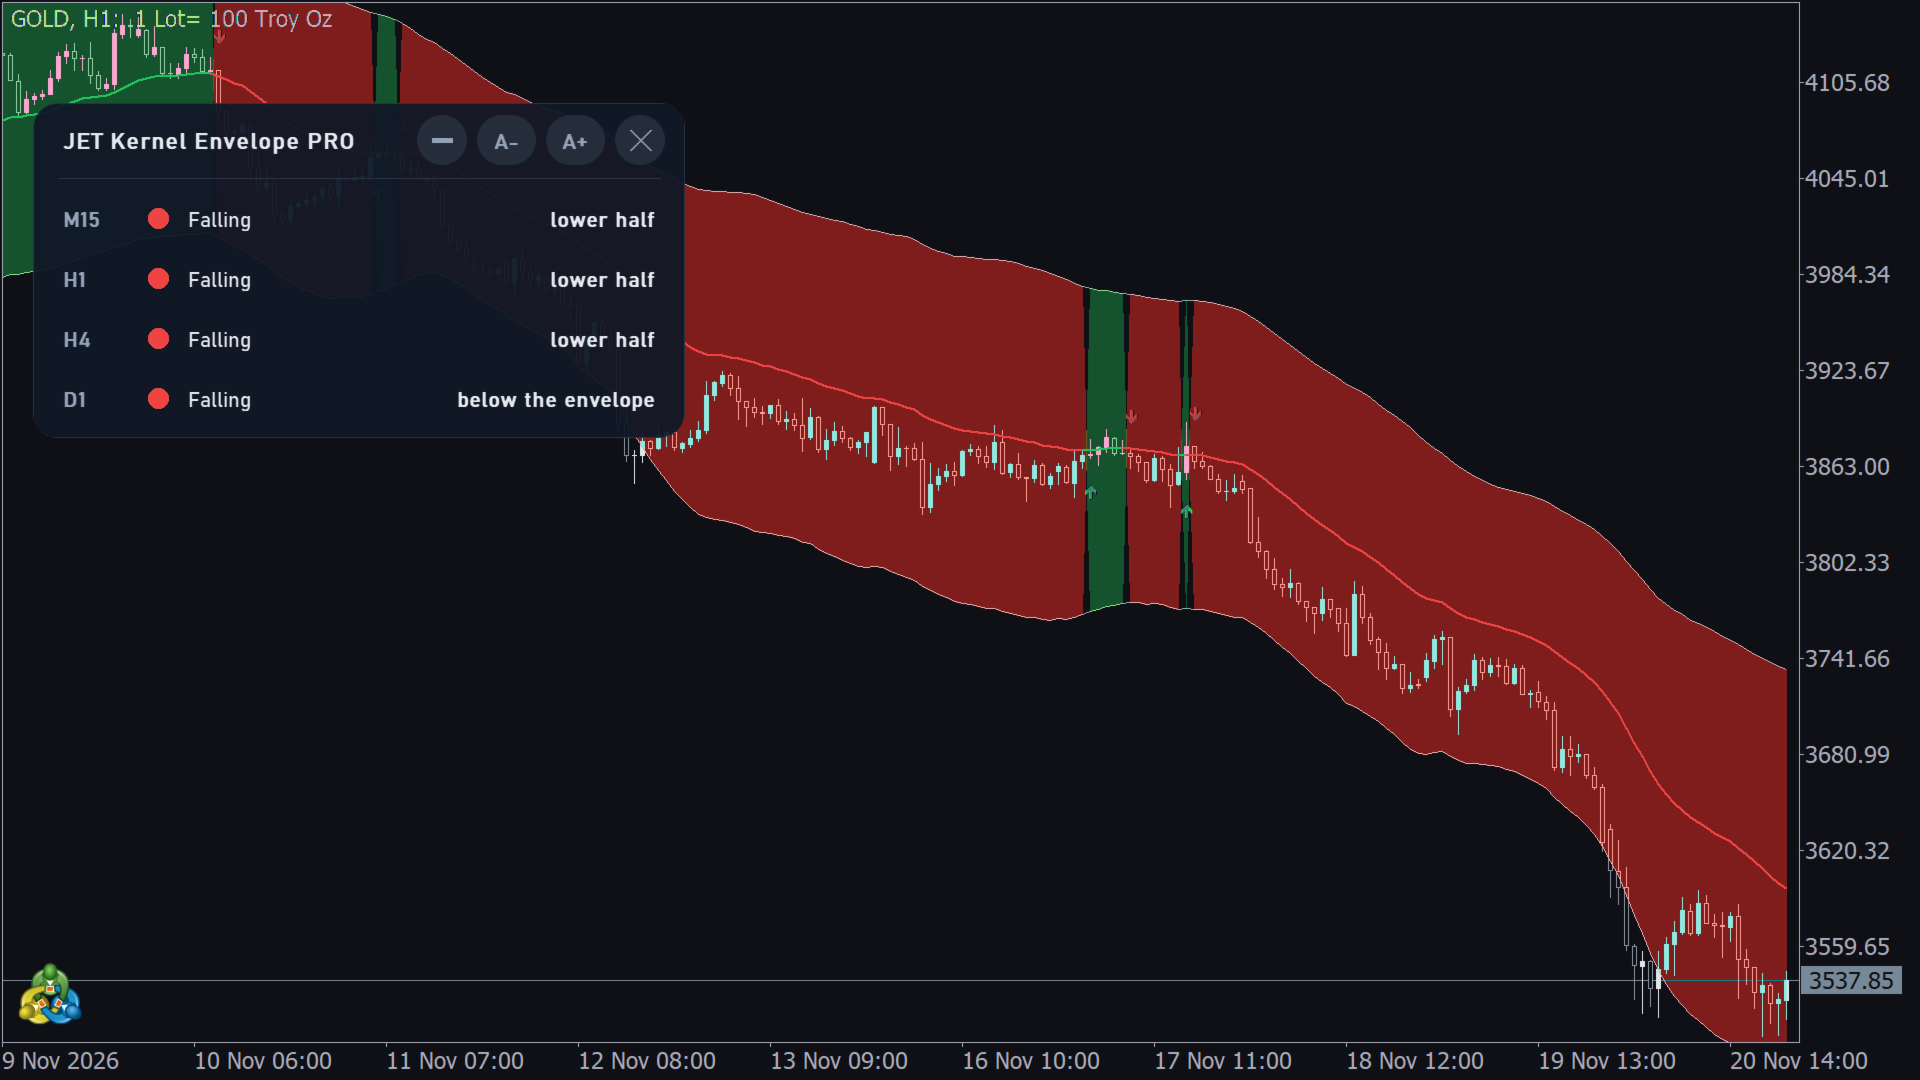
- Calculation on a higher timeframe, for example the H1 line and envelope on an M5 chart.
Settings and timeframes
Calculation
- Price: Close (default), HL2, HLC3 or OHLC4: the price the line follows.
- Line style: Smooth (default) or Wide. Wide draws a calmer line, which reacts less to short moves.
- Smoothness (1-100): higher values give a smoother, slower line; lower values follow price more closely (default 8).
- Wide style: tail weight (0.1-25): used only with the Wide style. Lower values make the line calmer; higher values bring it closer to the Smooth style (default 1.0).
- Bars used (10-500): the most recent bars the line takes into account (default 100).
- Minimum slope change (0-1, fraction of the envelope): with 0 (default) every turn of the line counts; higher values ignore small turns, measured as a fraction of the envelope width.
- Envelope: Average distance (default) or Volatility (ATR), two ways of sizing the envelope.
- Envelope width: higher values widen the envelope, so price closes outside it less often (default 3.0).
- Envelope length (2-1000): how many bars the envelope width is based on; higher values give a steadier width (default 100). If you choose Volatility (ATR) and leave the width and length at 3.0 and 100, the indicator uses 2.0 and 50, which suit that mode better, and writes a note in the Experts tab of the terminal.
- Bars to calculate (500-50000): 5,000 by default.
- Timeframe of the calculation (current or higher): the chart timeframe (default) or a higher one, for example H1 on an M5 chart. The values of each higher-timeframe bar are shown on the chart bars it covers.
Display
- Show envelope and Fill the envelope: turn the envelope lines and the fill on or off (both on by default).
- Arrows on slope turns (on by default) and Marks on envelope exits and returns (off by default).
- Colors: Line, rising, Line, falling, Envelope (also used for the marks), Fill, rising and Fill, falling. Line width: 1 to 5 (default 2).
Alerts on the closed bar
Group Alerts (closed bar):
- Slope turned (message "Line turned up" or "Line turned down"), Close outside the envelope ("Close above the envelope" or "Close below the envelope") and Close back inside the envelope ("Close back inside, from below" or "Close back inside, from above"), each with its own mode: Off, Popup, Sound, Smartphone notification, Popup + Sound, Notification + Sound, Popup + Notification or Popup + Sound + Notification.
- Sound: the sound of the alerts (alert2 by default). Also by e-mail: also sends the alerts by e-mail (off by default; the e-mail must be set up in the terminal options).
- By default, only the slope turn alert is on (Popup + Sound).
- Each alert fires once, when the bar closes; nothing fires while the history is loading.
Data for Experts (iCustom)
- Buffer 0: center line (price)
- Buffer 1: slope state (0 = none yet, 1 = rising, 2 = falling)
- Buffer 2: upper envelope (price)
- Buffer 3: lower envelope (price)
- Buffer 4: slope (+1 = rising, -1 = falling)
- Buffer 5: close position (+2 = above the envelope, +1 = above the line, -1 = below the line, -2 = below the envelope)
- Buffer 6: slope turn on this bar (+1 = up, -1 = down, 0 = none)
- Buffer 7: envelope event on this bar (+2 = closed above, -2 = closed below, +1 = back inside from below, -1 = back inside from above, 0 = none)
- Signals (buffers 6 and 7) are valid on closed bars (index 1 or higher) and stay 0 on bar 0; buffers 0 to 5 update with each tick.
- With a higher timeframe, the values come from the last closed bar of that timeframe, mapped to the chart bars; a signal shows on the first chart bar after that bar closes.
Panel (PRO)
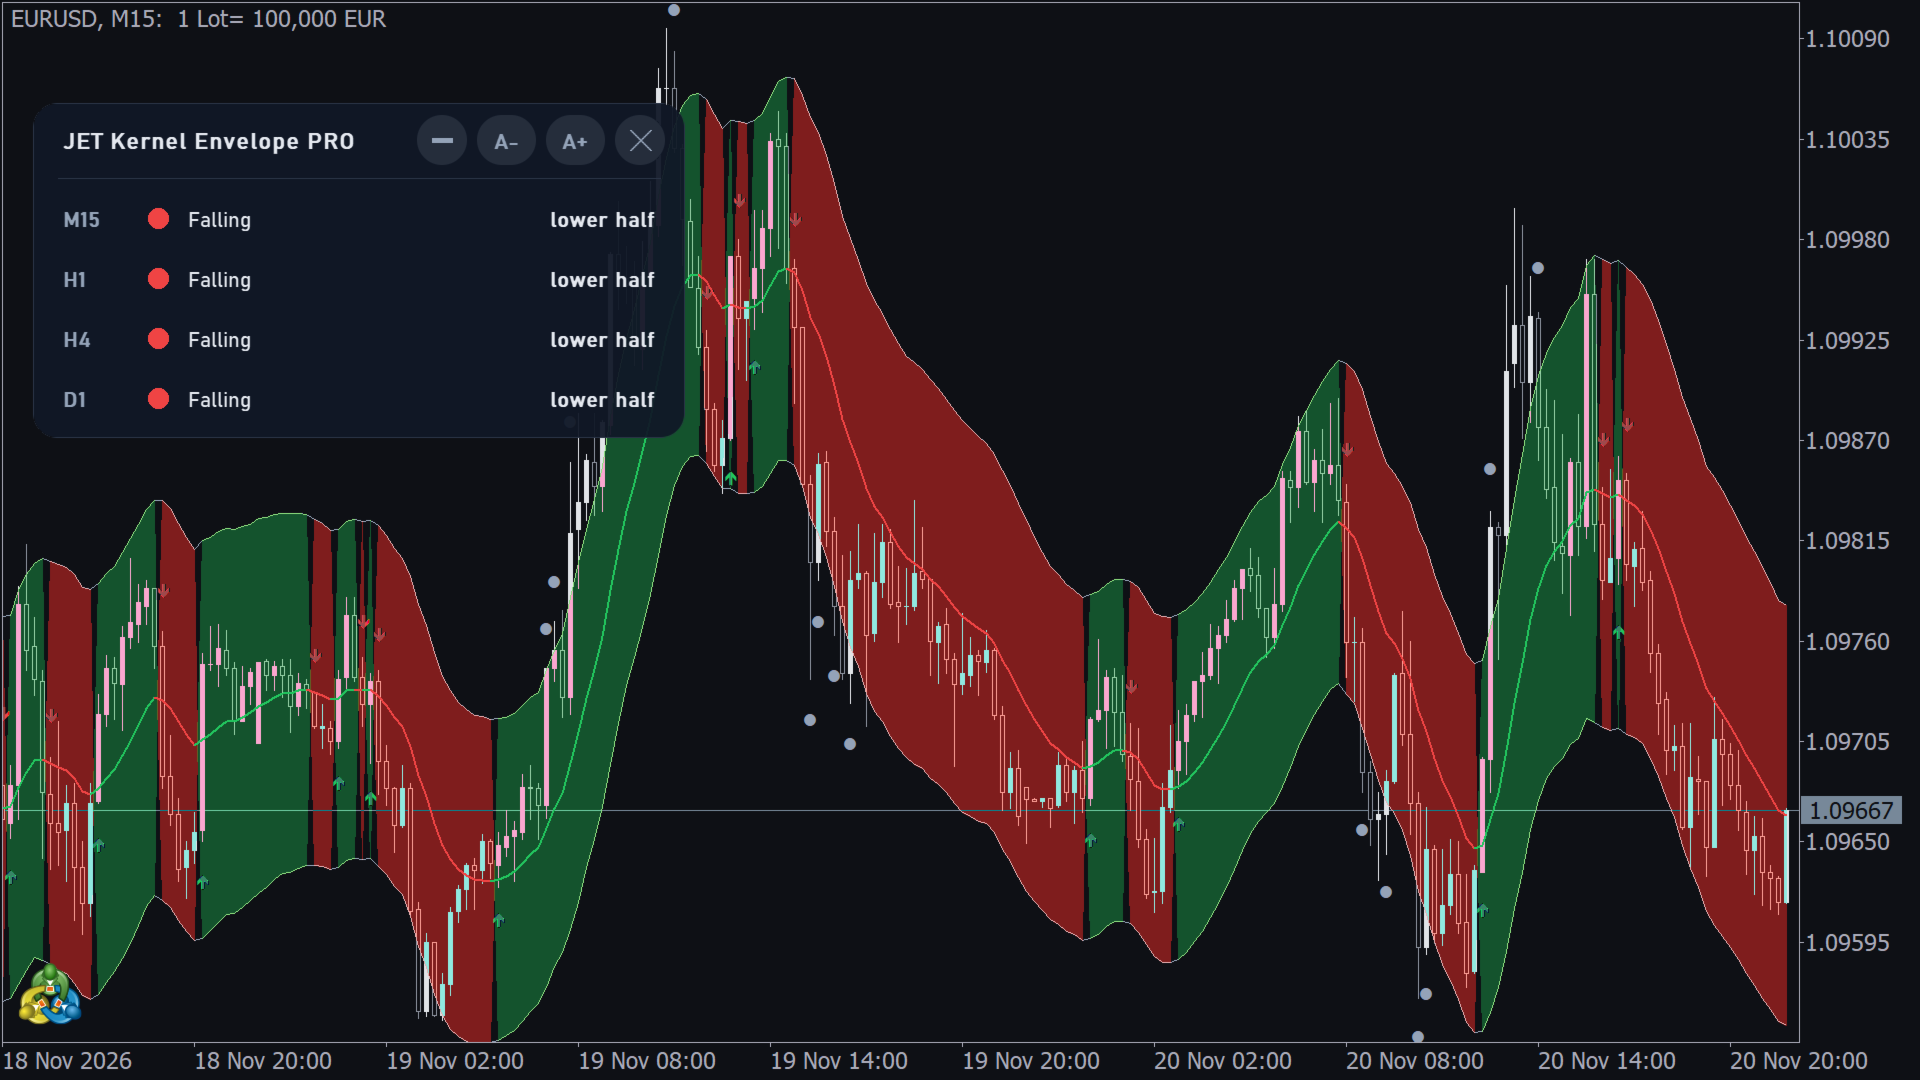
- Four timeframes (M15, H1, H4 and D1 by default; inputs Panel timeframe 1 to Panel timeframe 4). Each row shows the timeframe, a dot in the color of the line, "Rising" or "Falling", and where the close is: "above the envelope", "upper half" (between the line and the upper edge), "lower half" (between the line and the lower edge) or "below the envelope". The values come from the last closed bar of each timeframe and are refreshed every few seconds.
- Right after the indicator is attached, a row may show "Loading..." for a few seconds while the terminal prepares that timeframe. If the terminal does not have enough history for it, the row shows "No history" with the bars available / needed (N/M b) instead of waiting without end.
- When the calculation uses a higher timeframe, the bottom line of the panel shows that timeframe.
- Title bar buttons: [–] collapses the panel to its title bar, [A-] / [A+] resize it from 60% to 200%, [X] removes the indicator with all its objects. The size and the collapsed state are saved for each chart. The panel can be dragged and always stays whole inside the chart.
- Inputs of the Panel group: Show the panel, Theme (Dark by default, Light or Automatic (chart background)), Panel size (60-200 %) and Language (Terminal language by default, or one of the 11 languages).
Programmatic use (PRO)
The last group of inputs, PROGRAMMATIC USE, is meant for Experts and dashboards that read the indicator through iCustom, often on many symbols at once. With the default values, everything is drawn and calculated as usual.
- Draw graphics (true by default): with false, nothing is drawn on the chart (line, envelope, fill, arrows, marks and panel). The data for Experts and the alerts stay the same.
- Max bars to draw (0 = all): arrows, marks and the fill only on the last N bars. The data for Experts does not change.
- Max bars to calculate (0 = all): the calculation covers only the last N bars; before them the buffers are empty.
- These inputs are at the end of the list, so the positions of the other inputs in an iCustom call do not change. Each input group also counts as one position in iCustom.
Works on any symbol and timeframe
- Forex, indices, stocks, metals, crypto and futures (for example the B3 mini index or CME index futures), with any broker.
- Any chart timeframe; the panel timeframes are independent of the chart.
Download
- JET Kernel Envelope — free line and envelope.
- JET Kernel Envelope PRO — all the features above.
Questions and suggestions: send me a private message through my MQL5 profile.