Fractals Higher Timeframe

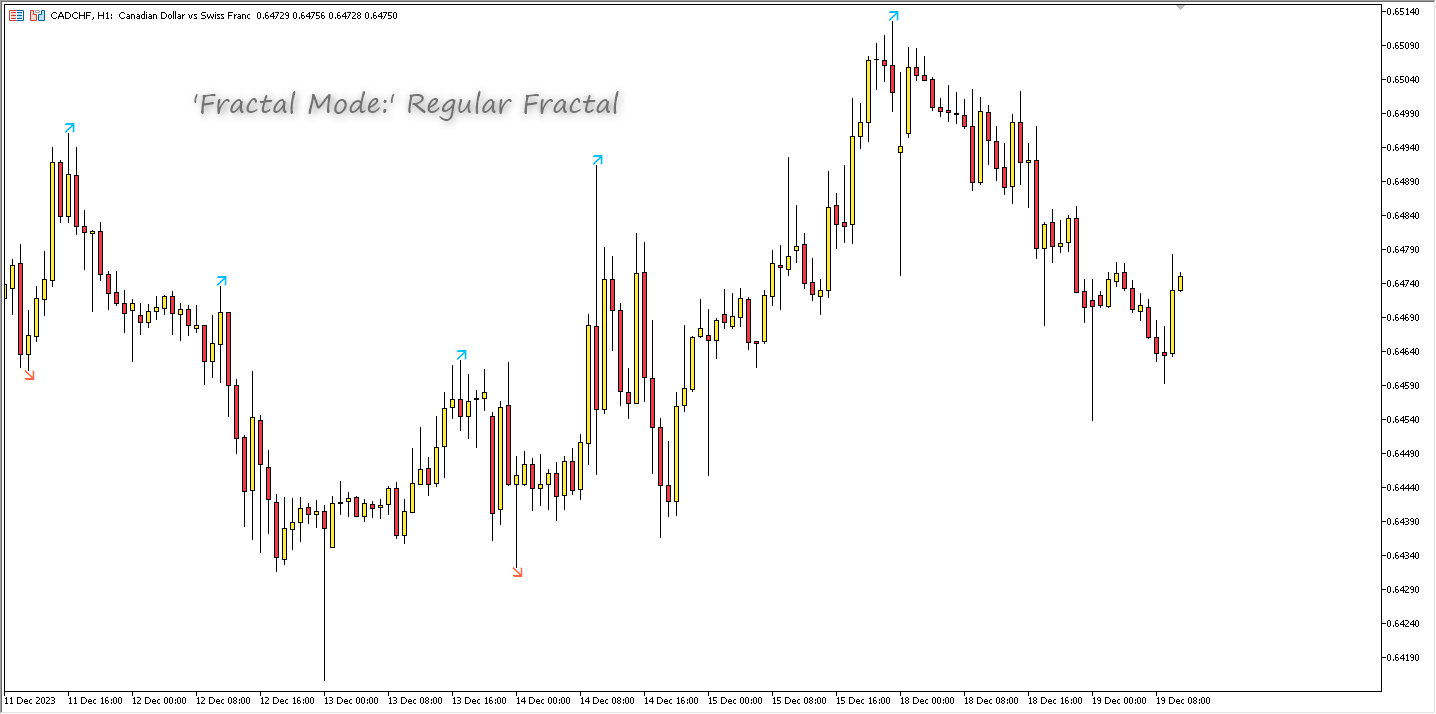
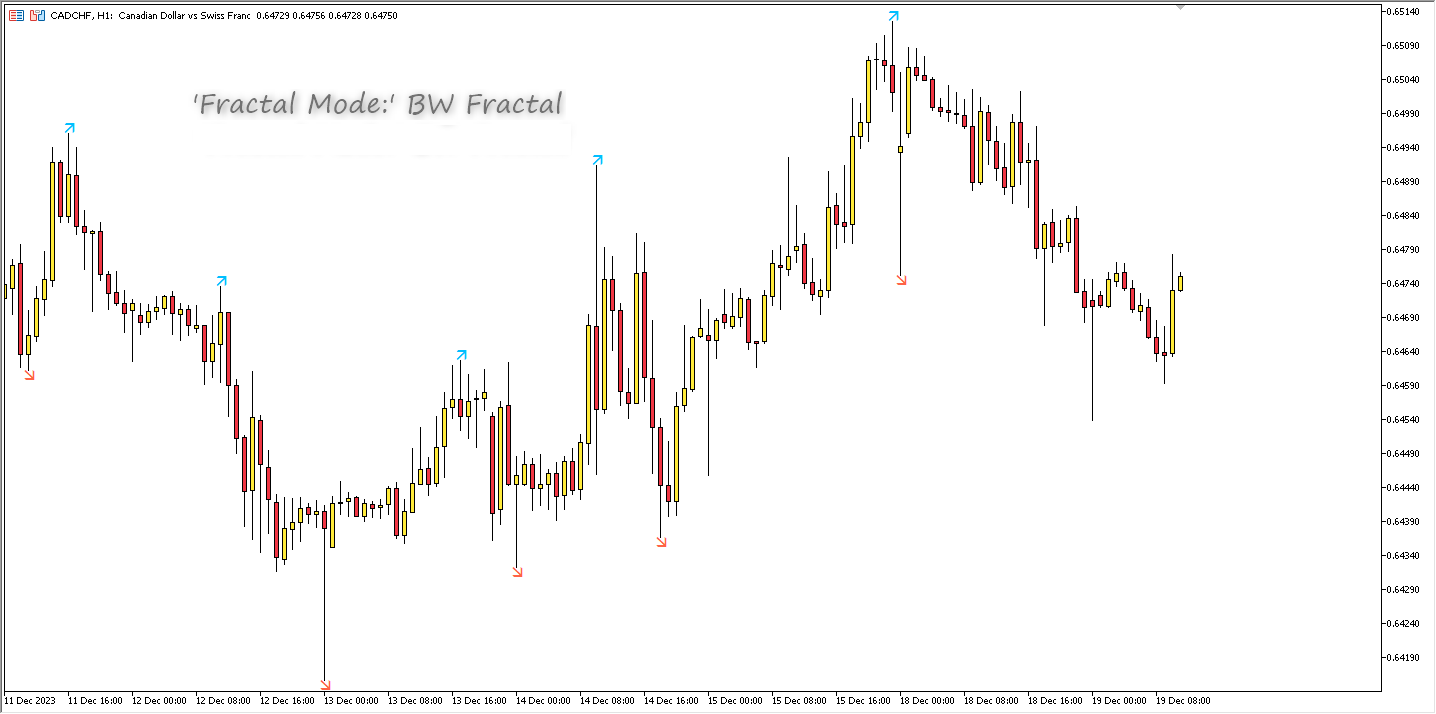
The indicator shows Fractals from the higher timeframe. It is possible to display two types of Fractals: 'Regular Fractal' and 'BW Fractal'.
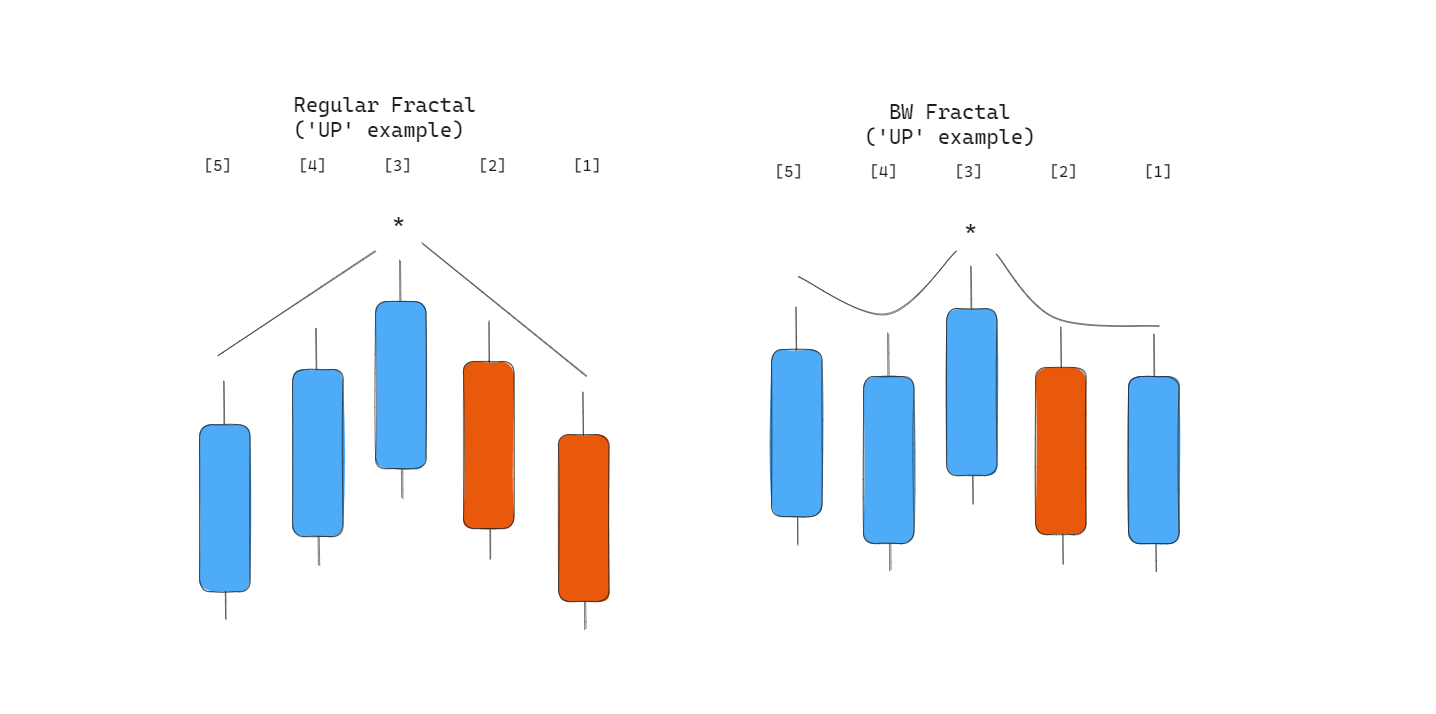
Consider the formation of the Fractal 'UP'.
'Regular Fractal' is a very strict Fractal in which each subsequent 'high' price (to the left and right of the central bar) is smaller. Whereas in 'BW Fractal' there is only one condition: the central bar (its price 'high') must be the highest. Visually, the difference between these two modes can be seen in diagram 1.
The 'Higher Timeframe' parameter must be greater than the current one, if this requirement is not met, there will be an Alert with a description of the error and the indicator will not work. Also, for the sake of optimization, the search is conducted only on the new bar.
I also can't ignore the 'Force download history' option - this option works well on weekends: it forcefully downloads high timeframe history.
Рекомендуем также
Price Magnet — Индикатор зон плотности цены и уровней притяжения Price Magnet — это профессиональный аналитический инструмент, который определяет ключевые уровни поддержки и сопротивления на основе статистической плотности распределения цены (Price Density). Индикатор анализирует заданный исторический период и находит ценовые значения, на которых рынок находился дольше всего. Эти зоны выступают в роли «магнитов» — они притягивают цену или служат фундаментом для разворота. В отличие от стандартны
Universal Soul Reaper is an atmospheric market-flow oscillator designed to interpret price behavior as a cycle of spiritual energy. Instead of reacting to raw price alone, it visualizes the state of the market’s soul —revealing when momentum is awakening, stabilizing, or fading. The indicator operates in a separate window and presents three interwoven entities: the Ectoplasmic Veil , the Spirit Boundary , and the Soul Core . Together, they form a living framework that helps traders sense pressu
Trend Channel это трендовый стрелочный индикатор форекс для определения потенциальный точек входа. Нравится он, прежде всего, тем, что в нём заложен простой механизм работы, адаптация ко всем временным периодам и торговым тактикам. Создан на основе канала регрессии с фильрами. Отображаем сигналы индикатора Trend Channel на графике функции цены используя математический подход.  Принцип работы - при пробитии цены в зоне перекупленности/перепроданности (уровней канала) генерируется сигнал на поку
Noize Absorption Index - is the manual trading system that measures the difference of pressure between bears forces and bulls forces. Green line - is a noize free index that showing curent situation. Zero value of index shows totally choppy/flat market.Values above zero level shows how powerfull bullish wave is and values below zero measures bearish forces.Up arrow appears on bearish market when it's ready to reverse, dn arrow appears on weak bullish market, as a result of reverse expectation.
Do you, like me, like to trade with the trend? Then this indicator will help you! Rainbow Trend is a trend indicator, which uses several Moving Averages on the chart. It measures different trend strenght zones for different periods: very long term, long term, mid term, short term and very short term. Each zone has its color, and it is possible to have sound alert when the prices leaves a zone and enters another. Its configuration is very simple. If you find any bug or have any suggestions, conta
Auto Optimized RSI   — это умный и простой в использовании стрелочный индикатор, созданный для точной торговли. Он автоматически определяет наиболее эффективные уровни покупки и продажи по RSI для выбранного символа и таймфрейма, используя симуляции на основе исторических данных. Индикатор может использоваться как самостоятельная торговая система, так и как часть вашей существующей стратегии. Особенно полезен для внутридневной торговли. В отличие от классических индикаторов RSI, которые использу
RBreaker Gold Indicators — это краткосрочная внутридневная торговая стратегия для фьючерсов на золото, которая сочетает в себе два подхода: трендовое следование и внутридневные развороты. Она позволяет не только получать прибыль при трендовом движении, но и своевременно фиксировать прибыль при развороте рынка, открывая позиции в новом направлении. Данная стратегия на протяжении 15 лет подряд входила в десятку самых прибыльных торговых стратегий по версии американского журнала Futures Truth. Она
The   Trendlines Oscillator   helps traders identify trends and momentum based on the normalized distances between the current price and the most recently detected bullish and bearish trend lines. The indicator features bullish and bearish momentum, a signal line with crossings, and multiple smoothing options. USAGE The   Trendlines Oscillator   works by systematically: Identifying pivot highs and lows. Connecting pivots to form bullish (support) and bearish (resistance) trendlines. Measuring
Features All Ichimoku Signals (Selectable) : Display all reliable signals generated by the Ichimoku indicator. You can choose which signals to view based on your preferences. Filter by Signal Strength : Sort signals by their strength—whether they are weak, neutral, or strong. Live Notifications : Receive real-time notifications for Ichimoku signals. Transparent Cloud : Visualize the Ichimoku cloud in a transparent manner. Available Signals Tenkensen-Kijunsen Cross Price-Kijunsen Cross Price-C
Индикатор Crypto_Forex "Молот и падающая звезда" для MT5. Не перерисовывается, не имеет задержек. - Индикатор "Молот и падающая звезда" — очень мощный индикатор для торговли по Price Action. - Индикатор распознаёт бычий "Молот" и медвежий "Падающая звезда" на графике: - Бычий молот — сигнал в виде синей стрелки на графике (см. изображения). - Медвежий "Падающая звезда" — сигнал в виде красной стрелки на графике (см. изображения). - С оповещениями на ПК, мобильном телефоне и электронной почте.
Это, пожалуй, самый полный индикатор автоматического распознавания гармонического ценообразования, который вы можете найти для платформы MetaTrader. Он обнаруживает 19 различных паттернов, воспринимает проекции Фибоначчи так же серьезно, как и вы, отображает зону потенциального разворота (PRZ) и находит подходящие уровни стоп-лосс и тейк-профит. [ Руководство по установке | Руководство по обновлению | Устранение неполадок | FAQ | Все продукты ] Он обнаруживает 19 различных гармонических ценов
FTU Fibonacci Retrace Этот индикатор рисует уровни Фибоначчи для систем входа на основе коррекции. Улучшенная и более точная версия, чем mt4. Изучайте движение цены и используйте стратегию коррекции для входа на уровнях Фибоначчи или вблизи них. Характеристики: Настройка нескольких уровней Фибоначчи. Изменение цвета и количества баров из диапазона. Применение: Цель — изучение или измерение коррекции цены. Изменение цвета и количества баров из диапазона. Подходит для любого таймфрейма, продукта/п
KDJ Index 4   交易实用必备工具指标 波浪自动计算指标,通道趋势交易 完美的趋势-波浪自动计算通道计算 , MT4版本 完美的趋势-波浪自动计算通道计算 , MT5版本 本地跟单复制交易 Easy And Fast Copy , MT4版本 Easy And Fast Copy , MT5版本 本地跟单复制交易 模拟试用 Easy And Fast Copy , MT4 模拟账号运行 Easy And Fast Copy , MT5 模拟账号运行 "Cooperative QQ:556024  "  "Cooperation wechat:556024"  "Cooperative email:556024@qq.com" 强烈推荐趋势指标, 波浪的标准自动计算   和   波浪的标准自动计算MT5版本     KDJ指标又叫 随机指标 ,是一种相当新颖、实用的技术分析指标,它起先用于期货市场的分析,后被广泛用于股市的中短期趋势分析,是期货和股票市场上最常用的技术分析工具。 随机指标KDJ一般是用于股票分析的统计体系,根据统计学原理,通过一个特定的周期(常为9日、9周等)
Усовершенствованная Мультитаймфреймовая версия скользящей средней Хала (Hull Moving Average - HMA). Особенности Две линии индикатора Халла разных таймфреймов на одном графике. Линия HMA старшего таймфрейма определяет тренд, а линия HMA текущего таймфрейма - краткосрочные ценовые движения. Графическая панель с данными индикатора HMA на всех таймфреймах одновременно. Если на каком-либо таймфрейме HMA переключил свое направление, на панели отображается вопросительный или восклицательный знак с текс
Индикатор для точного определения точек разворота цены на всех таймфреймах и всех валютных парах. С помощью технического анализа рынка и математических моделей диагностирования, данный индикатор с большой эффективностью определяет точки разворота цены и текущее направление тренда. Данную информацию индикатор отображает на графике в виде стрелок и линий. Стрелки показывают точки разворота тренда, а линии показывают текущее направление тренда. Этот индикатор можно интегрировать в уже существующие
Индикатор SMC Venom Model BPR — профессиональный инструмент для трейдеров, работающих в рамках концепции Smart Money (SMC). Он автоматически идентифицирует на графике цены два ключевых паттерна:  FVG   (Fair Value Gap) — комбинация их трёх свечей, в которой имеется разрыв между первой и третьей свечой. Формирует зону между уровнями, где отсутствует поддержка объемов, что часто приводит к коррекции цены. BPR   (Balanced Price Range)— комбинация двух FVG-паттернов, образующих «мост»  — зону пробо
Madx Cobra   Madx Cobra Indicator. Create to traders both experienced and inexperienced to use it because it is a basic indicator How to use : Setting Indicator 1. MA Fast  : Moving Average fast (10) 2. MA Slow :  Moving Average Slow control trend markets.(200) 3. ADX : Control trend(5) 4. For alert you can set to alert Next bar or instant bars.  When arrow sky blue show or arrow up, you can entry order "Buy" or "Long" and arrow red show or arrow down, you can entry order "Sell" or "Short" S
Premium level - это уникальный индикатор с точностью правильных прогнозов  более 80%!  Данный индикатор тестировался более двух месяцев лучшими Специалистами в области Трейдинга!  Индикатор авторский такого вы больше не где не найдете!  По скриншотах можете сами увидеть точностью данного инструмента!  1 отлично подходит для торговли бинарными опционами со временем экспирации на 1 свечу. 2 работает на всех валютных парах, акциях, сырье, криптовалютах Инструкция: Как только появляется красная стре
Индикатор Crypto_Forex "PINBAR Pattern" для MT5, без перерисовки и задержек. - Индикатор "PINBAR Pattern" — очень мощный индикатор для торговли по Price Action. - Индикатор распознаёт пин-бары на графике: - Бычий пин-бар — сигнал в виде синей стрелки на графике (см. изображения). - Медвежий пин-бар — сигнал в виде красной стрелки на графике (см. изображения). -   С оповещениями для ПК и мобильных устройств. - Индикатор "PINBAR Pattern" отлично сочетается с уровнями поддержки/сопротивления. На
Description : Rainbow EA MT5 is a simple Expert advisor based on   Rainbow MT5 indicator witch is based on Moving average with period 34. The indicator is incorporated in the EA, therefore, it is not required for the EA to operate, but if you wish, you can download it from   my product page . The Expert Advisor settings are as follows : Suitable for Timeframes up to H1 The parameters below can be set according to your trading rules. StopLoss ( Stop Loss in pips) TakeProfit ( Take Profit in pips
MT4 Version Wave Trend MT5 Wave Trend is an oscillator, which helps identifing in a extremely accurate manner market reversals. The Oscillator being obove the overbought level and a cross down of the fast into the slow MA usually indicates a good SELL signal. If the oscillators is below the oversold level and the fast MA crosses over the slower MA usually highlights a good BUY signal. The Wave Trend indicator can be also used when divergences appear against the price, indicating the current move
The RSI Divergence + FVG Signal indicator combines Relative Strength Index (RSI) Divergence with Fair Value Gap (FVG) detection to generate high-probability buy and sell signals based on both momentum shifts and institutional imbalance zones. Core Features: RSI Divergence Detection : Identifies both regular and hidden bullish/bearish divergences between price and RSI. Divergences indicate potential trend reversals or continuation. FVG Zone Recognition : Detects Fair Value Gaps (imbalances caused
Caicai L&S Yield Histogram Important Notice: This indicator is an integral tool of the automated EA Caicai Long and Short Pair Trading . This indicator visually displays the percentage deviation (Yield %) of a pair's current spread relative to its own historical mean. It is an excellent tool for quickly visualizing the gross financial potential of a market distortion in Long & Short operations. Main Features: Percentage Visualization: Understand the size of the distortion in palpable percentage
Separating Lines Trading System for MetaTrader 5 Separating Lines Trading System is a price action indicator for MT5 designed to detect 2-bar continuation patterns where both candles share the same opening level and the second candle resumes the prevailing trend. A detailed user guide is available on the author’s MQL5 Blog . Additional updates are available through the author’s   MQL5 Channel . Depending on the current support policy, buyers may receive additional access to selected companion t
Индикатор Crypto_Forex "Двойная падающая звезда" для MT5, без перерисовки и задержек. - Индикатор "Двойная падающая звезда" — очень мощный индикатор для торговли по Price Action. - Индикатор распознаёт редкую, но эффективную модель: медвежью "Двойную падающую звезду" на графике: - Медвежья "Двойная падающая звезда" - Сигнал в виде красной стрелки на графике (см. изображения). - Имеет встроенные оповещения для ПК и мобильных устройств. - Индикатор "Двойная падающая звезда" отлично сочетается с
CosmiCLab SMC FIBO CosmiCLab SMC FIBO — это профессиональный торговый индикатор, основанный на концепциях Smart Money Concepts (SMC), анализе структуры рынка и уровнях Fibonacci. Индикатор автоматически определяет свинги рынка и строит уровни Fibonacci по последнему импульсному движению. Также индикатор определяет ключевые изменения структуры рынка: BOS — Break Of Structure CHOCH — Change Of Character Дополнительно отображаются сигнальные стрелки BUY / SELL при пробое структуры. Индикатор подход
Ichimoku Aiko MTF
Michael Jonah Randriamampionontsoa
Ichimoku Aiko MTF is a collection of technical indicators that show support and resistance levels, as well as momentum and trend direction. It is a multi-timeframe indicator so you don't need to change the chart timeframe when you want to see the ichimoku clouds on a higher timeframe.  eg. The chart timeframe is M15 and you want to see on the M15 timeframe chart the H1 ichimoku indicators (the ichimoku in Metatrader can't do that) that's why you need to use Ichimoku Aiko MTF.
Introducing   Order Blocks Breaker , a brand-new way to identify and leverage order blocks in your trading strategy. After developing multiple order block tools with unique concepts, I’m proud to present this tool that takes things to the next level. Unlike previous tools,   Order Blocks Breaker   not only identifies order blocks but also highlights   Breaker Order Blocks —key areas where the price is likely to retest after a breakout. MT4 -  https://www.mql5.com/en/market/product/124101/ This t
Chỉ báo này sẽ thông báo cho bạn nếu cấu hình xu hướng thành công. Tín hiệu theo xu hướng không nên được tăng theo, nhưng tín hiệu mua ở mức giá thấp theo mô hình giao dịch thông thường của bạn, hoặc tín hiệu bán ở mức giá tốt, là một lựa chọn rất tốt. Hãy thiết lập nó trên khung thời gian lớn hơn và theo dõi các khung thời gian nhỏ hơn, bám sát các xu hướng chính. Tôi thường thiết lập ba khung thời gian gần nhau nhất và không bao giờ đi ngược tín hiệu của INdicator này. INdicator   này không có
Trend Monitor MT5
Pavel Zamoshnikov
4.5 (2)
Индикатор дает ранние сигналы при смене тренда, основываясь на показаниях ADX в комбинации с элементами ценовых паттернов. Работает на любых инструментах и таймфреймах. Индикатор не перерисовывает свои сигналы. Вы видите на истории ту же картину, которая была в реал-тайм. Сигналы отображаются стрелками для удобства восприятия (чтобы не загромождать график). Особенности Наилучшие результаты получаются, если использовать индикатор на двух таймфреймах, например: M30 - индикатор показывает основную
С этим продуктом покупают
SuperScalp Pro
Van Minh Nguyen
4.53 (19)
SuperScalp Pro – Продвинутая система скальпингового индикатора с множеством фильтров SuperScalp Pro — это продвинутая система скальпингового индикатора, объединяющая классический Supertrend и множество интеллектуальных подтверждающих фильтров. Индикатор эффективно работает на всех таймфреймах от M1 до H4 и особенно подходит для XAUUSD, BTCUSD и основных валютных пар. Может использоваться как самостоятельная система или гибко интегрироваться в существующие торговые стратегии. Индикатор включает б
Entry In The Zone and SMC Multi Timeframe is a real-time 2-in-1 market analysis tool that combines market structure analysis and a No Repaint BUY / SELL signal system into a single indicator, built on Smart Money Concepts (SMC) — a widely adopted framework used by professional traders to understand market structure. This indicator helps you see the market more clearly, make decisions based on structure rather than guesswork, and focus on high-probability zones where price is more likely to react
Azimuth Pro
Ottaviano De Cicco
5 (6)
Azimuth Pro V2: Синтетический фрактальный структурный анализ и подтверждённые входы для MT5 Обзор Azimuth Pro — многоуровневый индикатор свинговой структуры от Merkava Labs . Четыре вложенных уровня свингов, привязанный к свингам VWAP, определение ABC-паттернов, трёхтаймфреймная структурная фильтрация и подтверждённые входы на закрытой свече — один график, один рабочий процесс от микро-свингов до макро-циклов. Это не слепой сигнальный продукт. Это рабочий процесс, основанный на структуре, для т
Каждый покупатель этого индикатора получает дополнительно Бесплатно: Авторскую утилиту "Bomber Utility", которая автоматически сопровождает каждю торговую операцию, устанавливает уровни Стоп Лосс и Тейк профит и закрывает сделки согласно правилам этой стратегии, Сет-файлы для настройки этого индикатора на различных активах, Сет-файлы для настройки Bomber Utility в режимы: "Минимум Риска", "Взвешенный Риск" и "Стратегия Выжидания", Пошаговый видео-мануал, который поможет вам быстро установить, на
Power Candles – Входные сигналы на основе силы для любого рынка Power Candles переносит проверенный анализ силы Stein Investments прямо на ценовой график. Вместо реакции только на цену каждая свеча окрашивается на основе реальной рыночной силы, позволяя мгновенно распознавать накопление импульса, ускорение силы и четкие смены тренда. Одна логика для всех рынков Power Candles автоматически работает со всеми торговыми инструментами . Индикатор определяет, является ли текущий символ валютной парой
OmniSync Projection
Antonio-alin Teculescu
5 (1)
Chronos Fractal Engine is an innovative price projection indicator for MetaTrader 5, designed to transform your technical analysis by intelligently identifying and projecting historical price patterns. Built upon an advanced correlation algorithm and the fractal principles of the market, this powerful tool visualizes potential future price movements, giving you a unique edge in your trading decisions. What is Chronos Fractal Engine? At its core, the Chronos Fractal Engine employs a sophisticat
Если вы покупаете этот индикатор, вы получите мой профессиональный Trade Manager + EA БЕСПЛАТНО. Прежде всего стоит подчеркнуть, что эта торговая система является индикатором без перерисовки, без повторной отрисовки и без задержки, что делает ее идеальной как для ручной, так и для роботизированной торговли. Онлайн курс, руководство и загрузка пресетов. «Smart Trend Trading System MT5» - это комплексное торговое решение, созданное для новичков и опытных трейдеров. Он объединяет более 10 премиаль
Раскройте силу торговли трендами с помощью индикатора Trend Screener: вашего идеального решения для торговли трендами, основанного на нечеткой логике и мультивалютной системе! Повысьте уровень своей торговли по тренду с помощью Trend Screener, революционного индикатора тренда, основанного на нечеткой логике. Это мощный индикатор отслеживания тренда, который сочетает в себе более 13 инструментов и функций премиум-класса и 3 торговые стратегии, что делает его универсальным выбором для превращения
Meridian Pro
Ottaviano De Cicco
5 (1)
Meridian Pro: Профессиональная мульти-таймфрейм матрица трендов для MT5 Обзор Meridian Pro — это мульти-таймфрейм матрица трендов от Merkava Labs , которая сжимает направление, силу, состояние импульса и согласованность матрицы в одну компактную панель. Один адаптивный движок, последовательно применяемый от M1 до W1. Без настройки под отдельные символы. Без нагромождения индикаторов. Одна структурированная оценка по всем активам и всем таймфреймам. Акция запуска — получите Meridian Pro за USD 99
Quantum TrendPulse
Bogdan Ion Puscasu
5 (22)
Представляем   Quantum TrendPulse   , совершенный торговый инструмент, который объединяет мощь   SuperTrend   ,   RSI   и   Stochastic   в один комплексный индикатор, чтобы максимизировать ваш торговый потенциал. Разработанный для трейдеров, которые ищут точность и эффективность, этот индикатор помогает вам уверенно определять рыночные тренды, сдвиги импульса и оптимальные точки входа и выхода. Основные характеристики: Интеграция SuperTrend:   легко следуйте преобладающим рыночным тенденциям и п
Gann Made Easy   - это профессиональная, но при этом очень простая в применении Форекс система, основанная на лучших принципах торговли по методам господина У.Д. Ганна. Индикатор дает точные BUY/SELL сигналы, включающие в себя уровни Stop Loss и Take Profit. ПОЖАЛУЙСТА, СВЯЖИТЕСЬ СО МНОЙ ПОСЛЕ ПОКУПКИ, ЧТОБЫ ПОЛУЧИТЬ ТОРГОВЫЕ ИНСТРУКЦИИ И ОТЛИЧНЫЕ ДОПОЛНИТЕЛЬНЫЕ ИНДИКАТОРЫ БЕСПЛАТНО! Вероятно вы уже не раз слышали о торговли по методам Ганна. Как правило теория Ганна отпугивает от себя не только
Btmm state engine pro
Garry James Goodchild
5 (3)
BTMM State Engine Pro is a MetaTrader 5 indicator for traders who use the Beat The Market Maker approach: Asian session context, kill zone timing, level progression, peak formation detection, and a multi-pair scanner from a single chart. It combines cycle state logic with a built-in scanner dashboard so you do not need the same tool on many charts at once. What it does Draws the Asian session range; session times can follow broker server offset or be set in inputs. Tracks level progression (L
FX Trend NG: Следующее поколение интеллектуального анализа трендов на разных рынках Обзор FX Trend NG — это профессиональный инструмент анализа трендов и мониторинга рынка с поддержкой нескольких таймфреймов. Он позволяет за секунды получить полное структурное понимание текущего состояния рынка. Вместо переключения между десятками графиков вы мгновенно видите, какие инструменты находятся в тренде, где импульс ослабевает и где наблюдается сильная синхронизация между таймфреймами. Специальное пр
ARICoin is a powerful trading companion designed to generate high-probability entry signals with dynamic TP/SL/DP levels based on volatility. Built-in performance tracking shows win/loss stats, PP1/PP2 hits, and success rates all updated live. Key Features: Buy/Sell signals with adaptive volatility bands Real-time TP/SL/DP levels based on ATR Built-in MA Filter with optional ATR/StdDev volatility Performance stats panel (Success, Profit/Loss, PP1/PP2) Alerts via popup, sound, push, or email Cust
Crystal Heikin Ashi Signals - Professional Trend & Signal Detection Indicator Advanced Heikin Ashi Visualization with Intelligent Signal System for Manual & Automated Trading Final Price: $149 ---------> Price goes up $10 after every 10 sales . Limited slots available — act fast . Overview Crystal Heikin Ashi Signals is a professional-grade MetaTrader 5 indicator that combines pure Heikin Ashi candle visualization with an advanced momentum-shift detection system. Designed for both manual traders
Прежде всего стоит подчеркнуть, что этот Торговый Инструмент является Неперерисовывающимся Нерепейнтинговым Индикатором, что делает его идеальным для профессиональной торговли. Онлайн-курс, руководство пользователя и демонстрация. Индикатор Концепций Умного Действия Цены - очень мощный инструмент как для новичков, так и для опытных трейдеров. Он объединяет более 20 полезных индикаторов в одном, комбинируя передовые торговые идеи, такие как анализ Inner Circle Trader и стратегии торговли концеп
Индикатор Trend Ai - отличный инструмент, который улучшит анализ рынка трейдером, сочетая идентификацию тренда с точками входа и предупреждениями о развороте. Этот индикатор позволяет пользователям уверенно и точно ориентироваться в сложностях рынка Форекс Помимо первичных сигналов, индикатор Trend Ai определяет вторичные точки входа, возникающие во время откатов или коррекций, позволяя трейдерам извлекать выгоду из коррекции цены в рамках установленного тренда. Важные преимущества: · Работае
FX Power: Анализируйте силу валют для более эффективной торговли Обзор FX Power — это ваш незаменимый инструмент для понимания реальной силы валют и золота в любых рыночных условиях. Определяя сильные валюты для покупки и слабые для продажи, FX Power упрощает принятие торговых решений и выявляет высоковероятные возможности. Независимо от того, хотите ли вы следовать за трендами или предсказывать развороты с использованием экстремальных значений дельты, этот инструмент идеально адаптируется под
Узнайте, какая стратегия действительно работает на вашем инструменте - прежде чем рисковать реальными деньгами. Power Bar обнаруживает экстремальные ценовые бары на любом инструменте и любом таймфрейме, затем мгновенно тестирует 3 различные торговые стратегии, чтобы вы могли сравнить процент выигрышей, профит-факторы и прибыль/убыток. Все в одной интерактивной панели. Никаких догадок. Никакой подгонки. Только данные. Что делает Power Bar уникальным? Большинство индикаторов дают сигнал и оставля
Auto Optimized Parabolic RSI: Передовой 3D-движок импульса Большинство розничных индикаторов терпят неудачу, потому что они полагаются на статические входные параметры, которые ломаются, как только меняется волатильность рынка. Auto Optimized Parabolic RSI решает проблему «устаревания индикатора» путем непрерывного пересчета собственного математического преимущества, привнося количественную адаптацию институционального уровня прямо в ваш терминал MT5. Главное преимущество: Пользовательская 3D-оп
Bill Williams Advanced предназначен для автоматического анализа графика по системе " Profitunity " Билла Уильямса. Индикатор анализирует сразу четыре таймфрейма. Инструкция/Мануал ( Обязательно читайте перед приобретением ) Преимущества 1. Анализирует график по системе "Profitunity" Билла Уильямса. Сигналы помещает в таблицу в углу экрана и на график цены. 2. Находит все известные сигналы АО и АС, а также сигналы зон. Оснащён трендовым фильтром по Аллигатору. 3. Находит "Дивергентный бар", а та
Прежде всего стоит подчеркнуть, что этот торговый индикатор не перерисовывается, не перерисовывает и не отставает, что делает его идеальным как для ручной, так и для роботизированной торговли. Руководство пользователя: настройки, вводы и стратегия. Атомный аналитик - это индикатор ценового действия PA, который использует силу и импульс цены, чтобы найти лучший край на рынке. Оборудованный расширенными фильтрами, которые помогают убирать шумы и ложные сигналы, и повышают торговый потенциал. Испо
Smart Stop Indicator – Интеллектуальная точность стоп лоссов прямо на графике Обзор Smart Stop Indicator это специализированное решение для трейдеров, которые хотят устанавливать стоп лоссы чётко и методично, а не на интуитивной основе. Индикатор объединяет классическую логику прайс экшн (higher highs, lower lows) с современной системой распознавания пробоев, чтобы определить действительно логичный уровень стопа. В трендах, диапазонах или фазах резких движений он показывает оптимальные зоны SL
RelicusRoad Pro: Квантовая Рыночная Операционная Система СКИДКА 70% ПОЖИЗНЕННЫЙ ДОСТУП (ОГРАНИЧЕНО) - ПРИСОЕДИНЯЙТЕСЬ К 2000+ ТРЕЙДЕРАМ Почему большинство трейдеров теряют деньги даже с «идеальными» индикаторами? Потому что они торгуют Единичными Концепциями в вакууме. Сигнал без контекста — это лотерея. Чтобы выигрывать стабильно, вам нужна КОНФЛЮЭНЦИЯ . RelicusRoad Pro — это не простой стрелочный индикатор. Это полная Количественная Рыночная Экосистема . Она отображает «Дорогу Справедливой Сто
Berma Bands
Muhammad Elbermawi
5 (8)
Индикатор Berma Bands (BBs) является ценным инструментом для трейдеров, стремящихся определить и извлечь выгоду из рыночных тенденций. Анализируя взаимосвязь между ценой и BBs, трейдеры могут определить, находится ли рынок в фазе тренда или диапазона. Посетите [ Блог Berma Home ], чтобы узнать больше. Berma Bands состоят из трех отдельных линий: Upper Berma Band, Middle Berma Band и Lower Berma Band. Эти линии наносятся вокруг цены, создавая визуальное представление движения цены относительно об
ARIBot is a powerful trading companion designed to generate high-probability entry signals with dynamic TP/SL/DP levels based on volatility. Built-in performance tracking shows win/loss stats, PP1/PP2 hits, and success rates — all updated live. Key Features: Buy/Sell signals with adaptive volatility bands Real-time TP/SL/DP levels based on ATR Built-in MA Filter with optional ATR/StdDev volatility Performance stats panel (Success, Profit/Loss, PP1/PP2) Alerts via popup, sound, push, or email Cus
Этот индикатор является уникальным, качественным и доступным инструментом для торговли, включающим в себя наши собственные разработки и новую формулу. В обновленной версии появилась возможность отображать зоны двух таймфреймов. Это означает, что вам будут доступны зоны не только на старшем ТФ, а сразу с двух таймфреймов - таймфрейма графика и старшего: отображение вложенных зон. Обновление обязательно понравится всем трейдерам, торгующим по зонам спроса и предложения. Важная информация Для макс
ICT PO3 (Power of 3) AMD Protocol Framework Indicator True Time & Structure Integration   |  Non-Repainting | Real-Time  | Multi-Asset  | MT4 Version Available Full Setup Guide & Strategy Playbook: https://www.mql5.com/en/blogs/post/768683 MT4 Version: https://www.mql5.com/en/market/product/171742 Indicator Overview The ICT PO3 AMD Protocol Framework is a complete structural overlay for MetaTrader 5 that maps the True Daily Cycle directly onto your lower-timeframe execution chart. It projects
Trend Trading - это индикатор, предназначенный для получения максимальной прибыли от трендов, происходящих на рынке, путем определения времени отката и прорыва. Он находит торговые возможности, анализируя, что делает цена во время установленных тенденций. [ Руководство по установке | Руководство по обновлению | Устранение неполадок | FAQ | Все продукты ] Торгуйте на финансовых рынках с уверенностью и эффективностью Прибыль от устоявшихся тенденций без проволочек Признать прибыльные откаты, пр
Устали от построения линий поддержки и сопротивления? Сопротивление поддержки - это мульти-таймфреймовый индикатор, который автоматически обнаруживает и отображает линии поддержки и сопротивления на графике с очень интересным поворотом: поскольку ценовые уровни тестируются с течением времени и его важность возрастает, линии становятся более толстыми и темными. [ Руководство по установке | Руководство по обновлению | Устранение неполадок | FAQ | Все продукты ] Повысьте технический анализ в одноч
Другие продукты этого автора
Description   : The "Market Structure HH HL LH LL" indicator is a powerful and at the same time simple tool for analyzing price dynamics in financial markets. This indicator helps traders and investors identify changes in trends and identify important points in price time series. Displays "BOS" and "CHoCH" lines. Key components of the indicator: HH (Higher High): The top at which the price closes above the previous high top. HH indicates a strengthening uptrend. HL (Higher Low): The minimum
Three TimeFrames indicator-panel. The indicator is made in the form of a panel based on the CAppDialog class. The panel can be minimized or moved around the current chart using the mouse. The indicator shows three timeframes of the current symbol in the panel. In the current version, the indicator has a minimum number of settings - these are the parameters of three timeframes: "Younger timeframe", "   Middle   timeframe   " and "   Older   timeframe   ". When launched, the indicator-panel autom
The indicator shows bullish and bearish divergence. The indicator itself (like regular stochastic) is displayed in a subwindow. Graphical interface   : In the main window, graphical objects “trend line” are created - produced from the “Low” price to the “Low” price (for bullish divergence) and produced from the “High” price to the “High” price (for bearish divergence). The indicator draws in its window exclusively using graphic buffers: “Main”, “Signal”, “Dot”, “Buy” and “Sell”. The "Buy" and "
The indicator displays three lines and monitors two types of intersections. Three lines of the indicator: "   MA   " - slow indicator "Moving Average", "   DEMA Slow   " - slow indicator "   Double Exponential Moving Average" and "   DEMA Fast   " - fast indicator "Double Exponential Moving Average". Two types of intersections       : "   Alert Price MA   " - the price crosses the   "MA" line and   "   Alert DEMA DEMA   " - the lines cross       "DEMA Slow" and   "DEMA Fast   ". When crossing,
The Candle Length Indicator Alarm generates a sound alert, sends a push notification and an email when the size of the current candlestick changes. The size of the current candlestick can be measured in two ways: The first method: the size of the candlestick is measured from the beginning of the candlestick (from the OPEN price). The second method: the size of the candlestick is measured from current price. The indicator has the following settings: sound — a sound file from the folder: "...\Meta
The Buy Sell Color Background indicator changes the background color depending on position direction. It has three settings: Background color for BUY - background color for a Buy position Background color for SELL - background color for a Sell position Default background color - background color with no open position After you detach the indicator from a chart, its background color changes to Default background color .
Утилита "Калькулятор сигналов" работает прямо из терминала MetaTrader 5, и это большое преимущество, так как терминал осуществляет предварительный отбор и сортировку сигналов. Таким образом, пользователь видит в терминале MetaTrader 5 только сигналы с максимальной совместимостью с его торговым счётом. "Калькулятор сигналов" позволяет дать ответ на один из самых частых вопросов пользователей сервиса Сигналы: "Смогу ли я подписаться на сигнал NNN, и какой объём позиции будет копироваться на мой то
This indicator belongs to the "Stochastic" category. I tried to simplify the control of the indicator as much as possible, so the minimum settings are shown in the input parameters: this is the choice of an icon for the signal arrows. The "Buy" signal is encoded with the ' Buy Arrow code ' parameter, and the "Sell" signal is encoded with the ' Sell Arrow code ' parameter. Signal arrow codes for signals (please use values ​​from 32 to 255) are taken from the Wingdings font. The indicator works on
An Expert Advisor based on the custom indicator. Search for a signal at every tick. Positions are closed by an opposite signal. No trailing. There is no stop loss. There is no take profit. Has a minimum of settings Money management: Lot OR Risk   - type Money management The value for "Money management"   - Money management value Deviation   - admissible slippage Buy Arrow code   (font Wingdings) - character code from 'Wingdings' font for BUY signals Sell Arrow code   (font Wingdings) - characte
The trend indicator "   Super Trend Flexible Alert   " has a minimum of settings. This indicator is designed to be as easy to use as possible. The indicator shows the trend with a main colored line ("SuperTrend" line, which you can see in the "Data Windows" window). Also, in places where the trend changes, the indicator shows colored arrows (   "STBuy" and "   STSell" icons, which you can see in the "Data Windows" window       ). In places where the trend changes, the indicator doesn't give a s
This Expert Advisor belongs to the class of utilities for manual and semi-automatic trading. The "   Pending order at the extremums of the day   " EA places two pending orders at the extremums of the previous day. Parameter "   Pending Orders: ...       " allows you to select the type of pending orders: "   Buy Stop and Sell Stop   " or "   Buy Limit and Sell Limit   "   .       extremum       'Low' offset is made downwards). "   New pending -> delete previous ones   " set to "   true   " will f
The "Panel Partial Closure" utility-panel is intended for quick partial closing of a position that has a profit. It has only two parameters: "   Partial closure #1   " and "   Partial closure #2   ". Works for any symbol and for any 'Magic number' - that is, the utility is primarily intended for manual trading. How it works: For example, you have several positions on "EURUSD", "Jump 100 Index" and "XAUUSD" (gold). The utility finds the position with the largest profit - in the screenshot, this
The 'Supertrend MetaTrader 5' indicator is the basis of the simplest trend trading system. And yet it remains very effective. The indicator works on any timeframe (on the timeframe of the current chart). From the name you can see that this indicator follows the trend, and when the trend changes, the indicator accurately shows the point of the trend change. The basis of 'Supertrend MetaTrader 5' is comparing price and 'Average True Range indicator' values multiplied by a multiplier (there is als
MQL5 "Daily resistance and support" indicator - draws daily support and resistance lines. Drawing is carried out only with the help of graphical objects (trend lines) - indicator buffers are not used in this indicator. The indicator has no settings - the search for levels is carried out on the last 500 bars from the "D1" timeframe and this parameter is hardwired inside the code. Manual trading: When trading manually, this indicator is recommended to be used on timeframes from "M10" to "H1". It
Multi Symbol Trailing
Vladimir Karputov
5 (1)
The "   Multi Symbol Trailing   " utility moves Stop Loss for all positions that are currently open (multi-symbol trailing). It is intended primarily to assist in manual trading. There are no restrictions for the utility either by the name of the currency pair or by the individual identifier (Magic number) - the utility processes absolutely all positions that are currently open. The unit of measurement for the "   Trailing Stop   " and "   Trailing Step   " parameters is points (the difference
The trend indicator "Trend Two Moving Average" uses two types of Arrow to display calculation results - these are "Trend UP" and "Trend DN".       Arrows "Trend Up"       are drawn       By       price       'Low'       bar   ,       A       Arrows "Trend DN" -       By       price       'high'. The trend search algorithm is based on the analysis of the price of a bar and the values of two 'Moving Average' indicators. The trend direction is calculated on the current (zero) bar. Therefore, it is
The "   Market Session Times   " indicator shows the time of four trading sessions: Asia, Europe, America and Pacific. The time of trading sessions is set   in the format       GMT and thus does not depend on the trading server at all. The following data is used: Trading Session City GMT Asia Tokyo Singapore Shanghai 00:00−06:00 01:00−09:00 01:30−07:00 Europe London Frankfurt 07:00−15:30 07:00−15:30 America New York Chicago 13:30−20:00 13:30−20:00 Pacific Wellington Sydney 20:00−02:45 22:00−0
Trading system for a variety of trading transactions. Allows you to set the balance to wander around zero - used for specific rebate tasks or similar. Configured to work with hedging   accounts.   There cannot be more than one position in the market   . One general setting, the "   Step, Stop Loss, Take Profit   " parameter is measured in points (example for EURUSD: 1.00055-1.00045 = 10 points). The advisor stops trading (while remaining on the chart) if, when   placing a position, it encounters
AI Support Resistance This is an indicator that searches for the “Support” and “Resistance” lines. The search is carried out using an algorithm for numerical analysis and data processing. There are three search options available (“mode #1”, “mode #2” and “mode #3”). Each of these options differs in its internal algorithm (at the moment these are completely internal settings, they are not available to the user). We can say that these options differ in the severity of the search. Limitation: At t
The " Open Time Manager " utility opens a position at a specified time and then turns on classic trailing. Time (' Hour ':' Minute ') is always set in the GMT time zone with a GMT Ofset offset. It is possible to select three options for opening a position using the ' Trade mode ' parameter: ' BUY ' ' SELL ' ‘ BUY and SELL (simultaneously) ’ ‘ OFF (no trade, only trailing works) ’ The fourth parameter is used when you only need to enable trailing for your positions and not open new positions. St
The trend trading strategy "Super Trend Flexible Alert EA" is built on the indicator of the same name "Super Trend Flexible Alert". The advisor uses all the information from the indicator, so the advisor has only three parameters, these are: “Working timeframe” – specifies the working timeframe, the timeframe on which the indicator is created, and also from which the “OHLC” data is taken. "Stop Loss" is the constant size of the stop loss, measured in "points" (you can see an example of what "po
Indicator       shows "Support" and "Resistance" lines (these lines are drawn using the DRAW_LINE drawing style - that is, they are not graphic objects). A search for new minimums and maximums is performed to the left and right of the "signal bar" - the "signal bar" is the conventional middle of each new construction. Why is the word Flexible in the name of the indicator? Because we have the possibility to specify different number of bars to the left ('Left Bars') and to the right ('Right Bars'
The dashboard scans the readings of two indicators: 'MACD' and 'Stochastic'. Displays signals in three columns: for MACD, for Stochastic, and the resulting column (if the signal is the same for both indicators).  Scanning can be selected on one or more timeframes. If you disable all timeframes, the dashboard will still load, but with settings specifically for such cases. Signals are always checked for the zero bar (zero bar is the rightmost bar on the chart) of the indicator. Description of para
ATR Bands Alert is a channel indicator where the channel width is calculated as a constant multiplier ("Multiplier") and the value of the "Average True Range" indicator. Unlike Bollinger Bands, the bandwidth is not changed so often – in the ATR Bands Alert indicator, the bands often have long straight lines. The interpretation of the ATR Bands Alert is based on the fact that the price is inside the bands for most of the time, and if the price reaches one of the boundaries, it may indicate a tr
The Bollinger Bands Dashboard indicator offers a convenient and informative way to track Bollinger Bands indicator signals on different timeframes using one panel (Dashboard). This tool allows traders to quickly and easily obtain the information they need, enabling efficient decision-making in the market. Main characteristics: 1. **Signals Panel**: The Dashboard displays Bollinger Bands signals for selected timeframes, providing users with clear and structured information. 2. **Flexibility in
Introducing the utility "   VIRTUAL BREAKEVEN   !" "Current symbol" is the symbol of the chart on which the utility works. The utility keeps a count of all positions on the current symbol and ignores the "Magic number" of these positions. The utility works on the current symbol and tracks the Breakeven level in the deposit money. When the profit of all positions on the current symbol becomes >= «Breakeven» + «Breakeven Step» the utility will start tracking «       Breakeven       ". A common ex
Tensline
Vladimir Karputov
Простий, ефективний, прибутковий — експерт, який працює на вас Цей Expert Advisor створений для тих, хто цінує простоту та контроль . Мінімум налаштувань — максимум результату. Ви не витрачаєте час на складну оптимізацію: налаштування інтуїтивні, запуск — за лічені хвилини. Тільки одна позиція в ринку — жодного хаосу, жодних накладок. Без стоп-лоссів, тейк-профітів чи трейлінгу — повний контроль над логікою виходу. Гнучкий вибір стратегії — оберіть ту, що найкраще відповідає вашому
Фильтр:
Нет отзывов
Ответ на отзыв