Смотри обучающее видео по маркету на YouTube
Как купить торгового робота или индикатор
Запусти робота на
виртуальном хостинге
виртуальном хостинге
Протестируй индикатор/робота перед покупкой
Хочешь зарабатывать в Маркете?
Как подать продукт, чтобы его покупали
Технические индикаторы для MetaTrader 5 - 14
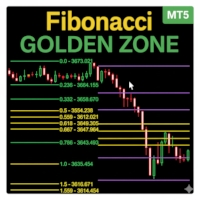
Индикатор Fibonacci Sessions — это мощный торговый инструмент, созданный для точного скальпинга и внутридневных стратегий. Он автоматически строит ключевые уровни Фибоначчи для сессий Нью-Йорка, Лондона и Азии, предоставляя трейдерам четкое представление о динамике цен на основных торговых сессиях. Уникальные "Золотые зоны" подсвечиваются в каждой сессии, где цена наиболее часто реагирует. Это формирует надежные области для разворотов, пробоев и торгов по тренду. Индикатор наглядно показывает, к
FREE
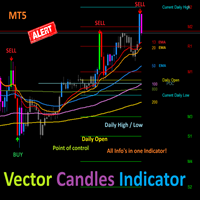
Vector Candles Indicator This is an easy and safe tool for MetaTrader 5 (MT5). It colors candles on your chart based on trading volume to spot trend changes.How to Spot Entry Signals Up Vector Candle: If a green candle with high volume closes (lime or blue color), sell. Price will likely drop back to where the candle started. Down Vector Candle: If a red candle with high volume closes (red or purple color), buy. Price will likely rise back to where the candle started. Detailed setup: Check http
FREE
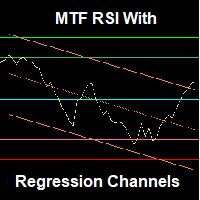
An advanced RSI indicator that displays dynamic linear regression channels in both the indicator window and the price chart, with predefined horizontal levels to detect overbought and oversold zones. Main Features (Summary): Synchronized linear regression channels on both price and RSI Multi–timeframe support Smart and ready-to-use horizontal levels Professional design with optimized performance Feedback & Support We value your experience! If you have any questions, suggestions, or encounter any
FREE
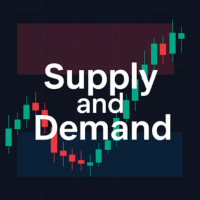
This indicator helps to draw supply and demand zones based on ICT's concepts. Traders can customize their Demand and Supply zones' color. By default, demand is red, supply is blue. The recommended way of trading by ICT is to buy in Demand Zone and sell in Supply Zone. Do keep in mind to consider multiple other confluences when trading. Do keep in mind that it is possible for supply and demand zones to overlap. In such instances, I would recommend to refrain from trading as this implies a lack of
FREE

Change in State Delivery (CiSD).
Overview: The Change in State delivery (CiSD) is a microstructure indicator that identifies critical pivotal points where the market (Price delivery Algorithm) shifts its directional focus from seeking liquidity on one side of the market to the other. Specifically, it signals a transition from buyside-driven liquidity to sellside-driven liquidity. CiSD marks the precise opening price that signals fundamental change in market structure and delivery direction.
FREE

If you like to use traditional Moving Averages (like SMAs and EMAs) to provide your trades for dynamic levels of Support and Resistance, you will love the Adaptive Moving Average (AMA). Created in 1995 by Perry Kaufman and presented to the world in his book " Smarter Trading : Improving Performance in Changing Markets ", the Adaptive Moving Average (also known as KAMA - Kaufman Adaptive Moving Average) has the goal to be the perfect companion for following a trend without noise, but s
FREE
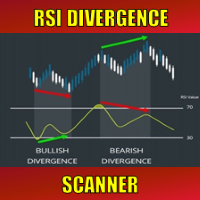
Special offer : ALL TOOLS , just $35 each! New tools will be $30 for the first week or the first 3 purchases ! Trading Tools Channel on MQL5 : Join my MQL5 channel to update the latest news from me На динамичных финансовых рынках выявление сигналов разворота тренда является необходимым для эффективной торговли. RSI Divergence Scanner предназначен для того, чтобы помочь вам точно и эффективно обнаруживать сигналы дивергенции RSI по различным валютным парам и временным интервалам. См
FREE

Это индикатор паттерна Квазимодо (Quasimodo), также известного как "Выше и ниже" (Over and Under). Индикатор автоматически находит точки колебаний (swing points) и даже может открывать виртуальные сделки с уровнями стоп-лосс и тейк-профит. Также он находит наиболее прибыльные настройки. Паттерн состоит из четырех отрезков (A, B, C, D), как показано на скриншотах. Параметры продукта описаны ниже. Buffer - расстояние в пипсах от линии поддержки или сопротивления (support or resistance, SR), на кот
FREE

50% off. Original price: $60 Support and Resistance zones indicator for MT5 is a multi-timeframe panel and alert that finds support and resistance zones and pivot points for all timeframes of MetaTrader 5 and gives alert when price has interaction with them. Download demo version (works on GBPUSD, EURJPY and NZDUSD symbols) Read the full description of scanner parameters in the blog page . Many unique features in one indicator: Integrating support and resistance zones and pivot points in one in

MT5 Session Indicator: Track Global Market Hours with Precision Boost your trading strategy with this FREE Session Indicator for MetaTrader 5 , designed to help you effortlessly identify active trading sessions across global markets. Perfect for forex, stocks, and commodities traders, this tool highlights key market hours (Asian, European, North American, and overlaps) directly on your chart, ensuring you never miss high-liquidity periods. Key Features:
Visual Session Overlays : Clear color-c
FREE
SMC Trend Momentum SMC Trend Momentum is a momentum oscillator displayed in a separate window. It combines Donchian position bias with ZigZag leg normalization into one adaptively smoothed signal. A color‑coded histogram with prewarn and warn states supports visual assessment of direction and momentum changes. Optional higher‑timeframe alignment (H1/H4) can be used as a filter. Features Combined bias oscillator (Donchian + ZigZag) Donchian position bias (distance from channel equilibrium) ZigZ

This is just a MACD with multi symbols, multi timeframes, and multi colors. features. different symbols and timeframes from the main chart. draw main line, signal line, and histogram. each line can be erased. the ascent and descent can be distinguished. Due to the above features, this MACD is suitable for multiple lineups in a single chart. This can be used in the same way as MiniCandles.
FREE

Bring the popular "Crosshair with Magnet Mode" functionality from modern charting platforms directly to your MetaTrader 5 terminal. Crosshair for MT5 is a precision utility tool designed for traders who demand accuracy. Unlike the standard MT5 crosshair, this smart tool automatically detects Open, High, Low, and Close prices on your candles. When your mouse hovers near a candle, the crosshair "snaps" to the nearest wick or body price, ensuring you are looking at the exact price level every tim
FREE
CandleStick Patterns Indicator for MT5 — Professional Pattern Scanner Bring proven candlestick analysis into your workflow. This indicator automatically scans your chart and highlights high-quality reversal and continuation patterns, so you can react faster and with more confidence. Check the “More from author” section on the Market page to see our full suite of indicators. What it does Scans historical and live candles from a user-defined lookback range.
Detects and labels major single- and m

ICT Unicorn Killer — Complete Liquidity Reversal Detector IMPORTANT: Use in combination with the Multi-Time-Frame 'Unicorn Hunter' (scanner) for a complete detect and kill system. https://www.mql5.com/en/market/product/153999
Unicorn Killer identifies high-probability smart-money reversal setups by combining five key technical confluences into one streamlined visual tool: Fractals → Liquidity Sweep → Break of Structure → Breaker Block → Fair Value Gap → VALID UNICORN! When a Valid Unicorn
FREE

Квантовый анализ волатильности и определение рыночных режимов Schrödinger Market Wells (SMW) предлагает альтернативный подход к традиционному техническому анализу. В отличие от стандартных полос волатильности (как Bollinger Bands), основанных исключительно на простых статистических отклонениях, SMW моделирует ценовое движение, используя принципы финансовой квантовой механики . Этот индикатор интерпретирует цену как частицу, взаимодействующую внутри «Потенциальной ямы» (Potential Well). Это позво

Календарь обратного отсчета новостей Phoenix (MT5)
Панель обратного отсчета экономических новостей в реальном времени для MetaTrader 5. Отображает предстоящие события с высоким уровнем влияния с точными таймерами обратного отсчета, чтобы помочь трейдерам управлять рисками, связанными с всплесками волатильности.
Назначение
Публикации экономических новостей создают неожиданную волатильность, проскальзывание и просадки. Слепая торговля во время событий с высоким уровнем влияния может мгновенно с
FREE
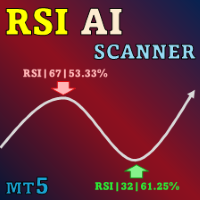
Special offer : ALL TOOLS , just $35 each! New tools will be $30 for the first week or the first 3 purchases ! Trading Tools Channel on MQL5 : Join my MQL5 channel to update the latest news from me Представляем революционный индикатор RSI Kernel Optimized with Scanner для MT5 — передовой инструмент, который переосмысливает традиционный анализ RSI, интегрируя мощный алгоритм оценки плотности ядра (KDE). Этот продвинутый индикатор не только предоставляет информацию о рыночных трендах

Introducing Volume Orderflow Profile , a versatile tool designed to help traders visualize and understand the dynamics of buying and selling pressure within a specified lookback period. Perfect for those looking to gain deeper insights into volume-based market behavior! MT4 Version - https://www.mql5.com/en/market/product/122656/ The indicator gathers data on high and low prices, along with buy and sell volumes, over a user-defined period. It calculates the maximum and minimum prices during t

If you have the opportunity to read the book " Trend Trading - A Seven-Step Approach to success " by Daryl Guppy, you will have a great deal of information about how to "read" the market. In his book Daryl show, among other things, how can we use a visual tool to measure the volatility and trend between Long and Short-term periods: The GMMA - Guppy Multiple Moving Averages .
Instead of using his original idea of having 12 Exponential Moving Averages in your chart - which could be very CPU-deman
FREE

HiLo Activator is a technical analysis indicator developed by Robert Krausz, a renowned hungarian trader with a career in the USA.
It is a trend indicator that helps you to predict the cange of the current trend. In an uptrend it is displayed at the bottom of the candles; in a downtrend it is displayed at the top.
Its only setting is the calculation period.
It is possible to have alerts when a new trend begin. Enjoy! This is a free indicator, but it took hours to develop. If you want to pay me a
FREE

The Top and Bottom Identifier Pro is the essential tool for traders who use technical analysis and price action as the basis for their decisions. In MetaTrader 5, understanding market structure—whether the price is making higher or lower highs and lower lows—is the first step to success. This indicator automates this process, eliminating subjectivity and allowing you to visualize price inflection points with immediate clarity.
FREE

The Supertrend indicator is a trend-following technical analysis tool designed to help traders identify the direction of market trends and potential entry/exit points. It operates based on price data and Average True Range (ATR) to create a dynamic signal line that changes color depending on the current trend. Green color: Indicates an uptrend. Red color: Indicates a downtrend. Supertrend is a useful indicator for both short-term and long-term trading, helping to filter out market noise and focu
FREE
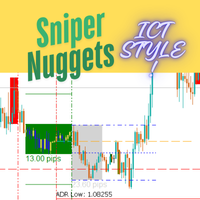
!!!!!!!! Sniper Nuggets !!!!!!!!
Sniper Nuggets is an all-in-one indicator for many things ICT style. It includes the following functionalities: Custom periods : which allow you to set custom daily period start and end times according to your taste. ADR Markers: which plots the average daily range. Worktime: which plots the various boxes on the chart for Asia range (including its high, low and midpoints, standard deviation predictions ), London open, New York open, CME open and London close.
FREE

The VWAP Session Bands indicator is a powerful tool designed for Meta Trader 5. This indicator calculates the Volume Weighted Average Price (VWAP) and its standard deviation bands within customizable daily sessions, offering traders a clear view of price trends and volatility. Unlike traditional VWAP indicators, it ensures smooth, continuous lines across session boundaries by using the previous candle's values for the current (incomplete) bar. Ideal for scalping or day trading on instruments lik
FREE

Triangle Pattern Gann v3.1 - Complete Feature Documentation Core Functionality OverviewTriangle Pattern Gann v3.1 is a sophisticated MetaTrader 5 indicator that combines W.D. Gann's geometric trading principles with advanced triangle pattern recognition to deliver actionable trading signals. Primary Features1. Triangle Pattern Detection SystemAscending Triangle Recognition
Function: Automatically identifies bullish continuation patterns Detection Criteria:
Flat horizontal resistance line
FREE

Shadow System Candles - AI Trend Visualization
Concept "Stop trading in the dark. Equip your chart with Night Vision."
Shadow System Candles is the visual core of the "Shadow Operation" project. It eliminates market noise and visualizes the true direction of the trend using AI-based logic (ADX + MA integration).
Note: This tool does not generate buy/sell arrows. It is designed to train your eyes to recognize "Active Trends" and "Dangerous Ranges.
Key Features ・AI Logic Coloring[/b]: Automat
FREE

PUMPING STATION – Ваша персональная стратегия "всё включено"
Представляем PUMPING STATION — революционный индикатор Forex, который превратит вашу торговлю в увлекательный и эффективный процесс! Это не просто помощник, а полноценная торговая система с мощными алгоритмами, которые помогут вам начать торговать более стабильно! При покупке этого продукта вы БЕСПЛАТНО получаете: Эксклюзивные Set-файлы: Для автоматической настройки и максимальной эффективности. Пошаговое видео-руководство: Научитесь т
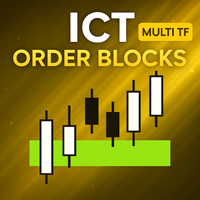
[ MT4 Version ] [ Kill Zones ] [ SMT Divergences ] How to trade using Order Blocks: Click here User Interface Performance: During testing in the strategy tester, the UI may experience lag. Rest assured, this issue is specific to the testing environment and does not affect the indicator's performance in live trading. Elevate your trading strategy with the Order Blocks ICT Multi TF indicator, a cutting-edge tool designed to enhance your trading decisions through advanced order block analysis

ZPOWER BUY & SELL INDICATOR
Trade Smarter. Trade Confidently. Trade Profitably.
Are you tired of second-guessing your trades? Do you enter late and exit too early — leaving money on the table? It’s time to upgrade your strategy with the ZPOWER BUY & SELL INDICATOR, built with institutional-grade logic that helps you catch high-probability trade setups with precision.
Why ZPOWER is Different
Unlike ordinary indicators that flood your charts with noise, ZPOWER is engineered with advanced
FREE

Market Structure Internal & External (CHoCH/BoS) Описание: Индикатор Market Structure Internal & External (CHoCH/BoS) — это мощный инструмент для анализа структуры рынка (Market Structure - MS) , который автоматически определяет и визуализирует ключевые точки разворота (свинги) и пробои структуры на двух различных временных масштабах/глубинах: Внутренней (Internal) и Внешней (External) . Он использует концепции Change of Character (CHoCH) и Break of Structure (BoS) из методологии Smart Money Con
FREE

The idea of a Value Chart indicator was presented in the very good book I read back in 2020 , " Dynamic Trading Indicators: Winning with Value Charts and Price Action Profile ", from the authors Mark Helweg and David Stendahl. The idea is simple and the result is pure genius: Present candlestick Price analysis in a detrended way!
HOW TO READ THIS INDICATOR
Look for Overbought and Oversold levels. Of course, you will need to test the settings a lot to find the "correct" one for your approach. It
FREE
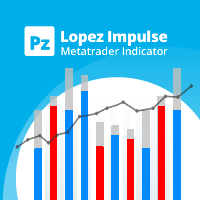
Этот индикатор одновременно оценивает волатильность и направленность цены, обнаруживая следующие события. [ Руководство по установке | Руководство по обновлению | Устранение неполадок | FAQ | Все продукты ] Решительные и внезапные движения цены Большие модели молотков / падающих звезд Сильные прорывы, поддерживаемые большинством участников рынка Нерешительные, но нестабильные рыночные ситуации Это чрезвычайно простой в использовании индикатор ... Синяя гистограмма представляет собой бычий импул
FREE

Translated with google from english ---- Этот индикатор создает тепловую карту на основе глубины рынка текущего или другого символа. Другой символ полезен, когда вы торгуете на фьючерсном рынке, а контракт имеет "мини" и "полный" сплит. Например, в Бразилии (B3 - BMF&Bovespa) WDO и DOL являются будущими валютными контрактами BRL/USD (где 1 DOL = 5 WDO), а крупные банки работают в основном с DOL (где важна ликвидность).
Пожалуйста, используйте с таймфреймом M1, объекты слишком малы, чтобы отобра

Расширенный Индикатор Экономического Календаря Этот индикатор отображает все предстоящие экономические события прямо на графике, показывая наиболее важные новости для выбранной валютной пары или инструмента. Он позволяет заранее прогнозировать периоды высокой волатильности и более точно планировать торговые стратегии. Основные функции Отображение будущих событий на срок до 5 дней вперед (настраивается). Фильтрация по уровню важности новостей (высокая, средняя, низкая). Возможность включать верти
FREE
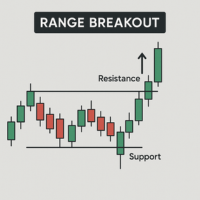
If you love this indicator, please leave a positive rating and comment, it will be a source of motivation to help me create more products <3 Key Takeaways Automatically draws Range High and Range Low boundaries for a chosen time period. Alerts when price breaks above or below the defined range. Support sending notifications via alert, email, notification when breakout occurs. Can be used as a trade signal in breakout-based strategies. However, like all indicators, it isn't foolproof, to avoid
FREE

Highly configurable Macd indicator.
Features: Highly customizable alert functions (at levels, crosses, direction changes via email, push, sound, popup) Multi timeframe ability Color customization (at levels, crosses, direction changes) Linear interpolation and histogram mode options Works on strategy tester in multi timeframe mode (at weekend without ticks also) Adjustable Levels Parameters:
Stochastic RSI Timeframe: You can set the lower/higher timeframes for Stochastic RSI. Stochastic RSI
FREE

1. Overview The Scalping PullBack Signal indicator is a powerful technical analysis tool designed to help traders identify scalping opportunities based on potential pullback and reversal signals. This tool is particularly useful on lower timeframes (below 15 minutes) but can also be applied on higher timeframes for longer-term trades. This indicator integrates several key analytical components, providing a comprehensive view of trends and potential entry/exit points, helping you make quick and e
FREE
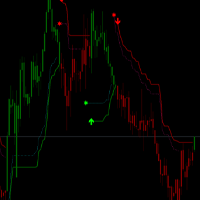
OV-VCS_ATR Trading Rules The OV-VCS_ATR indicator is a popular trend-following technical analysis tool that helps traders identify the current market trend and potential entry/exit points. Below are the general trading rules for using the OV-VCS_ATR indicator: 1. Indicator Overview The OV-VCS_ATR indicator consists of a line plotted on the price chart, which changes color to indicate the trend direction: Green Line: Indicates an uptrend (buy signal). Red Line: Indicates a downtrend
FREE

The Turtle Trading Indicator implements the original Dennis Richards and Bill Eckhart trading system, commonly known as The Turtle Trader. This trend following system relies on breakouts of historical highs and lows to take and close trades: it is the complete opposite to the "buy low and sell high" approach. The main rule is "Trade an N-day breakout and take profits when an M-day high or low is breached (N must me above M)". [ Installation Guide | Update Guide | Troubleshooting | FAQ | All Pr
FREE

Этот индикатор на панели инструментов мульти-таймфрейма и мультисимвольного расхождения отправляет предупреждение, когда одно или два разных расхождения были обнаружены на нескольких таймфреймах, а не на отдельных расхождениях. Его можно использовать на всех таймфреймах от M1 до MN. Одновременно на панели управления может отображаться максимум 9 таймфреймов. Можно включить фильтр тренда скользящего среднего, RSI или полос Боллинджера, чтобы отфильтровать только самые сильные настройки. В сочетан
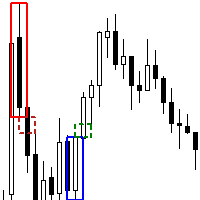
The Order Block FVG Box indicator for MetaTrader 5 is a powerful tool designed for discerning traders looking to identify and capitalize on high-probability trading opportunities. This indicator excels at pinpointing valid Order Blocks that are immediately followed by Fair Value Gaps (FVG), enhancing your trading strategy with precise visual cues. Key Features: Order Block Identification : Detects valid Order Blocks, which are significant areas where institutional buying or selling has occurred,
FREE

Ignition Candle Guard — это визуальный индикатор для MetaTrader 5, предназначенный для определения свечей с чрезмерным движением относительно ATR. Индикатор выделяет свечи, диапазон которых (High–Low) превышает настраиваемый множитель ATR, помогая трейдерам избегать поздних входов после растянутых движений цены. Индикатор не генерирует сигналы на покупку или продажу , не перерисовывается и не выполняет автоматические сделки .
Он работает как визуальный фильтр риска и может использоваться с любой
FREE

RubdFx Perfect Reversal , The reversal indicator is used to determine areas of support and resistance by Drawing an arrow with a level of supply and demand ( ReversalZones ). - You will catch more swings by reducing the period, and less swings if you increase period - Mobile, computer and email alerts available . it is not pushed by price which means the arrow will stay in one place,suitable for scalping and long term trading Also Compatible with all forex paris , BUY RULES; open a buy positio

MOVING AVERAGE RIBBON Ritz MA Ribbon Dynamics – The Next-Gen Trend Visualizer Ritz MA Ribbon Dynamics is a futuristic multi-layer Moving Average system engineered to visualize trend momentum, volatility balance, and market rhythm in one adaptive ribbon.
Designed for modern traders who demand clarity, flexibility, and automation — this tool transforms the classic MA visualization into a dynamic analytical framework. Core Concept The indicator creates a multi-tier MA Ribbon that adapts to the cho
FREE

тренд,индикатор тренда,импульс,осциллятор,гистограмма,сила тренда,рыночный поток,подтверждение тренда,бычий,медвежий,анализ рынка
Trend Flow Oscillator
Trend Flow Oscillator — это индикатор рыночного потока и импульса, разработанный для помощи трейдерам в определении силы и направления движения цены с ясностью, простотой и быстрой визуальной интерпретацией.
Особенно эффективен на 5-минутных графиках (M5) , где изменения потока происходят чаще.
Что делает Определяет смену и продол
FREE

KT Trend Trading Suite — это многофункциональный индикатор, основанный на стратегии следования за трендом в сочетании с несколькими точками пробоя, выступающими в качестве сигналов входа.
После формирования нового тренда индикатор предоставляет несколько возможностей для входа, позволяя успешно следовать за движением. Для исключения малозначительных сигналов используется порог отката.
Версия для MT4 доступна здесь https://www.mql5.com/en/market/product/46268
Особенности
Объединяет нескольк

This indicator finds Three Drives patterns. The Three Drives pattern is a 6-point reversal pattern characterised by a series of higher highs or lower lows that complete at a 127% or 161.8% Fibonacci extension. It signals that the market is exhausted and a reversal can happen. [ Installation Guide | Update Guide | Troubleshooting | FAQ | All Products ] Customizable pattern sizes
Customizable colors and sizes
Customizable breakout periods Customizable 1-2-3 and 0-A-B ratios
It implements visual/s
FREE

No Wick Candles is a powerful price action indicator that identifies candles with no upper or lower wick (also known as Marubozu candles ) and automatically draws horizontal compensation lines from their open price with a "Compensation" label . These wickless candles represent strong momentum and are often used by professional traders as key support/resistance zones . The indicator helps you visualize potential reversal or continuation zones instantly. Key Features Detects Bullish (no lower wick
FREE
Its our anniversary! To give back enjoy this 60% discount for the next week (original price $239)
We have combined all of our beloved indicators the likes of: Key level order block , Key level supply and demand , Key level liquidity grab and Key level wedge into one single indicator and dashboard.
Whats new Dashboard : There is an easy access dashboard for all your needs. Multi-timeframe button : There is now a multi-timeframe option for Order Blocks and Supply and demand zones, maki

Note from Developer:
This is the lite version of the Double TMA with Bands Indicator.
You can find the paid version that comes with alerts and on screen signal arrows built in here .
I will also be selling an EA based on this trading system soon once all backtesting and optimization have been completed.
Unlock your trading potential with the Double TMA Indicator with Reversal Detection!
Designed for swing and reversal trading, this versatile tool integrates two Triangular Moving Averages (
FREE

This Mt5 Indicator Signals when there is two opposite direction bars engulfed by current bar. has a recent Exponential Moving Average Cross and past bar was oversold/bought Expert Advisor Available in Comments Free Version Here : https://www.mql5.com/en/market/product/110114?source=Site  ; Full Alerts for mt5 terminal , phone , email, print to file, print to journal Buy Signal ( blue line ) Past ema cross ( set at 30 bars back ) Past bar rsi is oversold ( level 40 ) Engulfing bar closes
FREE
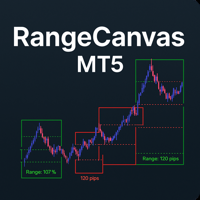
Daily Range Boxes : The indicator draws rectangular boxes around each day's high and low prices, creating a clear visual boundary for the daily trading range. Color-Coded Logic : Green boxes when the current price (or close) is above the daily open Red boxes when the current price is below the daily open Percentage Level Lines : Inside each box, it draws three horizontal lines at: 25% of the daily range 50% of the daily range (midpoint) 75% of the daily range Range Information : Each box displa
FREE

Индикатор Session Break Out – лучший инструмент для торговли по сессиям Индикатор Session Break Out – это передовой инструмент, созданный для мониторинга торговых сессий и эффективного использования стратегий, основанных на времени. Профессиональные трейдеры понимают, что время играет решающую роль на рынке Форекс, так как сила валют и их волатильность различаются в зависимости от торговой сессии. С помощью этого мощного индикатора вы сможете:
Отслеживать торговые сессии – мгновенно определять,
FREE

Simple ATR (Average True Range) Channel to find your Stop Loss and/or Take Profit. Indicator allows to draw a second multiplier if you need different values for SL and TP. Leave the second multiplier to 0 if not used.
Settings + Length
+ Smoothing
+ Multiplier #1 (default 1.5)
+ Multiplier #2 (set to 0 if not used)
+ High price
+ Low price
+ show price line
+ colors can be changed
Please leave wishes in the comments. Reviews are also welcome.
FREE

Enhance your trend-following strategy with UCS_RH_IRB (Rob Hoffman Inventory Retracement Bar) MT5 , a precision indicator identifying candles retracing 45% or more against the prevailing trend—highlighting points where institutional counter-trend activity typically subsides and the dominant move resumes. Based on Rob Hoffman’s well-known IRB methodology, this indicator offers clear visual confirmations for trend continuation setups after pullbacks, suitable for forex, indices, commoditi

This indicator shows the breakeven line level for the total number of open positions of the current symbol with P/L value and total volume. This indicator is helpful to decide the exit level when using a trading grid strategy. The style of the breakeven line is customizable to choose the color, line shape and font size of the positions description. Send mobile notification when crossing a positive P/L target
FREE

Introduction to Fractal Pattern Scanner Fractal Indicator refers to the technical indicator that makes use of the fractal geometry found in the financial market. Fractal Pattern Scanner is the advanced Fractal Indicator that brings the latest trading technology after the extensive research and development work in the fractal geometry in the financial market. The most important feature in Fractal Pattern Scanner is the ability to measure the turning point probability as well as the trend probabil

This indicator finds Double Top and Double bottom Example : What is Double Top When price establishes a new high and then falls, then reverse to the same candle area of High then its considered a valid double top and vice versa for double bottom. 1. It plots and high and low on visible chart if ChartChange is set to true else it searches on new bar opening
2. If there is double top and double bottom found in visible chart window then it plots a line 3. It has options to customize text color, tex
FREE

VOLUMIZED ORDER BLOCKS [Riz] - MT5 Indicator Smart Money Order Block Detection with Volume Analysis
Volumized Order Blocks is an advanced Smart Money Concepts (SMC) indicator that automatically detects institutional order blocks with integrated volume analysis. It identifies high-probability supply and demand zones where banks and institutions
FREE
BoxLevels Pro — Диапазон предыдущего дня и прорывы
BoxLevels Pro автоматически строит диапазон предыдущего дня (High/Low) с средней линией и метками, а затем определяет прорывы в следующей торговой сессии с помощью направленных стрелок. Это простое и быстрое средство для стратегий диапазона, прорыва и возврата к среднему на Forex, индексах, металлах и CFD. Почему это работает
Диапазон предыдущего дня часто служит ключевой зоной ликвидности. Первый чистый пробой в следующей сессии может вызвать
FREE
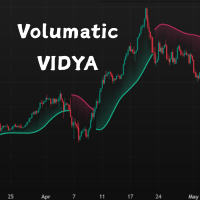
This is a custom VIDYA-based trend-following indicator for MetaTrader 5 (MT5), enhanced with ATR-band logic to adapt to market volatility. It provides dynamic trend zones and intelligent direction switching to support better trading decisions.
Unlike traditional moving averages, this indicator uses a momentum-adjusted VIDYA (Variable Index Dynamic Average) and combines it with ATR-based bands to detect trend shifts with greater precision. Features
Volatility-Adaptive Trend Logic – Uses ATR ban
FREE

A combined indicator of two famous indicators: RSI , Bollinger Bands Can be used in all currency pairs Can be used in all time frames with many signals Very simple and fast to use
Description:
This indicator is made from the combination of RSI and Bollinger Bands indicators
As you can see, it shows good signals and is worth using and testing
We hope you are satisfied with this indicator
Settings: show past show candle: Displays the number of candles that the indicator calculates.
For example
FREE

Индикатор Aroon Индикатор Aroon – Полное объяснение Индикатор Aroon — это мощный инструмент для отслеживания тренда, который помогает трейдерам определять начало, силу и развитие рыночных тенденций. Он состоит из двух линий: Aroon Up и Aroon Down , которые показывают, сколько времени прошло с момента последнего максимума или минимума цены. Если линия Aroon Up находится возле уровня 100, а Aroon Down — низкая, рынок считается в сильном восходящем тренде. Если же Aroon Down высокая, а Aroon Up низ
FREE

Данный индикатор формирует канал на основе показаний индикатора ADX (Average Directional Movement Index), отображает и сообщает трейдеру разворот цены на границах этого канала, а также, может сообщать, когда цена касается границ канала. Рисует и дополнительные пунктирные линии, которые зависят от показаний +DI и -DI индикатора ADX. Имеет также опцию для фильтрации сигналов в зависимости от показаний стохастика. Канал, рисуемый данным индикатором, получается немного похож на Envelopes или Bollin
FREE

John Bollinger created this indicator in 2010 as a way to read the original indicator (Bollinger Bands) in a more "technical" way, shown as an oscillator. The typical range of the Bollinger Bands %B is 0 - 0.5 - 1.0, where "0" represents the lower band, the "0.5" the middle band, and "1" the upper band. The line on the indicator represents the Closing prices. As simple as that.
SETTINGS
Bollinger Bands period of analysis Standard Deviation multiplier Shift Price type to be analyzed
If you like
FREE

Highly configurable Stochastic indicator.
Features: Highly customizable alert functions (at levels, crosses, direction changes via email, push, sound, popup) Multi timeframe ability Color customization (at levels, crosses, direction changes) Linear interpolation and histogram mode options Works on strategy tester in multi timeframe mode (at weekend without ticks also) Adjustable Levels Parameters:
Stochastic Timeframe: You can set the lower/higher timeframes for Stochastic. Stochastic Bar S
FREE
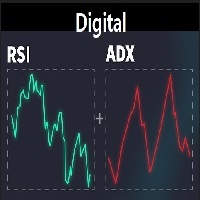
A lightweight digital indicator that combines the most important momentum tools directly on the chart. It displays real-time values of RSI, ADX, +DI, −DI, and DI Spread in a clean and compact format, without drawing any lines or graphical objects on the chart. Designed to provide fast insight into trend strength and the balance between buyers and sellers, without the need to open additional indicator windows. Fully customizable—font, size, and screen position can be adjusted easily.
FREE

Построение точек разворота Traditionnal, Fibonacci, Woodie, Classic, Demark, Camarilla для любого таймфрейма
Поддержка всех типов разворотов Traditionnal, Fibonacci, Woodie, Classic, Demark, Camarilla Поддержка любого таймфрейма (M1...H1...D1...MN1...Yearly) Поддержка перехода на летнее время Поддержка ежедневного раздела форекс от открытия в Сиднее до закрытия в США Поддержка торговли криптовалютами Заполните разрыв между разворотной точкой и трендом, очень полезно
Разворотные точки показыва
FREE

Norion Daily Key Levels is a professional indicator designed to display the most relevant price reference levels of the trading day in a clear and objective way. The indicator automatically plots essential daily levels such as: Previous day close Current day open Daily high Daily low In addition, the indicator allows the inclusion of other custom daily reference levels, making it adaptable to different trading styles and market strategies. These levels are widely used by professional traders as
FREE
MetaTrader Маркет - торговые роботы и технические индикаторы для трейдеров, доступные прямо в терминале.
Платежная система MQL5.community разработана для сервисов платформы MetaTrader и автоматически доступна всем зарегистрированным пользователям сайта MQL5.com. Ввод и вывод денежных средств возможен с помощью WebMoney, PayPal и банковских карт.
Вы упускаете торговые возможности:
- Бесплатные приложения для трейдинга
- 8 000+ сигналов для копирования
- Экономические новости для анализа финансовых рынков
Регистрация
Вход
Если у вас нет учетной записи, зарегистрируйтесь
Для авторизации и пользования сайтом MQL5.com необходимо разрешить использование файлов Сookie.
Пожалуйста, включите в вашем браузере данную настройку, иначе вы не сможете авторизоваться.