 MetaTrader 5
 Эксперты
 Индикаторы
 Библиотеки
 Утилиты
 Виджеты
 Правила
Смотри обучающее видео по маркету на YouTube
Как купить торгового робота или индикатор
Запусти робота на
виртуальном хостинге
виртуальном хостинге
Протестируй индикатор/робота перед покупкой
Хочешь зарабатывать в Маркете?
Как подать продукт, чтобы его покупали
Технические индикаторы для MetaTrader 5 - 159
 На основании сигналов технических индикаторов принимаются решения относительно открытия или закрытия сделки на фондовом и форекс-рынках. Суть индикаторов заключается в математическом преобразовании цены и/или объемов финансового инструмента для прогнозирования изменений цен в будущем.
Протестируйте технические индикаторы, чтобы лучше предсказывать поведение рынка и зарабатывать на этом.

PulseZones MTF Support & Resistance PulseZones MTF Support & Resistance is a precision tool designed to identify and display key Support and Resistance levels from multiple timeframes directly on a single chart.
It helps traders understand market structure at a glance by showing how price interacts with major zones across M15, H1, H4, and D1 timeframes. This indicator is built for traders who value accuracy, structure, and clarity in their analysis — from scalpers looking for intraday reaction z

OrderFlow Vision – Institutional Market Structure Visualizer OrderFlow Vision is a Smart Money Concepts (SMC) indicator designed to automatically detect and display institutional price structure directly on the chart.
It identifies and marks Order Blocks , Fair Value Gaps (FVGs) , Break of Structure (BOS) , and Change of Character (CHOCH) in real time, helping traders understand how price moves in relation to liquidity, imbalances, and structural shifts.The indicator works across all symbols and

In the fast-paced world of trading, precision and reliability are everything. Traders know that a single false signal can mean the difference between profit and loss. That’s why Super Trend Ultimate X was created: a next-generation trading indicator that takes the proven foundation of the classic SuperTrend and elevates it to an entirely new level of accuracy, stability, and performance.
Unlike the traditional SuperTrend, which relies solely on ATR calculations, Super Trend Ultimate X integrat
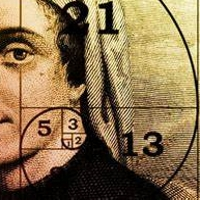
FTU Fibonacci Retrace Этот индикатор рисует уровни Фибоначчи для систем входа на основе коррекции. Улучшенная и более точная версия, чем mt4. Изучайте движение цены и используйте стратегию коррекции для входа на уровнях Фибоначчи или вблизи них. Характеристики: Настройка нескольких уровней Фибоначчи. Изменение цвета и количества баров из диапазона. Применение: Цель — изучение или измерение коррекции цены. Изменение цвета и количества баров из диапазона. Подходит для любого таймфрейма, продукта/п

Mercury GUI Crypto v4.1 — интеллектуальный многофункциональный аналитический комплекс для криптовалют и форекса Mercury GUI Crypto — это передовой индикатор нового поколения, разработанный специально для трейдеров, торгующих на криптовалютных и традиционных рынках. Он объединяет в себе более 30 аналитических модулей, визуализируя ключевую информацию прямо на графике в удобном графическом интерфейсе (GUI). Индикатор идеально подходит как для скальпинга, так и для среднесрочной торговли на тай

Liquidity Map Overview The Liquidity Map indicator is an advanced visualization tool based on ICT Smart Money Concepts .
It automatically identifies daily Buy Zones , Sell Zones , and Liquidity Levels , showing where price is likely to reverse or continue based on institutional order flow.
It calculates key levels from the daily session — such as the previous day’s high, low, and midpoint — then derives a premium (sell bias) and discount (buy bias) structure. When price trades into these mapped

Liquidity Lens See the Market Through the Eyes of Smart Money. Liquidity Lens is a next-generation ICT-style market structure tool designed to reveal the hidden layers of institutional activity.
It automatically identifies support and resistance zones , Fair Value Gaps (FVGs) , session ranges , and market opens/closes — giving you a clean and intelligent view of how liquidity truly moves. This indicator isn’t just about drawing lines — it visualizes how liquidity forms, shifts, and gets taken ac
Ready Trade System — The All-in-One Dynamic Entry, Stop & Take-Profit Indicator
Ready Trade System is a complete trading framework designed for traders who demand clarity, precision, and confidence in every move. Built on advanced multi-filter logic, this indicator dynamically calculates and displays optimal Entry, Stop Loss, and Take-Profit levels directly on your chart — adapting instantly to market volatility and trend behavior.
This isn’t just another visual indicator — it’s a decision-ma

Channel Ultima – Indicateur dynamique de nombreux canaux L'avis de Cratkoe Channel Ultima – c'est un indicateur qui vous permet de parcourir automatiquement trois canaux dynamiques .
Il s'agit d'une vidéo parfaite pour les professionnels, les professionnels et les professionnels, idéal pour les professionnels en technologie et en construction. Description détaillée Channel Ultima vous propose et propose trois chaînes disponibles , disponibles sur les réseaux sociaux et les stations de rad

NewYork_SilasFernandes: H1 Entry Killer. Green signal for buy, red for sell – no lag, no repainting. Uses real volume to filter noise, Bollinger Bands to catch perfect reversals. Advantages: enters before the move, exits at the top, works only on H1 but you can test other timeframes. Parameters: VolumeThreshold (adjusts sensitivity, default 50), BollingerPeriod (default 20, default 2 deviations), SignalColorBuy (green), SignalColorSell (red).
An indicator that puts SMC text below/above candles with green/red color for bullish/bearish candles, it finds order blocks, mitigation blocks, rejection blocks, fair value gaps, equal lows/highs, and break of structure. Text can be cluttered if multiple blocks are found, and future version might space the text from the candles a bit more. Message me if you got any requests.

Description — DS Weekly Percent The DS Weekly Percent indicator is designed to track the weekly performance of an asset, using the weekly opening price as its reference point. It automatically draws a percentage grid above and below the weekly open, creating levels that represent price variations in configurable increments (for example, ±1%, ±2%, ±3%, etc.). These levels help traders identify reaction zones and equilibrium areas in the market throughout the week. Main Features: Clear visua

Gold Flow Master — Institutional Flow Analyzer for XAUUSD Gold Flow Master reveals the hidden structure behind gold price movements by mapping institutional footprints such as Order Blocks, Fair Value Gaps, Liquidity levels, Support/Resistance, Kill Zones, and Fibonacci pockets.
It then scores the current price context to highlight the highest-probability trading zones based on real institutional behavior. Main Features Automatic Detection Bullish and Bearish Order Blocks Fair Value Gaps (FVG) L

I Institutional Liquidity Map Pro — это профессиональный индикатор MetaTrader 5, который отображает зоны институциональной ликвидности на основе месячных максимумов и минимумов. Он автоматически определяет зоны снятия стопов, потенциальные разворотные области и зоны накопления/распределения. Индикатор отслеживает до 3 уровней ликвидности покупок и продаж в реальном времени. Основные функции: Автоматическое определение месячных максимумов и минимумов Зоны институциональной ликвидности в реальном
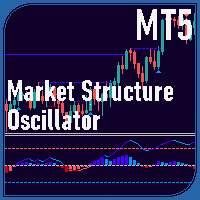
Market Structure Oscillator Overview The Market Structure Oscillator is a technical indicator designed for MetaTrader platforms to analyze market trends across multiple timeframes. It provides a clear visualization of short-term, intermediate-term, and long-term market structures through an oscillator and histogram display in a separate window. The indicator also supports optional chart objects to highlight key market structure points. Features Displays a composite oscillator combining short-ter

DailyPOC 4X — See the Market Like Never Before! If you’re tired of trading in the dark, DailyPOC 4X is designed to change the way you read price action.
This indicator highlights the most important decision zones of institutional traders, including: Daily POC (Point of Control) — the true “magnet” of price, where the highest trading volume of the day occurs. Value Area High and Low (VAH / VAL) — key regions defining the balance between buyers and sellers. Previous Days’ POCs — track how price r
Simple Smart Signal — это адаптивный индикатор тренда и импульса, разработанный для точного определения моментов входа на основе подтверждения расширения (widening) и отсутствия перерисовки сигналов. Индикатор анализирует поведение внутренних скользящих средних и формирует сигнал только тогда, когда расстояние между ними начинает увеличиваться в направлении тренда. Такой подход помогает избежать ложных входов во время боковых движений и фильтрует рыночный шум. Пользователь может выбрать, чтобы с
THE DAILY DECIDER BUYSELL PRO INDICATOR OVERVIEW Unlock the Market's Daily Secret: The Daily Decider BuySell Indicator is Here!
Tired of analysis paralysis? Struggling with false signals and noisy markets? What if you could know the market's primary intention within the first few hours of the day and trade with unwavering confidence?
Introducing the Daily Decider BuySell Indicator for MetaTrader 5. Pro Tip: Never Miss the first signal of the day This isn't just another indicator cluttering yo

ProxyFootprint — Обзор ProxyFootprint Advanced — это индикатор визуализации потока ордеров для MetaTrader 5, который предоставляет информацию о покупательском и продавательском давлении на разных ценовых уровнях. Что это такое (и чем это не является) Важно: Это не настоящий footprint-график . Реальные footprint-графики требуют доступа к данным реальной книги ордеров (объёмы bid/ask на каждом ценовом уровне) от бирж или специализированных поставщиков данных. Этот индикатор создаёт визуальную аппр
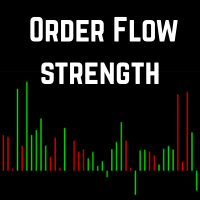
Order Flow Strength (OFS) Описание:
Индикатор, измеряющий силу потока ордеров , анализируя, где закрытие находится в диапазоне каждой свечи, с учётом объёма . Показывает покупательское давление (зелёный) и продавецкое давление (красный) в отдельном окне. Формула Order Flow Strength = Close − Low High − Low × Volume \text{Order Flow Strength} = \frac{\text{Close} - \text{Low}}{\text{High} - \text{Low}} \times \text{Volume} Order Flow Strength = High − Low Close − Low × Volume Close : цена закр
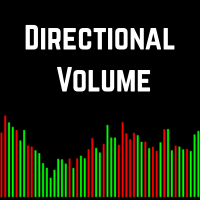
Directional Volume — Визуализация бычьего и медвежьего давления Directional Volume — это лёгкий, но мощный индикатор объёма, который разделяет бычье и медвежье торговое давление в наглядной форме. Вместо того чтобы показывать только общий объём, он выделяет, какая часть активности обусловлена покупателями, а какая — продавцами, помогая трейдерам мгновенно оценить рыночные настроения и силу импульса. Чем отличается от традиционного объёма В отличие от стандартных гистограмм объёма, показывающих л

Tick Speed & Volume Burst Описание
Профессиональный индикатор, который в реальном времени обнаруживает аномальные притоки ликвидности с помощью двух взаимодополняющих метрик: Tick Speed (синий) — измеряет ускорение потока тиков, сигнализируя о необычной активности в стакане ордеров. Volume Burst (красный) — определяет статистически аномальные всплески объёма через анализ стандартных отклонений. Инструмент нормализует данные за настраиваемый период и генерирует оповещения (звук / всплывающее окн

ChatGPT said: Вот перевод вашего описания на русский язык , адаптированный для страницы на MQL5.com — профессионально, понятно и с сохранением маркетингового стиля Умный способ отслеживать рынок Торгуйте с ясностью, точностью и уверенностью с Big Mindset Session Finder EA — вашим универсальным инструментом для автоматического определения азиатской, лондонской и нью-йоркской торговых сессий прямо на графике MT5. Больше не нужно гадать, где находятся максимумы и минимумы сессий — этот советн

Индикатор Реактивности – Оценка реакции рынка на экономические события для MT5 Индикатор Реактивности анализирует и количественно оценивает реакцию рынка на события экономического календаря в реальном времени. Он автоматически измеряет движение цены (в пунктах) через 10, 30 и 60 секунд после каждого важного экономического объявления. Основные функции Автоматическое получение событий
Интеграция с встроенным календарём MT5 без необходимости внешней настройки. • Точное измерение волатильности пос

Heikin Ashi RSI Indicator for MT5 (HARSI) Overview
The Heikin Ashi RSI (HARSI) indicator combines Heikin Ashi candle smoothing with RSI momentum analysis, providing a dual-layer view of price action and relative strength. It offers a clear visualization of market direction, RSI-based overbought and oversold conditions, and optional backtesting and alert systems for strategy validation and trade signal automation. How It Works
The indicator applies RSI values to Heikin Ashi calculations, creati

FiboCircles Zones — Fibonacci Circles, Fan, Zones & Time Analysis Suite An all-in-one Fibonacci indicator for MT5. It combines the most widely used Fibonacci tools into a single indicator — Circles, Fan, Zones, HLines, Time Period Wave, and Time Zones — with draggable, persistent anchor lines that remember their position permanently. No need to redraw anything every time you reopen the chart. Built for traders who rely on Fibonacci as a core tool for finding support/resistance, reversal points,

Indicator: Color MACD Description:
The Color MACD Indicator is an enhanced version of the classic MACD, designed to give traders a clearer and more intuitive visual signal of market momentum and trend changes.
Unlike the standard MACD, this version adds color-coded bars and signal lines to help you identify bullish and bearish momentum instantly — without having to interpret raw histogram data. Key Features: Color-coded histogram and signal line for quick visual analysis. Detects trend

TrapSniper Pro is a professional-grade indicator built to detect genuine price action setups while identifying potential market manipulation zones.
It combines advanced candlestick pattern recognition with smart filtering logic to highlight areas where institutional players may be trapping liquidity before major price reversals or continuations. This tool is designed for traders who rely on price action, smart money concepts, and clean chart analysis without unnecessary noise. It provides visual
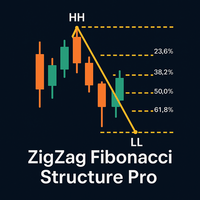
Торгуйте осознанно с ZigZag Fibonacci Structure Pro — профессиональным индикатором, который автоматически определяет Higher Highs (HH), Higher Lows (HL), Lower Highs (LH) и Lower Lows (LL) в реальном времени.
Каждый импульс цены сопровождается точным уровнем Фибоначчи , построенным только по основным движениям, без учёта мелких коррекций. Современный дизайн, приятные цвета и гибкие настройки делают анализ структуры рынка простым и наглядным. Основные функции: Автоматическое определение структ

AI SuperTrend Final – Adaptive Intelligence for Smarter Trading
The AI SuperTrend Final is not just another trend indicator—it is a next‑generation trading tool powered by adaptive intelligence. Designed for MetaTrader, this indicator combines the proven logic of SuperTrend with advanced filters such as Moving Average (MA), Average Directional Index (ADX), and a unique self‑learning mechanism. The result is a smart, evolving system that adapts to market conditions and continuously improves its
The Strat Dashboard – Мультисимвольный Сканер Паттернов для стратегии Strat Роб Смита
Преобразите свой Трейдинг с Анализом Strat по Нескольким Символам в Реальном Времени
The Strat Dashboard — мощный профессиональный индикатор, разработанный специально для трейдеров, работающих по признанной методологии «Strat» Робa Смита. Следите за неограниченным количеством инструментов на разных таймфреймах одновременно, мгновенно находите высоковероятные установки и никогда не пропускайте важный паттерн.
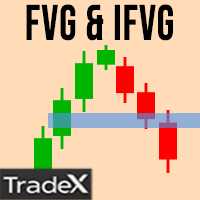
Click the link to view our products: LINK Click the link to view my best tool: LINK Description: Smart FVG & iFVG Zones Indicator MT5 accurately detects Fair Value Gaps and Inverse Fair Value Gaps based on ICT Smart Money Concepts . It automatically plots imbalance zones to reveal liquidity voids , mitigation areas , and institutional trading levels . Designed for professional traders, this tool helps you identify premium and discount zones with real-time updates. The indicator supports both bu

Symbol Changer Indicator
This is a simple yet intuitive indicator.
The indicator provide easy navigation across various symbols and across different time frames all in a chart.
The buttons are displayed on the main chart.
It is flexible and easy to use with fast response speed.
FEATURES
Use Custom Pairs : If set to true, load all the available symbols in the Market Watch. No means it loads the pairs selected below.
Pairs (Separated by Comma) : This enables selected pairs
BigMindset Liquidity & Volatility Indicator – $120 Price: $120 USD Overview:
The BigMindset Liquidity & Volatility Indicator is a powerful stand-alone tool for MetaTrader 5 that visually identifies low liquidity, high liquidity, and consolidation zones in the market. It provides traders with actionable insights to help avoid whipsaws, recognize strong momentum, and make smarter trading decisions—all without cluttering the chart. Why You Need This Indicator: Instant Market Clarity Quickly see th

Scanner Intelligence Hub - Multi-Active Monitoring 28+ Pairs Stop jumping from one chart to another. Scanner Intelligence Hub is the ultimate command center for the professional trader. Monitor dozens of assets and multiple timeframes from a single dashboard.
Technical Capabilities:
Real-time scanning: It detects candlestick patterns, mean crossovers, and RSI levels in 28 pairs simultaneously.
Customizable Panel: Choose which indicators and timeframes you want the Scanner to monitor f

VolumeTracker 4X – High-Volume Candle & VWAP Main Description: VolumeTracker 4X automatically identifies the highest-volume candle of the day in the Forex market and calculates the volume-weighted average price (VWAP) from that candle. It draws dynamic channels based on the high and low prices from the highest-volume candle to the current candle , helping you visualize key support and resistance areas . Created for traders who want more precise decisions using real trading volume as a reference.

SmartCandle 4X – Volume-Based Candles Main Description: SmartCandle 4X automatically colors each candle based on the detected volume . Low-volume candles start with soft blue tones , progressing to white, yellow, orange, red, and purple as volume increases. This allows traders to quickly identify whether the market is calm or active , supporting more strategic decisions in Forex trading. Key Benefits: Instant visualization of market activity levels . Candles colored intuitively, from low to high
Selected Range Volume — Баланс Покупателей и Продавцов + Уровни по Объёмам Selected Range Volume — это продвинутый индикатор для анализа объёмов и дисбаланса между покупателями и продавцами.
Он не просто показывает, где был объём — он выделяет, кто именно доминировал: покупатели или продавцы , и где рынок может остановиться в будущем . Вы выбираете любой участок графика, а индикатор мгновенно рассчитывает объёмную активность внутри диапазона , строит профиль объёмов по ценам и показывает соотно

Адаптивная скользящая средняя AMD (AAMA)
AAMA — это адаптивный индикатор скользящей средней для MetaTrader 4, который автоматически регулирует свою чувствительность в зависимости от рыночных условий. Основные функции: Адаптивная скользящая средняя на основе коэффициента эффективности Кауфмана — быстро реагирует на тренды и фильтрует шум во флэте Автоматическое определение 4 фаз рынка AMD: Накопление, Рост (Markup), Распределение, Падение (Markdown) Адаптация к волатильности через ATR — регулиру
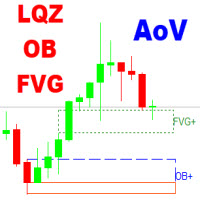
The Area of Value Detection indicator automatically identifies and highlights key institutional price zones, including Liquidity areas, Order Blocks, and Fair Value Gaps (FVG). It is designed to help traders visualize market imbalances and potential points of interest (POIs) used by smart money participants.
Main Features Liquidity Zones: Detects clusters of equal highs/lows and liquidity pools where stop orders are likely accumulated.
Order Blocks: Highlights potential bullish and bearish or
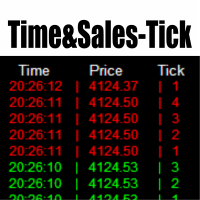
Time & Sales Tick Indicator — это индикатор для MetaTrader 5, который отображает информацию о тиках в режиме реального времени.
Он показывает цену, объем тиков и время на графике, помогая анализировать активность рынка.
Функциональные возможности Отображает данные тиков, включая цену, объем и время, в панели на графике. Группирует тики по заданным пользователем интервалам, используя цветовое кодирование (зеленый — рост, красный — падение). Панель можно разместить в любом углу графика, регулируя

True Range Normalized Momentum ( TRNM) The TRNM is a volatility and momentum oscillator designed to identify real shifts in price strength , filtering out random market noise.
It combines the True Range with statistical normalization techniques to provide a clear, responsive signal of the current momentum strength and direction . ️ Concept and Functionality TRNM measures the effective volatility of an asset using the True Range and transforms these values into a normalized momentum indicator ,

Z-Corr — это инструмент, разработанный для анализа корреляции между двумя валютными парами. Индикатор в реальном времени отображает отклонения в движении инструментов, помогая трейдеру определить моменты, когда валютные пары начинают расходиться, и своевременно открыть позицию для получения прибыли на их последующем схождении. Основные возможности: Отображает два инструмента и сравнивает их движение. Линии и гистограммы показывают текущую динамику отклонения пар. Жёлтая гистограмма сигнализирует

MARKET SENTIENCE PRO - INSTITUTIONAL GRADE MARKET INTELLIGENCE INDICATOR Copyright 2025, Amuyunzu OVERVIEW Market Sentience Pro is a comprehensive, institutional-grade trading indicator designed to decode market behavior by combining smart money concepts, market structure analysis, liquidity zone detection, and trend confirmation into a unified system. This all-in-one solution helps traders anticipate market movements before they occur by displaying a clear, layered view of institutional footpri

Simple Delta – Описание для клиента Simple Delta — это чистый и эффективный индикатор объёмного дельта для MetaTrader 5, который отображает нормализованное давление покупок и продаж над каждой свечой. Что вы получаете Индикатор анализирует данные тиков в реальном времени для расчёта дельты (объём покупок минус объём продаж) и отображает одно нормализованное значение (-10 до +10) над каждой свечой. Положительные значения показывают доминирование покупателей (отображается выбранным цветом для поку

LiquidX Pro - Precision Reversal Engine "Professional multi-confluence reversal detector that identifies high-probability tops and bottoms using institutional liquidity sweeps, volume exhaustion, and momentum divergence" Overview LiquidX Pro - Precision Reversal Engine is a sophisticated, professional-grade indicator designed for serious traders who want to catch high-probability market reversals with institutional precision. Stop chasing breakouts that fail—start trading reversals that pay. Thi
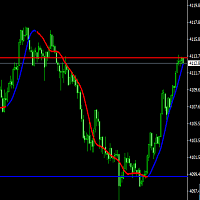
This is a professional trader's breakthrough system indicator that can be used for trading in various categories. Using the Hull moving average to create trend charts and provide price pressure and support positions, it provides traders with trading references for each cycle. Welcome to use it, if you have any questions, please contact us. The last 50 candlesticks for price pressure and support settings can be reset according to your needs
FVG Box– The Ultimate Fair Value Gap Indicator for MetaTrader 5
Developed by LiquidWave | Mohd Firuz Fahmi (Moff17) Precision Trading with Automated Fair Value Gaps
FVG Box is the next-generation Fair Value Gap (FVG) detection indicator designed for serious traders who rely on smart money concepts and institutional imbalance zones . With ultra-smooth performance and real-time updates, it automatically scans your chart to highlight potential liquidity gaps and trading opportunities wi

The Current Price Line indicator displays the current price as a real-time horizontal line on the chart. Features of the Current Price Line Unlike standard buy/sell lines, it is unaffected by spreads, enabling precise price identification. It instantly identifies reactive price zones (such as resistance/support lines), facilitating high-precision entries. It delivers high performance for scalping and day trading. Simultaneous display of lines across multiple timeframes supports multi-timeframe a

DS Candle Percent Panel – Полный обзор рынка одним взглядом DS Candle Percent Panel — это продвинутый индикатор, который показывает в реальном времени процентное изменение цены относительно открытия каждой свечи на разных таймфреймах — от M1 до D1 , включая пользовательские периоды H2 и H6 . С этим инструментом вам больше не нужно переключаться между графиками , чтобы понять, растёт ли рынок на H1, в то время как на M1 он падает. Вся информация отображается четко, логично и мгновенно в компак

Here our more valuable tools
SMC Trend Trading , Easy SMC Trading , Institutional SMC Architect Volume Analysis Tools , Volume flow Profile , Market volume profile , FVG with Volume , Liquidity Heatmap Profile , Volume Spread Analysis Purpose : Measures market pressure by analyzing tick movements, volume, and speed within a time window. How it works : Calculates weighted price changes, considers tick velocity and volatility, and applies EMA smoothing. Trading use : Strong po

Визуализируйте ключевые свечные модели с помощью интуитивного индикатора: Pin Bar: Сила отскока. Зеленый для закрытия вверх, красный — для закрытия вниз. Длинная тень и малое тело — знак рыночного отказа от уровня. Inside Bar: Период консолидации. Синий цвет отмечает свечу, которая полностью укладывается в диапазон предыдущей. Фаза сжатия и неопределенности. Fakey Bar: Ложный пробой. Коричневый цвет выделяет модель, где цена ненадолго вышла за пределы консолидации, но быстро ве

GoldenZone OrderBlock Pro MT5 GoldenZone OrderBlock Pro — профессиональный аналитический инструмент для MetaTrader 5, объединяющий классическую коррекционную зону Фибоначчи ( Golden Pocket 50.0% – 61.8% ) и концепцию умных денег ( Smart Money Concepts / Order Block ). Индикатор определяет структуру импульсного движения, выявляет область аккумуляции крупного игрока (Ордер-блок) и рассчитывает оптимальную зону отката для входа в сторону тренда с минимальным риском и высоким соотношением Risk/Rewar

OrderFlow Pro - Institutional Order Flow Detector Professional Order Flow Analysis for MT5 OrderFlow Pro is an advanced technical indicator designed to detect and analyze institutional order flow in real-time. The indicator provides traders with comprehensive insights into market dynamics by identifying buying and selling pressure, volume imbalances, absorption zones, trapped traders, and delta divergences. KEY FEATURES Order Flow Detection: Real-time buy and sell pressure calculation with perce

MA MTF Fijo: Smooth Curves, Clean Charts
Eliminates the visual "steps" of multi-timeframe moving averages.
Fixed MA MTF: It offers a smooth and professional line of any higher timeframe directly on your current chart.
Key Points:
No Steps: Real and smooth curve between candles (Goodbye to rough straight lines). High Performance: Optimized code; does not slow down your MetaTrader 5. Maximum Versatility: Supports all 21 timeframes and all methods (SMA, EMA, SMMA, LWMA). Multi-Market: Ideal fo

Swing and Liquidity Sweep Finder is a powerful tool designed to automatically detect swing points and liquidity sweeps on your chart.
It helps traders identify where the market is likely to grab liquidity before reversing, showing both internal and external liquidity zones with high accuracy.
This indicator is ideal for ICT and Smart Money Concept traders who rely on swing structure and liquidity manipulation for their entries and exits.
Our Team Services: If you are want to see our products cl

Composite MA Indicator - Comprehensive Guide Description:
The Composite MA indicator is a sophisticated multi-timeframe trend analysis tool that calculates the average value of multiple moving averages across a user-defined period range. It provides comprehensive market trend visualization through both a color-coded composite moving average line on the chart and an Excel-style panel displaying trend direction across 21 different timeframes. The indicator uses canvas technology for smooth GUI r

Magic History is a detailed trade visualization indicator designed to bring the full story of your trading activity directly onto the chart. If you’re a developer or trader who uses magic numbers, this is made for you. Smart pagination - never lose track of your trades again. Pagination means dividing content into separate pages instead of showing everything all at once.
In the context of your Magic History indicator:
Pagination is a system that lets you view your trades in sections (pages) — f
Advanced ZigZag Histogram with Divergence Detection and Order Flow Simulation ZigDeltaSwingPro is a comprehensive technical analysis indicator for MetaTrader 5, built on the classic ZigZag algorithm and enhanced with modern features such as divergence detection, dynamic histogram visualization, swing pattern recognition, and simulated order flow insights. Designed for scalpers and swing traders alike, it leverages MT5’s internal tick volume to deliver actionable signals—no external data feeds r
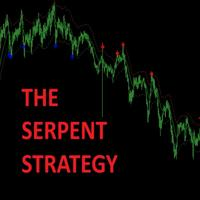
Trade Like a Serpent — Calm, Precise, Lethal. The Serpent Strategy equips you with a visual edge — clarity in confusion, precision in volatility, and confidence in timing.
Let your trades strike like a serpent — swift, silent, and accurate. Overview The Serpent Strategy is a powerful custom-built MetaTrader 5 indicator designed to identify high-probability trade zones using a unique combination of market volatility, trend direction, and momentum confirmation.
It visualizes price action in th
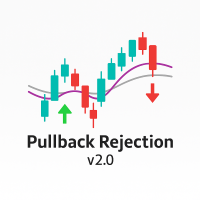
Overview Pullback Rejection v2.0 is a professional-grade visual indicator that spots continuation setups after pullbacks using Heiken Ashi logic and multi-EMA trend bias.
It is designed for scalpers and intraday traders who want clean, rule-based BUY and SELL signals aligned with trend direction only — no repainting, no noise, no counter-trend traps. Trading Concept The indicator combines EMA 7, EMA 50, and EMA 200 to define directional bias: Bias Condition Trades Allowed Bullish EMA7 > EMA200

Поймайте Разворот До Того, Как Он Произойдет Что Этот Индикатор НЕ Делает Это не генератор сигналов на покупку/продажу. Он не говорит вам автоматически, когда входить в сделку или выходить из нее. Что Этот Индикатор Делает Early Reversal Detector определяет изменения в поведении цены, чтобы точно определить оптимальные точки входа. Как Это Работает Индикатор создает свечи в отдельной панели, которые выглядят как свечи цены на основном графике - но с важным отличием: Свечи обычного графика формир

ICT Unicorn Hunter – Multi-Timeframe Smart Setup Detector IMPORTANT: This is a Multi-Timeframe Scanner, looking for 'Unicorn' setups. A Unicorn in this definition is a liquidity sweep, market structure shift and creation of a Fair Value Gap overlapping with the last opposite-close candle before the liquidity sweep (breaker). This scanner does NOT provide visualisation of the Unicorn on the chart.
For visualisation, use the Unicorn Tracker indicator, which is designed to work with the Unicorn

# Rally Drop & Base Candles — профессиональное распознавание паттернов
## Обзор
Rally Drop & Base Candles — это профессиональная система идентификации свечных паттернов, разработанная для помощи трейдерам в выявлении высоковероятных зон спроса и предложения. Этот индикатор автоматически определяет и выделяет три ключевых типа свечей, лежащих в основе институциональных торговых стратегий: свечи Rally (сильное давление покупателей), свечи Drop (сильное давление продавцов) и свечи Base (зоны кон

Блоги MQL5 = https://www.mql5.com/en/blogs/post/776162 Версия для MT4 = https://www.mql5.com/en/market/product/188797 Версия для MT5 = https://www.mql5.com/en/market/product/154022
CONTRARIAN ZONES [tambangEA] — это профессиональный индикатор рыночных зон, предназначенный для выявления потенциальных областей разворота. Он учитывает структуру свинг-движений (swing structure), показатели импульса, волатильность, динамику объема, характеристики ценовых откатов (rejection) и историю взаимодействия

Индикатор институциональной компрессии ликвидности Индикатор измеряет сжатие ликвидности в реальном времени с использованием нормализованной ширины полос Боллинджера, объема и среднего спреда, чтобы выявлять фазы компрессии перед пробоем цены. Отображение:
Профессиональное отдельное окно с гистограммой «Compression Score» и пороговой линией. Ключевые особенности Раннее обнаружение: Определяет зоны сжатия до импульсов цены. Многофакторное измерение: Комбинирует нормализованную ширину полос Болли
Signal Histogram — это надёжный технический индикатор для платформы MetaTrader 5, предназначенный для визуального определения текущего тренда на основе сравнения цены закрытия с скользящим средним. Индикатор отображает гистограмму в отдельном окне: зелёные столбцы указывают на то, что цена выше среднего, а красные — что цена ниже или равна среднему. Такой подход позволяет быстро оценить направление тренда и выявить потенциальные точки разворота. Индикатор даёт торговые сигналы в момент пересечен
Fibo AUTO Pro: Redefining Fibonacci Analysis - Smarter, More Intuitive, More Efficient Product Overview
Fibo AUTO Pro is a professional-level technical analysis indicator designed specifically for modern traders. Based on the classic Fibonacci retracement theory, it has been comprehensively enhanced with intelligence to address the pain points of traditional drawing tools in terms of efficiency, visualization, and accuracy. Fibo AUTO Pro is not merely a line-drawing tool; it is your intellige
Mean Reversion Probability – Индикатор статистического разворота Краткое описание
Институциональный индикатор, рассчитывающий статистическую вероятность возврата к скользящей средней (МА200) на основе анализа исторических перерасширений. Определяет зоны усталости рынка с количественной точностью. Основные функции
Продвинутая статистика – База из 500+ исторических расширений для расчёта реальных вероятностей
Оценка вероятности (0–99%) – Точное измерение шанса возврата к среднему
Обнаружение уст

ARB — это индикатор, созданный для выявления высоковероятных прорывов с помощью адаптивной системы каналов ATR и точной многофакторной оценки (0–100).
Он объединяет волатильность, объём, импульс и мультифреймовый тренд, чтобы предоставлять фильтрованные, наглядные и практические сигналы в реальном времени. ПРИНЦИПЫ РАБОТЫ Индикатор основан на концепции Adaptive Range Breakout (ARB) — современном подходе к торговле на пробоях, который автоматически регулирует пороги в зависимости от волатильности
Узнайте, как легко и просто купить торгового робота в MetaTrader AppStore - магазине приложений для платформы MetaTrader.
Платежная система MQL5.community позволяет проводить оплату с помощью PayPal, банковских карт и популярных платежных систем. Кроме того, настоятельно рекомендуем протестировать торгового робота перед покупкой, чтобы получить более полное представление о нем.

Вы упускаете торговые возможности:
- Бесплатные приложения для трейдинга
- 8 000+ сигналов для копирования
- Экономические новости для анализа финансовых рынков
Регистрация
Вход
Вы принимаете политику сайта и условия использования
Если у вас нет учетной записи, зарегистрируйтесь