Смотри обучающее видео по маркету на YouTube
Как купить торгового робота или индикатор
Запусти робота на
виртуальном хостинге
виртуальном хостинге
Протестируй индикатор/робота перед покупкой
Хочешь зарабатывать в Маркете?
Как подать продукт, чтобы его покупали
Технические индикаторы для MetaTrader 5 - 29

BullBear Strength Meter The BullBear Strength Meter is a dynamic market sentiment and momentum indicator that quantifies the real balance of power between buyers and sellers. Instead of relying on a single formula, it fuses multiple proven analytical engines into one comprehensive strength model — giving traders an accurate visual readout of bullish and bearish dominance in real time. This tool measures, compares, and displays the intensity of market forces using advanced statistical and trend-b
FREE
Williams Fractals (v2) — чище сигн алы , меньше шу ма Оптимизированный инд икатор фракт алов : отмечает подтверждённые экстремумы , считает только на новых барах и отсекает лишние сигн алы с помощью ATR и кла стерной лог ики . К люч евые возможности Оптимизация : расчёт на новых свечах ; полный перес ч ёт только при необходимости Чистые стрелки : настра иваем ые цвет , размер и зазор Фильтры (опц. ) : ATR‑дистанция и выбор сильней шего фракт ала в к ластере М ул
ICONIC TITAN SIGNAL v1.6 «Не торгуй, как толпа — торгуй, как легенда». ICONIC TITAN SIGNAL — это больше, чем индикатор.
Это ваш личный ментор. Ваш сканер. Ваш поставщик сигналов.
Гибридный шедевр рыночного опыта, математической логики и институциональной точности — создан для тех, кто стремится не просто торговать, а доминировать . Что делает ICONIC TITAN? Он 24/7 отфильтровывает хаос по четырём (и более) ключевым рынкам мира: XAUUSD EURUSD BTCUSD NAS100 US30 GER40 NDX100 GER30 Работает через св
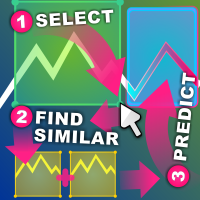
Индикатор Similar Price Action Похожие ценовые действия найдут прошлые последовательности свечных моделей, которые максимально похожи на область графика, которую вы выбрали.
Индикатор выполнит поиск, начиная с первой свечи выбранного вами региона ценового действия до самого первого самого старого бара графика.
Существует несколько критериев оценки схожести между 2 последовательностями: Последовательности должны быть идентичны по длине, если выбранный вами регион имеет ширину 20 свечей, то люб

Price and Spread Indicator
Version: 1.0 Developer: Creative Tech Solutions Website: https://www.creativetechsolutions.co.uk
Overview The Price and Spread Indicator is a great tool for MetaTrader 5 that displays the Ask and Bid prices along with the spread directly on the chart. This indicator provides real-time updates and allows traders to make informed decisions based on accurate price information.
Features - Real-time Price Updates: Continuously updates Ask and Bid prices. - Spread Disp
FREE
Session Bias This Strategy of bias useful for those who follow TRADESHARE on youtube. This script is designed by BokaroTraderFx for traders who want assistance in determining their session bias, particularly for those who trade within sessions typically represented by a single 4-hour candle. The method involves using price action to establish a daily bias, guiding decisions on whether to focus on buys, sells, or both. The analysis is based on the previous daily and 4-hour candle closes, fo
FREE

Стандартный Индикатор Fractals Bill Williams с возможностью указания количества свечей для формирования. Индикатор работает на любых графиках и таймфреймах.
Настройки: candles -количество свечей слева и справа на основе которых строиться фрактал (в классическом индикаторе это значение всегда 2 )
Контакт: Если у вас возникли какие-либо вопросы или требуется помощь, пожалуйста, свяжитесь со мной через личное сообщение. Автор: Fertikov Serhii, Больше моих индикаторов, советников, скриптов дост
FREE

Индикатор IQuantum показывает торговые сигналы по 10 символам на дневном графике: AUDCAD, AUDUSD, EURUSD, GBPCAD, GBPCHF, GBPUSD, NZDUSD, USDCAD, USDCHF и USDJPY. Сигналы индикатора генерируются двумя нейронными моделями, которые были обучены независимо друг от друга. В качестве входов для нейронных моделей используются нормализованные цены символов, а также золота, серебра и указатели текущего дня. Каждая нейронная модель была обучена в двух вариантах. Максимальный режим (Ultimate) представляет
FREE

RSI Divergence Lite (Free) - MT5 Indicator ------------------------------------------------- This is the Lite (free) version of RSI Divergence.
- Detects basic Bullish and Bearish divergence between price and RSI - Works only on M15 timeframe - No divergence lines, no alerts - Fixed internal settings (RSI 14, pivot sensitivity, thresholds) - For educational and testing purposes
For the full PRO version (multi-timeframe, alerts, divergence lines, advanced UI), please upgrade to RSI Divergence
FREE

Индикатор Экспоненциальных скользящих средних (двойной или тройной) "Envelopes" - это инструмент технического анализа, разработанный для помощи вам в выявлении трендов и потенциальных точек разворота на финансовом рынке. Этот индикатор предоставляет трейдерам гибкость выбора между двумя типами экспоненциальных скользящих средних: двойное экспоненциальное скользящее среднее (DEMA) или тройное экспоненциальное скользящее среднее (TEMA).
Основные характеристики:
Двойное или тройное экспоненциально
FREE
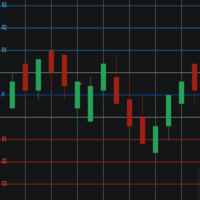
Pivot Points Levels Description The Pivot Points Levels indicator is an advanced and comprehensive tool for technical analysis based on support and resistance levels calculated from pivot points. This free indicator combines 6 different calculation methods with support for multiple timeframes, offering a robust solution for identifying key price reversal and continuation areas. Key Features 6 Calculation Methods : Traditional, Fibonacci, Woodie, Classic, DeMark (DM), and Camarilla Multi-Timefram
FREE
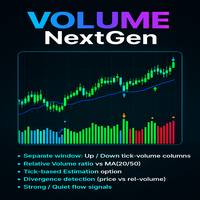
The Advanced Volume Flow Indicator is a free and practical tool who want to clearly see the balance between buying and selling pressure in the market. Instead of just showing total volume, this indicator separates volume into Up Volume (green bars) and Down Volume (red bars), making it easy to understand which side of the market is stronger at any moment.
The indicator also calculates a Relative Volume Line (blue), which shows whether the current trading activity is higher or lower than usual
FREE

STRAT Price Action Scanner – See the setup, size the risk, place the trade. Important
To place trades directly from the Trade Assistant panel, you must also install the STRAT Price Action Trade Manager EA (check the comment section) on the same terminal. The indicator sends the trade instructions; the EA is the component that actually places and manages the orders. Installation Instruction (please read) Guide to the STRAT Trading Strategy Why STRAT? Most price action trading is
FREE

Highly configurable Average True Range (ATR) indicator.
Features: Highly customizable alert functions (at levels, crosses, direction changes via email, push, sound, popup) Multi timeframe ability Color customization (at levels, crosses, direction changes) Linear interpolation and histogram mode options Works on strategy tester in multi timeframe mode (at weekend without ticks also) Adjustable Levels Parameters:
ATR Timeframe: You can set the lower/higher timeframes for ATR. ATR Bar Shift: you
FREE

Индикатор показывает на графике круглые уровни . Их еще называют психологическими , банковскими или уровнями основных игроков. На этих уровнях происходит настоящая борьба быков и медведей, накопление множества ордеров, что приводит к повышенной волатильности. Индикатор автоматически подстраивается под любой инструмент и таймфрейм. При пробитии и последующем тесте уровня 80 - покупаем . При пробитии и последующем тесте уровня 20 - продаём . Цель - 00. Внимание. Из-за сильных уровней
FREE

For those Price Action traders who love to trade strong Price points, like yesterday's HIGH and LOW, here is an indicator to ease the identification of those values, drawn directly on your chart! MIN/MAX of the Day will automatically draw 2 lines showing you those points for you, AND, if you like any HIGH and LOW in the past, not just yesterday's prices. It can also be configured to additionally show today's HIGH and LOW prices - just configure the refresh rate of those lines at your own taste/s
FREE
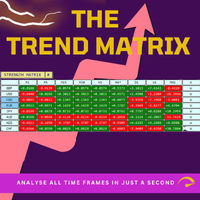
Trend Teller — Узнайте направление тренда за считанные секунды! Trend Teller — это мощная и интуитивно понятная панель, созданная для того, чтобы дать вам полное представление о рыночных трендах по всем основным валютным парам и таймфреймам — от M1 до MN1. Созданный трейдерами для трейдеров, этот инструмент устраняет догадки при анализе тренда и помогает вам оставаться в курсе общей картины. Большинство начинающих трейдеров испытывают трудности при определении направления рынка — с этим иногд
FREE

Данный индикатор повторяет широко известную версию индикатора для MetaTrader 4, который есть в интернете в свободном доступе. Индикатор не перерисовывается. Индикатор реализует стратегию прорыва. Стрелки показывают направления рынка. Используйте индикатор на интервалах от M15 и выше. Индикатор рисует две полосы возле ценового действия и генерирует сигналы при закрытии цены под нижней и над верхней полосой. Для расчета нижнего и верхнего порога полос индикатор использует периодические максимумы и
FREE
BUY INDICATOR AND GET A PIVOT POINT EA FOR FREE AS A BONUS + SOME OTHER GIFTS! Attention, the MT5 version of this application does not work on strategy tester, only on live accounts or demo accounts on live market. If you need an MT5 demo version of the Indicator send me a private message here: https://www.mql5.com/en/users/italobr ITALO PIVOTS INDICATOR is the best pivot point indicator for strong price reversals and continuations of price movements ever created, and why is that? You
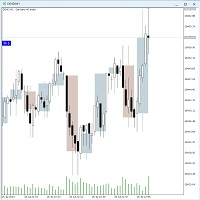
The Twotimeframe-Candles (RFrame) - Indicator for MT5 shows the candles of an higher, timeframe as an overlay on the current timeframe. You can choose the number of candles and color of the overlays. The indicator calculates the candle evevery tick. If you like the indicator, please left a comment. Version 1.1: The second time frame can now be set.
Keywords:
Candlestick, Multitimefram, Two Timeframes,
FREE

Gatotkaca Support Resistance Trendline Indicator is a simple indicator that detects support, resistance and trendlines. It will helps you find breakout momentum based on lines calculated by this indicator. This is conceptually based on fractals, but with customizable periods. Compatible for any timeframes. You can customize how this indicator work by setting up the period input.
FREE

[ Мой канал ] , [ Мои продукты ]
Обзор
Классификатор Лоренцевского расстояния — это торговый индикатор на основе машинного обучения, использующий расстояние Лоренца в качестве основного критерия в рамках приближённых ближайших соседей (ANN). Вместо традиционного евклидова расстояния он рассматривает ценовое движение как происходящее в «искажённом» пространстве цена-время (аналогично тому, как массивные объекты искривляют пространство-время в теории относительности). Такой подход делает классифи

There is a science, named Quantitative Finance, that allows to study the financial derivative pricing models using the methods of theoretical and mathematical physics.
Lately I came across a paper that describes a new indicator for technical analysis that combines ideas from quantum physics and brings them to finance. I got interested in it and decided I would teach how to implement indicators based on a scientific papers in MQL5.
The original Moving Mini-Max paper [2] is written by Z.K. Silaga
FREE
The Sessions and Bar Time indicator is a professional utility tool designed to enhance your trading awareness and timing precision on any chart. It combines two key features every trader needs — market session visualization and real-time bar countdown — in one clean, efficient display. Key Features: Candle Countdown Timer – Shows the remaining time before the current candle closes, helping you anticipate new bar formations. Market Session Display – Automatically highlights the four main trading
FREE

QuantumAlert CCI Navigator is a free indicator available for MT4/MT5 platforms, its work is to provide "alerts" when the market is inside "overbought and oversold" regions in the form of "buy or sell" signals. This indicator comes with many customization options mentioned in the parameter section below, user can customise these parameters as needful. Join our MQL5 group , where we share important news and updates. You are also welcome to join our private channel as well, contact me for the pri
FREE

The Supertrend etradro indicator is volatility based and is more of a trend following indicator in function. The ATR indicator, which is integrated into the calculation of the super trend, also calculates course gaps (gaps) and does not overlook them. This allows more accurate values to be calculated. When measuring volatility, the mean value of the current price serves as the basis. Since the Supertrend indicator features sliding stop and reversal lines, it is quite similar in function to the P
FREE

Detect divergence (classic, hidden) price and all oscillator indicator include: RSI, CCI, MACD, OSMA, Stochastic, Momentum, Awesome Oscillator (AO), Accelerator Oscillator (AC), Williams Percent Range (WPR), Relative Vigor Index (RVI), Rate of Change (ROC). Confirm reversal with dochian channel for to improve signal quality. Divergence is when the price of an asset is moving in the opposite direction of a technical indicator , such as an oscillator, or is moving contrary to other data. Diverge

The HighsAndLowsPro indicator for MetaTrader 5 marks local highs and lows in the chart. It distinguishes between weak and strong highs and lows. The line thicknesses and colours can be individually adjusted. In the default setting, the weak highs and lows are displayed thinner, the strong ones thicker. Weak highs and lows have 3 candles in front of and behind them whose highs are lower and lows are higher. The strong highs and lows have 5 candles each.
FREE

Moving average indicator to work with the F12 Replay simulation and replay tool.
In this way, the F12 Replay tool now supports the moving average indicator.
F12 Replay: https://www.mql5.com/pt/market/product/38313
This is a product developed by Renato Fiche Junior and available to all MetaTrader 5 users!
Partners: "Águia Traders" team ( Eagle Traders ) by Larissa Sihle #aguiatraders #larissasihle
Input Parameters
Period Shift Method
FREE

This indicator draws the highest and the lowest prices of the previous periods on the chart. And If you want, Indicator can alert you when the current price arrives these levels. For example: If you are watching the H1 timeframe, Indicator shows you the lowest and the highest prices of H4, D1, W1 and M1 periods. So you don't need to open the other periods of chart windows. Alert Options: Send Mobil Message, Send E-mail, Show Message, Sound Alert Time Periods: M1, M5, M15, M30, H1, H2, H3, H
FREE
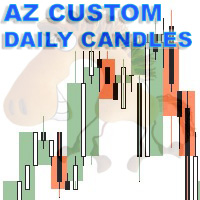
AZ_custom_daily_candle Индикатор позволяет рисовать контуры дневных свечей на мелких таймфрэймах, плюс вы можете настроить отображение например Н1 свечи и смотреть, как она выглядит на М5 графике (считаю, что это полезная для скальпинга настройка). Далее, есть возможность смещать начало/окончание рисования свечей, менять цвет фона, толщину линий. Предложения и пожелания приветствуются.
v 1.05 (31/03/2025) По многочисленным просьбам добавлена возможность включать/выключять дневной максимум/мини
FREE

Индекс Относительного Равновесия, REi — индикатор технического анализа, показывающий направление и силу тенденции и указывающий на вероятность еe смены. Он показывает отношение среднего прироста цены к среднему падению за определенный период времени. Величина индекса позволяет оценить, покупатели или продавцы сильнее влияли на цену за установленный период времени и предположить дальнейшее развитие событий. Индикатор отличается простотой интерпретации и качеством подаваемых сигналов. Точки входа,
FREE
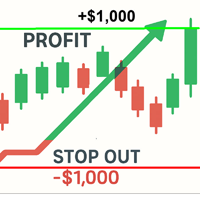
Margin & Profit Visualizer for MT5 Настройки, возможности и применение:
Ключевые возможности - **Расчет критических уровней**: Margin Call, Stop Out, нулевая маржа, полный слив - **Линия безубытка**: автоматический расчет для всех позиций - **Линия прибыли**: отображение цены достижения заданной прибыли (в деньгах или пунктах) - **Мультивалютная поддержка**: работа с позициями на разных инструментах - **Фильтрация позиций**: по символам и магическим номерам - **Адаптация под брокера**: авт
FREE

MTF Levels And Moving Averages is a professional indicator designed to identify key support and resistance levels across multiple timeframes. The tool helps traders locate precise entry and exit points by analyzing market structure and price action patterns. Key Features The indicator provides multi-timeframe analysis covering H1, H4, D1, and W1 periods simultaneously. It identifies supply and demand zones where price typically reacts, using color-coded visualization to distinguish between dif
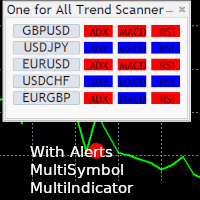
One for All Trend Scanner is a trend following multi-symbol indicator that can be used with any input: forex, stocks, commodities,... The panel shows three indicators and six symbols with the trend for every pair (symbol/indicator): up, down or no trend. The indicators are: Average Directional Movement Index (ADX) Moving Average Convergence Divergence (MACD) Relative Strength Index (RSI) You can choose which indicators will use for entry/exit and can adjust the parameters of each indicator sepa
FREE

El indicador "Time Broker Deriv" está diseñado específicamente para su uso en los índices sintéticos Boom y Crash, así como en otros pares de trading disponibles en la plataforma MT5. Su función principal es proporcionar la hora del broker en comparación con nuestra hora local. Es importante destacar que el indicador "Time Broker Deriv" solo muestra la hora del broker.
FREE
If you love this indicator, please leave a positive rating and comment, it will be a source of motivation to help me create more products <3 Key Takeaways The Laguerre RSI is an enhanced version of the traditional Relative Strength Index (RSI) that incorporates Laguerre filters to smooth the price data. This helps reduce the noise and volatility that are often seen in the standard RSI, providing a cleaner and more reliable indicator for spotting trends, reversals, and overbought or oversold con
FREE

CustomRSI50 - Индикатор RSI с настройкой уровня 50 Описание CustomRSI50 – это настроенный технический индикатор, основанный на популярном индексе относительной силы (RSI). Этот индикатор предоставляет четкое и настраиваемое отображение RSI с особым акцентом на уровне 50, который является ключевым для многих трейдеров при анализе момента. Основные функции Настраиваемый период RSI Выделенный уровень 50 Настраиваемый тип цены Отображение в отдельном окне Фиксированная шкала от 0 до 100 для удобства
FREE
Представьте: вы стоите на пороге огромной прибыли, но рынок внезапно меняется, и вы упускаете шанс. Или еще хуже, вместо прибыли получаете убытки. А что, если бы у вас был надежный союзник, который заранее шепчет: "Готовьтесь – волны на подходе!"? Знакомьтесь с Harbinger – революционным индикатором для MetaTrader 5, специально разработанным для трейдеров, кто устал от хаоса и хочет предугадывать изменения рынка! Harbinger – Это умный алгоритм, анализирующий скрытые паттерны волатильности трендов

You may find this indicator helpfull if you are following a session based strategy. The bars are colored according to the sessions. Everything is customisable.
Settings: + Asia Session: zime, color, high, low + London Session: zime, color, high, low + US Session: zime, color, high, low
Please feel free to comment if you wish a feature and/or give a review. Thanks.
FREE
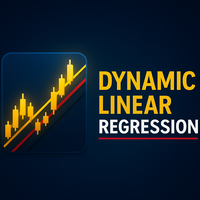
Linear Regression Channel (LRC) Indicator – Overview The Linear Regression Channel (LRC) indicator is a professional tool designed to display dynamic price channels around a regression trendline. It automatically adapts to market conditions, helping traders visualize price movement with clarity. Main Features : Regression-based central line with upper/lower channel boundaries. Fully customizable colors, styles, and levels. Optional labels and forward extensions for better chart visualizati
FREE

** All Symbols x All Timeframes scan just by pressing scanner button ** *** Contact me to send you instruction and add you in "ABCD scanner group" for sharing or seeing experiences with other users. Introduction This indicator scans AB=CD retracement patterns in all charts. The ABCD is the basic foundation for all harmonic patterns and highly repetitive with a high success rate . The ABCD Scanner indicator is a scanner reversal ABCD pattern that helps you identify when the price is about to cha

SuperTrend Pro – Advanced Trend Detection Indicator (MT5) SuperTrend Pro is a modern, optimized trend-following indicator for MetaTrader 5 , designed to deliver clear trend direction, precise market structure, and a premium visual trading experience . It is based on an enhanced ATR-powered SuperTrend algorithm , combined with smart visuals, chart styling, and a real-time information panel. -Key Features - Advanced SuperTrend Logic Uses ATR (Average True Range) with adjustable Period and Multipli
FREE

Мощный трендовый индикатор, снабженный всем необходимым для торговли и при этом очень прост в использовании. Могу поспорить, что вы сталкивались с индикатором или советником, содержащим множество входных параметров и сложных инструкций. Индикатор полностью оправдывает свое название: входные параметры интуитивно просты и подбирать ничего не нужно — за вас все сделает нейронная сеть.
Отличия от классической версии
Добавлена мультитаймфреймовая панель, чтобы вы могли проверять тренд на других тайм

Динамический индикатор поддержки и сопротивления - универсальный инструмент, объединяющий уровни поддержки и сопротивления с динамикой рынка в реальном времени. Путем учета предыдущих дневных максимумов и минимумов он предоставляет ценную информацию о психологии рынка и выявляет потенциальные уровни разворота цены или прорыва. Благодаря способности адаптироваться к изменяющимся рыночным условиям и настраиваемым параметрам, трейдеры могут опережать тренды и принимать обоснованные решения. Этот ин
FREE

Heiken Ashi Smoothed – The Ultimate Trend Filtering Indicator for MT5 Enhance Your Trading with Smoother Trends! The Heiken Ashi Smoothed indicator is a powerful tool designed for traders who want clearer trend signals while eliminating market noise. Unlike traditional Heiken Ashi candles, this smoothed version provides fluid, lag-free price action , making it perfect for swing trading, trend following, and long-term analysis. Key Features: Crystal-Clear Trends – Filters out market noise for

Индикатор для синхронизации и позиционировании графиков на одном и более терминалах одновременно. Выполняет ряд часто необходимых при анализе графиков функций: 1. Синхронизация графиков локально - в пределах одного терминала при прокрутке, изменении масштаба, переключении периодов графиков, все графики делают это одновременно. 2. Синхронизация графиков глобально - тоже самое, но на двух и более терминалах, как МТ5, так и МТ4. 3. Позиционирование графика на заданном месте при переключении периодо
FREE
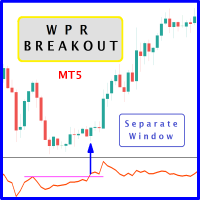
The likelihood of farther price movement increases when Larry Williams Percentage Range oscillator "WPR" breaks through its historical resistance levels in conjunction with prices breakout of resistance levels. It's strongly encouraged to confirm price breakout with oscillator breakout since they have comparable effects to price breaking support and resistance levels; similar perception is applied to short trades. Concept is based on find swing levels which based on number of bars by each side t
FREE

Ищет сильные движения цены и по их завершении рисует уровни. Силу движения вы определяете самостоятельно, указав в настройках количество пунктов и количество свечей одинакового цвета подряд в одном направлении. В настройках есть 2 типа построения: extrenum - high/low close - цена закрытия Так же можно регулировать количество отображаемых уровней и число свечей для расчетов. По умолчанию в настройках указано 5 уровней для 360 свечей. То есть будет вычислено 5 уровней для сильных движений вверх
FREE
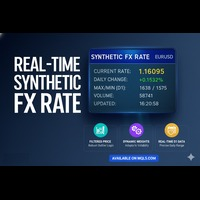
Real-Time Synthetic FX Rate Real-Time Synthetic FX Rate — это продвинутый индикатор, разработанный для расчета надежной синтетической оценки обменного курса для любой валютной пары, доступной у вашего брокера (включая основные, второстепенные и экзотические пары). Его цель — предоставить динамический ориентир , отражающий формирование цены в режиме реального времени , выступая в качестве руководства до публикации официальных курсов или институциональных подтверждений. Принцип Работы: Надежная Ги
FREE

Hidden Edge – High-Low PreUS High-Low PreUS is a clean and lightweight indicator that marks key reference levels before the US session begins.
It draws a session box from 00:01 to 09:00 CET, identifying the high and low of the Asian session, and includes additional reference elements to support structured intraday trading decisions. Features Draws a rectangular range from 00:01 to 09:00 CET Marks the high and low of the session clearly Plots a horizontal yellow line as a suggested stop level bas
FREE
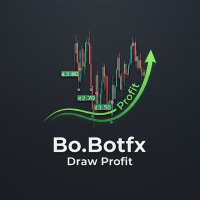
Tired of sifting through your account history to track closed trade profits? The Draw Profit indicator by Bo.Botfx is here to revolutionize how you visualize your trading performance! This intuitive and powerful indicator automatically draws the profit (or loss) of your closed orders directly onto your chart . No more guessing or tedious calculations – with Draw Profit, you can instantly see the exact outcome of each trade right where it happened. Key Features: Visual Profit Tracking: Clearly di
FREE

Графическое представление внутридневной силы валют. Расчет основан на 28 валютных парах. Значения отслеживаются с момента начала дневной свечи до текущего времени. Изначально этот индикатор был создан как бесплатный инструмент для панели инструментов FX28 Trader. Теперь вы можете использовать его бесплатно. Индикатор имеет множество настроек для настройки, а также его можно напрямую подключить к системе управления графиками FX28 Trader. Внимание! Этот индикатор не работает в тестере стратегий. Д
FREE

!!!This Free Version just works on EURUSD!!! Wa Previous Candle Levels MT5 shows the previous candle levels, it shows the previous candle Open High Low Close levels (OHLC Levels) in different time frame. It's designed to help the trader to analyse the market and pay attention to the previous candle levels in different time frame. We all know that the OHLC Levels in Monthly, Weekly and Daily are really strong and must of the time, the price strongly reacts at those levels. In the technical anal
FREE

Colored Moving Average – Visual Trend Clarity Made Simple The Colored Moving Average is a clean and effective trend visualization tool that enhances any trading strategy. Unlike standard moving averages, this indicator dynamically changes color based on the direction of the trend—green when rising, red when falling—making it easy to spot shifts in momentum at a glance. Perfect for scalping, day trading, or swing trading, this indicator helps you: Instantly identify bullish and bearish phases Fi
FREE

CDS SR Fractal Level: Dynamic Fractal Support & Resistance with Breakout Alerts Overview Tired of manually drawing and updating support and resistance lines? The CDS SR Fractal Level indicator automates this crucial process by intelligently identifying key market levels based on fractals. This lightweight and efficient tool allows you to focus on your trading strategy, not on chart setup, ensuring you never miss an important price level or a potential breakout. This indicator is clean, simple,
FREE
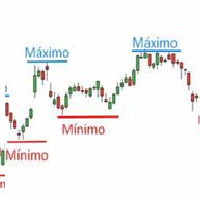
General Description of the Indicator This indicator is a visual tool that plots the high , low , and mid levels of each day on the chart. These levels are calculated based on the daily timeframe (D1) but can be displayed on any other timeframe (M1, M5, H1, etc.). Additionally, the indicator allows: Horizontal shifting of the high and low levels based on a user-specified number of days (parameter Shift ). Limiting the display to a specific number of days (parameter VisibleDays ).
FREE

Нужны тестировщики для нового эксперта, кому интересно пишите на почту 777basil@mail.ru https://backoffice.aurum.foundation/u/DHXP1U
Расчет индикатора основан на изменении цены в истории и рассчитывается математически, пересчитывается каждый раз с новым поступлением данных. Может использоваться на разных таймфреймах. От границ индикатора в 70% происходит изменение направления движения цены, либо консолидация. Таким образом можно торговать, как по тренду, так и в середину канала от его границ.
FREE

Индикатор Point-Percent Price Channel (PPPC или PP Price Channel) предназначен для отображения на графике канала, ширина которого задаётся как в процентах от текущей цены так и в пунктах. Его внешний вид представлен на слайде 1. При движении рынка вверх верхняя граница канала строится по ценам High свечей. При этом нижняя граница движется вслед за верхней на строго указанном расстоянии. При касании ценой нижней границы канала индикатор переключается на построение тепер
FREE

Индикатор Trade in trend предназначен для торговли по тренду. Сила тренда определяется шириной линии. Узкая линия - начало или конец тренда. Широкая линия свидетельствует о высокой силе тренда. Резкая смена ширины линии свидетельствует, с большой вероятностью, об окончании тенденции. Сигналы индикатора Не против покупки: переход с красной линии в белую цена отразилась от белой линии индикатора цена находится выше белой линии индикатора Не против продажи: переход с белой линии в красную цена отр
FREE
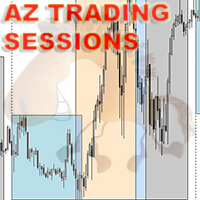
Внимание - изначально индикатор разрабатывался для торговли фьючерсами и нюансами воскресной сессии. В данной модификации нет учёта воскресного премаркета, а идёт жесткая привязка ко времени на графике для корректной работы на споте. Стандартный индикатор АТР, можно включить игнорирование аномально больших свечей. Есть возможность менять расположение выводимого текста по 4 углам графика. Можно менять период расчёта (дней назад). Бонус - в индикатор добавлена корреляция с объёмами. Можно включит
FREE

The Expert Advisor for this Indicator can be found here: https://www.mql5.com/en/market/product/115567 The Contraction/Expansion Breakout Lines with Fair Value Gaps (FVGs) Indicator for MetaTrader 5 (MT5) is a powerful technical analysis tool designed to help traders identify and visualize breakouts at critical levels of contraction and expansion in financial markets. By incorporating Fair Value Gaps (FVGs), this indicator enhances traders' ability to gauge market sentiment and anticipate poten
FREE

What is this indicator? This indicator is for comparing multiple charts and verifying the chart pattern. Synchronize each chart position with the common vertical line. By changing the chart mode, you can also display the chart like a real trade.
How to set up
1. Scroll the chart of the target currency pair to the end in the past direction and download all the historical data of that currency pair. 2. Install this indicator in the main window of each chart. 3. Customize each parameter on the In

Introduction to Fractal Moving Average Fractal Moving Average indicator was designed as part of Fractal Pattern Scanner. Inside Fractal Pattern Scanner, Fractal Moving Average Indicator was implemented as multiple of chart objects. With over thousands of chart object, we find that it was not the best and efficient ways to operate the indicator. It was computationally too heavy for the indicator. Hence, we decide to implement the indicator version of Fractal Moving Average indicator to benefit ou
FREE

Kindly rate and comment about the product for upgradation & Support
The 5 EMA is plotted in green color ( Lime ).
The 14 EMA is plotted in red color ( Red ).
The 20 EMA is plotted in blue color ( Blue ).
The 200 EMA is plotted in yellow color ( Yellow ).
The Quarter EMA that provided calculates and plots four Exponential Moving Averages (EMAs) on the chart using different periods: 5, 14, 20, and 200. Each EMA is represented by a different color on the chart. Here's a description of each EMA:
FREE

Currency Strength Meter - это самый простой способ определить сильные и слабые валюты. Этот индикатор показывает относительную силу 8 основных валют + Золото : AUD, CAD, CHF, EUR, GBP, JPY, NZD, USD , XAU . Символ золота может быть изменен на символ другого инструмента, например такого как XAG, XAU и т.д.
По умолчанию значение силы нормализовано в диапазоне от 0 до 100 для алгоритма RSI: Значение выше 60 означает сильную валюту; Значение ниже 40 означает слабую валюту;
Для работы данного индик

Whether you are a scalper or daily trader, you will always look for bullish / bearish engulfing candles. This can be a bit tricky and stressful when you try to visually identify the engulfing candles on the chart. Not only that, you might be trading on the M15 time frame but the engulfing candle is forming or has already formed in the H4 time frame. This indicator is made to do that on your behalf. You can trade on any time frame and see Engulfing candles of another time frame, this means that
FREE
MultiFrame MA: A Multi-Timeframe Trend Indicator MultiFrame MA is a trend analysis indicator designed to provide a comprehensive market overview across various timeframes. Instead of relying on a single timeframe, this tool synthesizes information from multiple charts, giving users a holistic and reliable perspective. KEY FEATURES: Multi-Timeframe Analysis: The indicator analyzes data from various timeframes, from M1 up to Monthly, to help users identify trend confluence at different levels. MA
FREE

Momentum Reversal - мощный инструмент обнаружения возможных точек разворота и начала коррекции, основанный на анализе интенсивности ценовых движений и формациях баров. _________________________________ Как пользоваться сигналами индикатора: Индикатор формирует сигнал после появления нового ценового бара. Использовать сформированный сигнал рекомендуется после пробития ценой критической точки в указанном направлении. Индикатор не перерисовывает свои сигналы. _________________________________ Пара
FREE

ЭТОТ ИНДИКАТОР ЯВЛЯЕТСЯ ЧАСТЬЮ EA: HIPERCUBE PRO GALE BTC Код скидки 20% на Darwinex Zero: DWZ2328770MGM_20
Представляем новую версию индикатора Donchian
Мы рады представить новую версию индикатора Donchian , разработанную с использованием передовых улучшений и повышенной точности. Теперь полностью адаптирован для HiperCube Pro Gale , этот обновленный инструмент предлагает бесшовный опыт, адаптированный для более эффективной торговли.
Почему эта версия — настоящий прорыв:
Адаптирован для
FREE
MetaTrader Маркет - лучшее место для продажи торговых роботов и технических индикаторов.
Вам необходимо только написать востребованную программу для платформы MetaTrader, красиво оформить и добавить хорошее описание. Мы поможем вам опубликовать продукт в сервисе Маркет, где его могут купить миллионы пользователей MetaTrader. Так что занимайтесь только непосредственно своим делом - пишите программы для автотрейдинга.
Вы упускаете торговые возможности:
- Бесплатные приложения для трейдинга
- 8 000+ сигналов для копирования
- Экономические новости для анализа финансовых рынков
Регистрация
Вход
Если у вас нет учетной записи, зарегистрируйтесь
Для авторизации и пользования сайтом MQL5.com необходимо разрешить использование файлов Сookie.
Пожалуйста, включите в вашем браузере данную настройку, иначе вы не сможете авторизоваться.