Смотри обучающее видео по маркету на YouTube
Как купить торгового робота или индикатор
Запусти робота на
виртуальном хостинге
виртуальном хостинге
Протестируй индикатор/робота перед покупкой
Хочешь зарабатывать в Маркете?
Как подать продукт, чтобы его покупали
Технические индикаторы для MetaTrader 5 - 26

Индикатор отображает по-барно дельту и кумулятивную дельту на основании данных о сделках ленты "Time & Sales". В дополнение к стандартным таймфреймам индикатор отображает данные относительно секундных таймфреймов (S5, S10, S15, S20, S30) на выбор. С помощью прямоугольника выделяется произвольная область в подокне индикатора для просмотра соотношения объёмов сделок покупок и продаж внутри данной области.
Особенности работы индикатора:
Индикатор работает корректно только на тех торговых символах

Вилка Нео v5, разрабатывалась для торговой системы "Оракул", но постепенно дополнялась, например - углами Ганна и другими опциями... Можно создавать графические объекты с заданным цветом, стилем и толщиной, такие как: прямоугольники с заливкой и без, отрезки трендлиний и нестандартный инструмент - "вилка Нео" в виде трезубца, так же есть возможность интерактивно настраивать цветовую палитру прямо с графика, настраивать видимость объектов для разных ТФ, толщину и стили...
Панель переключается кл
FREE

Ai Trend Spotter (D Originals).
Падение Форекса.
Мы часто спрашиваем: " Как брокерские компании зарабатывают деньги? ", и отмечаем любые небольшие выигрышные сделки с нашей стороны.
Но после использования (D Originals) вы спросите себя: "Как я стал богатым в одночасье?" .
Настолько глубоко, действие говорит громче, чем голос.
С Ai Trend Spotter не бойтесь:
*Манипулирование рынком *Разворот рынка * Снайперский вход и существование *Прыжок со свечой
Индикатор предназначен для каждой па
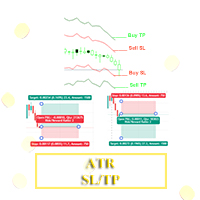
Привет, трейдеры! Я разработал индикатор для трейдеров, которые используют средний истинный диапазон (Average True Range), или значение ATR, для определения стоп-лосса и тейк-профита. С помощью этого индикатора вы можете легко установить тейк-профит и стоп-лосс с выбранным вами множителем.
Чтобы использовать этот индикатор, пожалуйста, настройте период ATR в соответствии со своим стилем торговли, а затем соответствующим образом настройте множители стоп-лосса и тейк-профита.
Удачной торговли!
FREE
WYSIWYG OPEN RANGE BREAKOUT - PRO EDITION
Ultra-precise ORB indicator with smart line-breaking, dynamic ATR-based targets, and multi-session adaptability. Perfect for day, swing, and algorithmic traders seeking clear visuals and actionable levels . Trade with confidence – see what you trade, trade what you see . "What You See Is What You Get" "What You See Is What You Get" – The ultimate ORB indicator delivering ultra-precise trading range visualization with a smart line-breaking system. Built
FREE

The daily custom period seperator indicator allows you to draw period seperators for your lower time frame charts H1 and below. The period seperator gives you options to set different colors for: Weekend - saturday/sunday Monday and Friday Midweek - Tuesday to Thursday.
By default the indicator plots the period seperator line at 00:00 hours for the last 10 days.
Use Cases: The indicator can be used as a colourful alternative period seperator to the default MT5 period seperator. For those tha
FREE

Welcome to Ultimate MA MTF , a multi-functional Moving Average (MA) indicator converted from the original TradingView version by ChrisMoody and upgraded with many powerful features. This is not just a typical MA line. It is a comprehensive technical analysis tool designed to provide traders with deep insights into trends, volatility, and potential trading signals, all within a single indicator. Key Features 8 Moving Average Types: Full support for the most popular MA types (SMA, EMA, WMA, HullMA
FREE

RITZ SMART TREND ADAPTIVE FINDER Precision Trend Intelligence. Adaptive. Insightful. Real-Time. Ritz Smart Trend Adaptive Finder is an advanced market intelligence indicator engineered to detect and adapt to evolving market structures with dynamic precision.
It automatically calibrates its analytical period based on real-time volatility, price momentum, and correlation strength — delivering true adaptive trend detection rather than static or lagging signals. By combining Pearson correlation , sl
FREE
Mean Reversion Probability – Индикатор статистического разворота Краткое описание
Институциональный индикатор, рассчитывающий статистическую вероятность возврата к скользящей средней (МА200) на основе анализа исторических перерасширений. Определяет зоны усталости рынка с количественной точностью. Основные функции
Продвинутая статистика – База из 500+ исторических расширений для расчёта реальных вероятностей
Оценка вероятности (0–99%) – Точное измерение шанса возврата к среднему
Обнаружение уст
Classic ZigZag formula. But no lags and repaints. You can see on screenshots that it shows values between peaks and it is useful to test strategies based on indicator. Because sometimes people find a good idea about it but don't understand that repainting indicators have some things to keep in mind. The parameters are the same as original ZigZag indicator: Depth, Deviation and Backstep. Useful for visual analyze of the chart and cut strategies based on repainting peaks.
FREE

Bollinger Bands Stop Indicator holds significant importance for traders navigating the complex world of financial markets. Its relevance lies in several key aspects. Firstly, it aids in trend identification. By analyzing price movements relative to the Bollinger Bands, traders can discern whether the market is in an uptrend, downtrend, or ranging phase. Secondly, the indicator provides valuable insights into market volatility. Wider bands indicate higher volatility, while narrower bands suggest
FREE
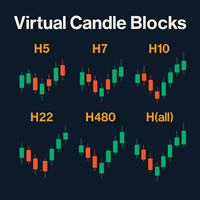
Virtual Candle Blocks – Визуализируйте рынок без ограничений Virtual Candle Blocks — это продвинутый индикатор для MetaTrader 5, который позволяет создавать и отображать свечи любого пользовательского таймфрейма, включая те, что недоступны на платформе изначально. Основные особенности: Пользовательские таймфреймы: Индикатор группирует базовые свечи графика в блоки любой желаемой продолжительности (например, 5ч, 14ч, 28ч, 72ч и т.д.), чтобы создать новую виртуальную свечу. Это дает вам доступ к у
FREE

The Keltner Channel is a volatility-based technical indicator composed of three separate lines. The middle line is an exponential moving average (EMA) of the price. Additional lines are placed above and below the EMA. The upper band is typically set two times the Average True Range (ATR) above the EMA, and the lower band is typically set two times the ATR below the EMA. The bands expand and contract as volatility (measured by ATR) expands and contracts. Since most price action will be encompasse
FREE
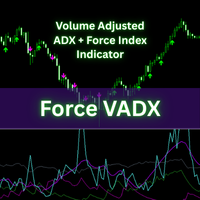
Force VADX Indicator Force VADX is an advanced, multi-factor indicator that fuses volume-adjusted trend strength, normalized force index, and adaptive directional signals. Designed for modern traders, it pinpoints high-confidence buy and sell zones, offering a robust technical foundation for both discretionary and automated trading.
Use this indicator in conjuntion with other tools for confirmation and confluene. This indicator is not intended to be a complete trading system but rather a tool
FREE

Taking orders, now on MT5 the TPX Dash Needle is everything you need to find the famous Didi Needles on several timeframes and in several pairs at the same time. These are the simultaneous meeting of the 3, 8 and 20 averages that, aligned with the ADX indicator, are synonymous with large and strong movements in the market. Now with the new Heiken Aish filter, the name of the pair shows the direction of the Heiken Aish you choose, it can be weekly or daily, all signals will appear on the screen,
ZZA TRADE ASSISTANT This ZAA trade assistant indicator is very powerful. Here you can use this as your trading assistant . So while applying this use money management . This indicator can be use on 5 minutes timeframe, 15 minutes timeframe, 1 hour minutes timeframe and above . Try practice this on your demo account before using on real account . This indicator should apply on meta trader 5 .
FREE

ATR Based Swing Trader Indicator Description The ATR Based Swing Trader Indicator is a sophisticated technical analysis tool designed for MetaTrader 5 (MT5) to assist swing traders in identifying potential buy and sell signals based on the Average True Range (ATR) and trend direction. Developed by Rahulkumar Kanani, this indicator leverages volatility and price movement to generate actionable trading signals, making it suitable for traders who aim to capture short- to medium-term price swings in
FREE
This indicator is the mql5 version of the SSLHybrid indicator. MT4 Version Find out more here: https://www.mql5.com/en/users/rashedsamir/seller
Description of TradingView version: This script is designed for the NNFX Method, so it is recommended for Daily charts only.
Tried to implement a few VP NNFX Rules
This script has a SSL / Baseline (you can choose between the SSL or MA), a secondary SSL for continiuation trades and a third SSL for exit trades.
Alerts added for Baseline entries, SSL

การพิจารณาคุณลักษณะ HUD ขณะนี้ผมกำลังมุ่งเน้นไปที่คำอธิบายภาษาอังกฤษสำหรับแดชบอร์ด GAPHUNTER UAD รุ่น Compact HUD ผมกำลังวิเคราะห์คุณสมบัติหลักของรุ่นนี้โดยเฉพาะ เป้าหมายของผมคือการสร้างคำอธิบายผลิตภัณฑ์ที่แสดงจุดขายและประโยชน์ที่เป็นเอกลักษณ์อย่างชัดเจนสำหรับกลุ่มเป้าหมาย เป้าหมายคือการเน้นย้ำถึงความกะทัดรัดและการใช้งาน การวิเคราะห์คุณสมบัติหลัก ตอนนี้ ผมกำลังเจาะลึกฟีเจอร์สำคัญๆ มากขึ้น โดยเฉพาะอย่างยิ่งในบริบทของผู้ใช้ MQL5 Market โดยเน้นที่การติดตามกำไร/ขาดทุนแบบเรียลไทม์ของ Compact HUD และ
FREE

Heikin Ashi Candlestick Indicator for MT5 This custom Heikin Ashi indicator provides a smooth visual representation of market trends by filtering out short-term noise, making it easier to identify potential reversals and trend continuations. Unlike regular candlesticks, Heikin Ashi candles are calculated using averages, resulting in more stable and readable chart patterns. Key Features: Clear and smoothed visualization of price action. Compatible with all timeframes and instruments. Lightwe
FREE

If you love this indicator, please leave a positive rating and comment, it will be a source of motivation to help me create more products <3 How to use Slope Direction Line Uptrend: When the SDL line slopes up and turns from red to green, it shows that the price is trending up. This is also considered a buy signal. Downtrend: When the SDL line slopes down and turns from green to red, it shows that the price is trending down. This is also considered a sell signal. Sideways: When the SDL line mo
FREE

Market Trading Sessions is an indicator that identifies major market sessions such as:
London (09:00 - 18:00 UTC+2) New York (15:00 - 00:00 UTC+2) Sydney (23:00 - 8:00 UTC+2) Tokyo (02:00 - 11:00 UTC+2)
It displays each session’s start and end times, along with its high and low, providing traders with a clearer view of price volatility throughout the day. The indicator offers high customizability, allowing you to adjust session times and modify the plotting style to match your preference.
If yo
FREE

Smart Super Trend Indicator (Free) Turn volatility into opportunity — Catch trends early and trade smarter The Supertrend Indicator is one of the most trusted tools in technical analysis, designed to help traders quickly identify the prevailing market trend and spot potential entry and exit points with precision. Built on price action and volatility, this trend-following indicator adapts dynamically to market conditions, making it a powerful companion for both beginners and experienced traders.
FREE

High Low Swing (HLS) Indicator
The HLS indicator is a technical analysis tool designed to identify swing highs and lows in the market, aiding swing traders in making informed decisions. It offers an adjustable "degree" parameter, allowing you to customize the sensitivity to strong price movements based on current market conditions.
Features:
• Clear Buy/Sell Signals: The indicator plots signals directly on the chart, simplifying trade identification.
• Adjustable Swing Strength: The "degr
FREE
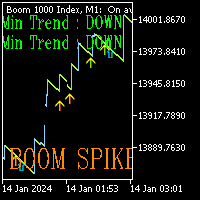
Boom Spike mater is the future for trading Boom markets. It has been designed to run on Boom 300 , 500 and 1000 markets on the 1 minute timeframe. It has 2 different trading modes (Aggressive and Normal) Aggressive mode will plot Yellow and blue arrows. 2 different conditions to help you make the right choice. Enter first trade on yellow arrow and second trade on blue candle. SL in this mode will be 10 Candles from the blue arrow. Normal mode will only plot red arrows on the chart. This mode is

AI SuperTrend Final – Adaptive Intelligence for Smarter Trading
The AI SuperTrend Final is not just another trend indicator—it is a next‑generation trading tool powered by adaptive intelligence. Designed for MetaTrader, this indicator combines the proven logic of SuperTrend with advanced filters such as Moving Average (MA), Average Directional Index (ADX), and a unique self‑learning mechanism. The result is a smart, evolving system that adapts to market conditions and continuously improves its
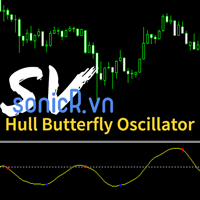
The Hull Butterfly Oscillator (HBO) is an oscillator constructed from the difference between a regular Hull Moving Average ( HMA ) and another with coefficients flipped horizontally . Levels are obtained from cumulative means of the absolute value of the oscillator. These are used to return dots indicating potential reversal points . This indicator draw line in separate window, plus blue dot (for buy signal) when hull oscillator is peak and red when sell signal. It also includes integrate

Flag Pattern pro is a Price Action (PA) analytical tool that scans the continuation patterns known as "Flag and Pennant Patterns" .
Flag and Pennant patterns are continuation patterns characterized by a move in a previous trend direction after a shallow retracement usually below 50% of the original move . Deep retracements can however be sometimes found at the 61.8 % levels. The original move is know as the flag pole and the retracement is called the flag.
Indicator Fundam

Description :
Combination MT5 is a professional indicator based on the Stochastic Oscillator and Average True Range (ATR) technical indicators, thus, you can use it with any currency pair and any timeframe.Trade signals from Combination MT5 are drawn on the main chart in the form of arrows. When a blue arrow appears, then this is a signal to buy, when the red one appears then this is a signal to sell. You can set the alerts on/off. The Stochastic Oscillator and Average True Range (ATR) technica
FREE
The Strat Dashboard – Мультисимвольный Сканер Паттернов для стратегии Strat Роб Смита
Преобразите свой Трейдинг с Анализом Strat по Нескольким Символам в Реальном Времени
The Strat Dashboard — мощный профессиональный индикатор, разработанный специально для трейдеров, работающих по признанной методологии «Strat» Робa Смита. Следите за неограниченным количеством инструментов на разных таймфреймах одновременно, мгновенно находите высоковероятные установки и никогда не пропускайте важный паттерн.
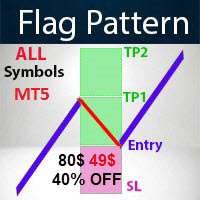
- Real price is 80$ - 40% Discount (It is 49$ now) Contact me for instruction, any questions! Related Product: Gold Trade Expert MT5 , Professor EA - Non-repaint - Lifetime update free I just sell my products in Elif Kaya Profile , any other websites are stolen old versions, So no any new updates or support.
Introduction Flag patterns are an important tool for technical traders. Flags are generally considered to be a period of consolidation where the price of a security is caught in a r

FRONTIER PIVOTS - Geometric Levels Indicator This indicator plots support and resistance levels/ranges on the chart using mathematical calculations. It helps traders identify potential price reaction zones based on geometric patterns. Main Features: Automatically calculates and displays key price levels Plots both support and resistance lines Uses daily price data for level calculation Clean visual presentation with different colors for different level types No repainting - levels remain static

**Experience Smarter Trading with FVG Super Signal**
Unlock simpler, more decisive trading with **FVG Super Signal**, an advanced MT5 indicator from the WinWiFi Robot Series. This powerful tool uniquely combines the Fair Value Gap (FVG) technique with robust trend-following logic.
* **Clear Signals:** Delivers intuitive Buy/Sell alerts, simplifying your trading decisions. * **Universal Compatibility:** Works seamlessly across all assets and timeframes. * **Highly Versatile:** Ideal for all tr
FREE
VWAP Indicator, the short form of Volume Weighted Average Price, is similar to a moving average but takes into consideration the tick volume of the candles. The indicator calculates the moving average multiplying the price of each candle for the tick volume in the candle. Said calculation weighs with more significance price where more transactions were made.
Features: Visual styling customizable Period customizable Ease of use
FREE

Добро пожаловать в будущее торговли с KMeans Price Zones Detector, инновационным индикатором для MetaTrader, который использует мощь машинного обучения для определения ключевых ценовых зон. Этот инструмент использует алгоритм кластеризации KMeans для динамического обнаружения центроидов в ценовых данных, выделяя области, где цены с большей вероятностью встретят поддержку, сопротивление или консолидацию. Инновационный алгоритм KMeans KMeans Price Zones Detector выделяется благодаря продвинутому и
FREE

An “inside bar” pattern is a two-bar price action trading strategy in which the inside bar is smaller and within the high to low range of the prior bar, i.e. the high is lower than the previous bar’s high, and the low is higher than the previous bar’s low. Its relative position can be at the top, the middle or the bottom of the prior bar.
The prior bar, the bar before the inside bar, is often referred to as the “mother bar”. You will sometimes see an inside bar referred to as an “ib” and its m
FREE
Visualize Market Momentum with Precision
MultiMA_ICHIMOKU_STO_Color is a comprehensive technical analysis tool designed to provide clear market signals by combining three powerful indicators into one smart system. This indicator integrates three customizable Moving Averages, key components of the Ichimoku Cloud, and the Stochastic oscillator. Its unique feature is the intelligent candle coloring system that instantly reveals market conditions: Bullish (Blue): Price is above all three MAs AND Sto
FREE
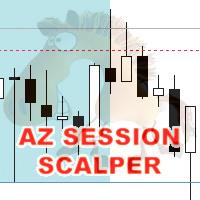
AZ session scalper
A small but useful session indicator, designed primarily for scalping. Enable the session you plan to trade, watch the reaction of the M5/M15 candlesticks to the level of the previous trading session, and enter. We always look at the reaction of the current session to the previous one. For example, if you trade the Americas, enable the European session, and watch how one session takes away liquidity from another. Important: adjust the time to your broker's time zone in the i
FREE
Engulfing Pattern is a free indicator available for MT4/MT5 platforms, its work is to provide "alerts" when a "Bullish" or "Bearish engulfing pattern forms on the timeframe. This indicator comes with alerts options mentioned in the parameter section below. Join our MQL5 group , where we share important news and updates. You are also welcome to join our private channel as well, contact me for the private link. Engulfing Pattern Indicator MT4 Other Products Try our Martini EA with 2 years of liv
FREE
GridLinesX is a lightweight and efficient utility for MetaTrader 5 designed to help traders visualize price levels with precision. Whether you are a Grid Trader, a Scalper, or simply need to mark psychological price levels, GridLinesX automates the process instantly. Forget about drawing manual horizontal lines one by one. Simply define your High/Low range and the grid step (in points), and the tool will generate a clean, customizable grid overlay on your chart. Key Features: Customizable Range:
FREE

This indicator converted from 5 min Buy and Sell Range Filter - guikroth version on TradingView Popularity of the Range Filter
The Range Filter is a very popular and effective indicator in its own right, with adjustments to the few simple settings it is possible to use the Range Filter for helping filter price movement, whether helping to determine trend direction or ranges, to timing breakout or even reversal entries. Its practical versatility makes it ideal for integrating it's signals into a

CandleAvg Pro: Advanced MT5 Indicator for Smarter Trading Visualize dynamic moving averages directly overlaid on candlesticks with precision. Key Features: Customizable MA periods (SMA/EMA) for trend spotting. Color-coded signals: Green for bullish, red for bearish crossovers. Real-time alerts on breakouts and reversals. Compatible with all timeframes and pairs. Boost your edge – spot entries/exits faster. Only $49!
FREE

Целью индикатора Impulse Release является предотвращение торговли в неверном направлении. В то время как Impulse System работает на одном таймфрейме, Impulse Release обрабатывает информацию с двух таймфреймов. Индикатор отслеживает короткий и длинный таймфреймы для нахождения ситуаций одновременного появления сигналов импульсной системы в одном направлении.
Значения цветов баров индикатора: Если на одном таймфрейме сигнал на покупку, а на другом - сигнал на продажу, это означает "Торговля запрещ

Smart Trend pro New - Advanced Trend Indicator with Interactive GUI Professional trend-following indicator with comprehensive visualization and control panel Key Features: Advanced Trend Detection Reliable Half Trend algorithm for precise trend identification Color-coded trend lines (Blue for bullish, Orange for bearish) Customizable amplitude parameter for different trading styles Interactive GUI Panel Real-time market strength visualization (Bulls vs Bears) Current signal display (Buy/Se
FREE

El **Heiken Ashi Smoothed** es una versión suavizada del indicador técnico Heiken Ashi, que se utiliza en el análisis de gráficos de velas para identificar tendencias del mercado y pronosticar movimientos de precios. Este indicador se basa en el promedio de datos de precios para formar un gráfico de velas que ayuda a los traders a filtrar el ruido del mercado.
**¿Para qué sirve?** Este indicador se utiliza para identificar cuándo los traders deben permanecer en una operación y cuándo está por
FREE

When trading price action or using price action triggers such as Pbars, Inside Bars, Shaved Bars, etc. it is important to always wait for the bar/candle to close more than anything else.It is often the case (whether it’s the 4H, hourly, etc) that price action will be dominant in one direction for the majority of the candle only to reverse strongly at the end of the candle. Institutional traders know retail traders are less disciplined than they are. They know a good trading candle pattern coul
FREE

The Simple Market Sessions Indicator helps traders visualize the current status of major forex market sessions: Asian , London , New York , and Sydney . It shows whether each market is Open , Active (based on volume) , or Closed directly on the chart. With customizable session times and a volume threshold, this tool helps traders monitor session activity and volume strength, making it easier to decide the best times to trade.
Key features: Displays status: Open, Active (High Volume), or Closed
FREE

«HiperCube USD INDEX (DXY /USDX) » — это финансовый бенчмарк, представляющий собой производительность определенной группы активов, таких как акции, облигации или сырьевые товары, стоимость которых выражена в долларах США. Эти индексы помогают инвесторам отслеживать и сравнивать производительность определенных секторов или рынков с течением времени. Выражаясь в долларах США, индекс обеспечивает последовательную меру оценки инвестиций независимо от национальной валюты активов или географического
FREE

Prior Cote — это простой, современный и необходимый индикатор для трейдеров, использующих технический анализ на основе уровней предыдущего дня. Он автоматически отображает на графике следующие уровни предыдущей торговой сессии: Открытие Максимум Минимум Закрытие Скорректированная цена (среднее значение между максимумом, минимумом и закрытием) Идеально подходит для: Стратегий разворота и пробоя Анализа уровней поддержки и сопротивления Настроек для внутридневной и свинг-торговли ️ Полностью н
FREE

This indicator draws the Parabolic SAR. Top and bottom lines with customizable colors. With an additional parameter called “Validate Signals”, which identifies false breakouts and changes the color of the line to gray.
Input Parameters: Step ( default is 0.02 ) Maximum ( default is 0.2 ) Applied Price High ( default is High price) Applied Price Low (default is Low price) Validate Signals (boolean value to filter out false breakouts, default is true)
FREE

This indicator show Gann Swing Chart (One Bar) with multi layer wave. 1. Wave layer F1: Gann waves are drawn based on candles. SGann wave(Swing of Gann) is drawn based on Gann wave of wave layer F1. 2. Wave layer F2: Is a Gann wave drawn based on the SGann wave of wave layer F1. SGann waves are drawn based on Gann waves of wave layer F2. 3. Wave layer F3: Is a Gann wave drawn based on the SGann wave of wave layer F2. SGann waves are drawn based on Gann waves of wave layer F3. ---------Vi
FREE
How To Determine If The Market is Strong Or Weak?
Strength Meter uses an Adaptive Algorithm That Detect Price Action Strength In 4 Important Levels! This powerful filter gives you the ability to determine setups with the best probability.
Features Universal compatibility to different trading systems Advance analysis categorized in 4 levels Level 1 (Weak) - Indicates us to WAIT. This will help avoid false moves Weak Bullish - Early signs bullish pressure Weak Bearish - Early signs bearish press

Raymond Cloudy Day Indicator for MT5 – Pivot-Based Reversal and Trend Levels Raymond Cloudy Day Indicator is a pivot-based level indicator for MetaTrader 5 (MT5). It was developed by Ngo The Hung based on Raymond’s original idea and is designed to give a structured view of potential reversal zones, trend extensions and support/resistance levels directly on the chart. The default settings are optimised for XAUUSD on the H1 timeframe, but the indicator can be tested and adjusted for other symbols
FREE
ATT Support and Resistance— лёгкий индикатор для MetaTrader, который в реальном времени находит локальные максимумы и минимумы по фрактальному принципу и автоматически строит по ним значимые уровни поддержки и сопротивления. Убирает «шум» близко расположенных линий и обновляет зоны при каждом новом тике без лишней нагрузки на терминал. Другие разработки: Здесь
Преимущества ATT Support and Resistance: Быстрое выявление ключевых ценовых зон на любом таймфрейме Автоматическая фильтрация близких у
FREE

Introduction Poppsir is a trend-range indicator for metatrader 5 (for now), which distinguishes sideways phases from trend phases.
With this tool it is possible to design a trend following-, meanreversion-, as well as a breakout strategy.
This indicator does not repaint!
The signal of the Poppsir indicator is quite easy to determine. As soon as the RSI and Popsir change their respective color to gray, a breakout takes place or in other words, the sideways phase has ended.
Interpretation
FREE

Индикатор осуществляет поиск и маркировку на графике торговых сигналов "Пятое измерение". Подробное описание графических моделей, формирующих торговые сигналы можно прочитать в главе 8 "Торговля с помощью линии баланса" книги Б. Вильямса "Новые измерения в биржевой торговле". Сигнальные уровни с указанием цены на вход в позицию или установку стоп-лосса, указываются непосредственно на графике. Эта функция создает дополнительные удобства трейдеру в момент выставления отложенных ордеров. Сплошная
FREE

Комплексный инструмент для определения уровней поддержки, сопротивления, разворотов в привязке к торговым сессиям. Тезис индикатора может быть выражен так: «Уровни поддержки и сопротивления, несомненно, сформированы психологическими барьерами участников рынка и оказывают влияние на дальнейшее поведение цены. Но эти барьеры различны у разных групп трейдеров и могут быть сгруппированы по территориальному признаку или по времени проведения торгов». Следуя тезису, индикатор обнаруживает уровни и обр
FREE
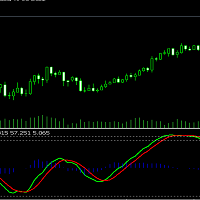
The WaveTrend (LazyBear) indicator is a momentum-based oscillator designed to identify reversal points , trend strength , and overbought/oversold conditions in the market. It is widely used in both Forex and Cryptocurrency trading due to its ability to detect turning points earlier than traditional oscillators like RSI or Stochastic.
(I have Converted from the original TradingView Pine Script version)
FREE
VWAP (Volume Weighted Average Price) is a technical analysis indicator that shows the average price of an asset, weighted by trading volume, over a specified time period. It is calculated by dividing the total dollar value traded (price × volume) by the total volume. Formula: VWAP = sum(PRICE*VOLUME)/sum(VOLUME)
MM vwap have 4 options to set anchor:
Month Week Day Session Indicator will be updated in future.
FREE

Индикатор показывает время до закрытия свечи, а также время сервера на текущем графике. Очень прост в использовании, всего четыре настройки:
Lable Location- расположение таймера на графике; Display server time- показывать время сервера или нет; Sound alert when the candle is closed- использовать звуковой сигнал при закрытии свечи или нет; Colour -цвет цифр таймера. Другие полезные бесплатные и платные продукты можно посмотреть здесь: https://www.mql5.com/ru/users/raprofit/seller
FREE

Automatically unlocks vertical scrolling and fixes chart scaling issues when switching symbols or timeframes. Are you frustrated by MT5 constantly resetting your chart to "Auto Scale"?
Every time you change a symbol or timeframe, MT5 snaps the chart grid to the high/low of the price, locking the vertical axis. To move the chart up or down, you are forced to manually open properties or drag the side scale every single time.
Scale Enforcer solves this instantly.
This utility automatically det
FREE

FX Correlation Matrix is a powerful multi-timeframe dashboard that helps traders analyze real-time currency correlations of up to 28 symbols at a glance. With customizable settings, sleek design, and manual symbol selection option, it enhances trade accuracy, reduces risk, and identifies profitable correlation-based opportunities. Setup & Guide: Download MT4 Version here. Exclusively for you: It's your chance to stay ahead of the market. Follow our MQL5 channel for daily market insights, char

HTF Vision - Higher Timeframe Candle Display Free now, celebrating release of Live Chart Viewer utility https://www.mql5.com/en/market/product/158488
HTF Vision provides traders with an intuitive way to visualize higher timeframe price action directly on their current chart. This powerful indicator overlays candlestick data from selected higher timeframes (H1, H4, or Daily) as customizable boxes, giving you instant context of larger market movements without switching charts. Key Features: Mult
FREE

Description Overview : Session Sentinel Pro is a lightweight, chart-based indicator that watches your account equity live and presents a clear view of daily trading performance. It provides closed and floating P&L, session and per-day maximum drawdown, symbol-level breakdowns, and automatically persists daily summaries to the MT5 Files folder so you can review recent performance across days.
Why it helps : The indicator helps traders stay disciplined by clearly showing intraday performance, max
FREE
SignalFlow Pro - Professional Trend Analysis System SignalFlow Pro is a modern trend-following indicator designed to identify market reversals accurately and timely. Key Features: Dual-Color Trend Lines: Turquoise line - uptrend Fuchsia line - downtrend Clear visual separation for easy trend identification Signal Arrows: Blue arrow (↑) - Buy signal Pink arrow (↓) - Sell signal Arrows appear automatically when trend changes Customizable Parameters: Amplitude (2) - sensitivity level Arrow codes a
FREE

В основу индикатора SMTrendLine положены принципы графического построения полос Боллинджера. Графически Боллинджер представляет собой две линии, ограничивающие динамику цены сверху и снизу соответственно. Это своеобразные линии поддержки и сопротивления, которые большую часть времени находятся на удаленных от цены уровнях. Как мы знаем, полосы Боллинджера схожи с конвертами скользящих средних. Различие между ними состоит в том, что границы конвертов расположены выше и ниже кривой скользящ
FREE
MFI Divergence is a technical indicator that detects regular bullish and bearish divergences between price and the Money Flow Index (MFI) at swing highs and lows. It highlights potential reversal points by drawing clean green (bullish) and red (bearish) arrows directly on the chart. The indicator uses configurable swing detection, customizable MFI period, and an optional MFI threshold filter to show signals only in oversold/overbought zones. Alerts are triggered only once per bar on candle close
FREE

Этот индикатор отображает только верхнюю и нижнюю полосы волатильностного канала в стиле Боллинджера, не отображая центральную скользящую среднюю. Его основная цель — предоставить чистый и гибкий волатильностный конверт, позволяя трейдерам сосредоточиться на поведении цены относительно границ канала, сохраняя при этом полный контроль над визуальным оформлением графика. В отличие от традиционных полос Боллинджера, где средняя скользящая всегда отображается, данный индикатор использует скользящую
FREE
[ MT4 Version ] Order Block Indicator MT5 — Precision Trading Made Simple
Order Block Indicator MT5 is designed to help traders spot powerful reversal zones effortlessly — without cluttered charts or guesswork.
Built for scalping , swing trading , and smart intraday decisions , it highlights active order blocks across multiple timeframes with precision, speed, and full customization. Trade with clarity, save valuable time, and react instantly to market structure changes — even across Forex

Key Price Levels Indicator Indicator that shows the highs and lows for the significant price levels for past periods that could be potentially considered as reaction levels. The indicator displays the following price levels: Yesterday high and low The day before yesterday high and low Two days back high and low Last week high and low Last month high and low Last three month high and low (Quarter) Last year high and low
FREE
Узнайте, как легко и просто купить торгового робота в MetaTrader AppStore - магазине приложений для платформы MetaTrader.
Платежная система MQL5.community позволяет проводить оплату с помощью PayPal, банковских карт и популярных платежных систем. Кроме того, настоятельно рекомендуем протестировать торгового робота перед покупкой, чтобы получить более полное представление о нем.
Вы упускаете торговые возможности:
- Бесплатные приложения для трейдинга
- 8 000+ сигналов для копирования
- Экономические новости для анализа финансовых рынков
Регистрация
Вход
Если у вас нет учетной записи, зарегистрируйтесь
Для авторизации и пользования сайтом MQL5.com необходимо разрешить использование файлов Сookie.
Пожалуйста, включите в вашем браузере данную настройку, иначе вы не сможете авторизоваться.