Смотри обучающее видео по маркету на YouTube
Как купить торгового робота или индикатор
Запусти робота на
виртуальном хостинге
виртуальном хостинге
Протестируй индикатор/робота перед покупкой
Хочешь зарабатывать в Маркете?
Как подать продукт, чтобы его покупали
Технические индикаторы для MetaTrader 5 - 52
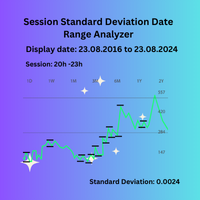
Session Standard Deviation Date Range Analyzer: Evaluate the standard deviation of each bar's price (high, low, close, open, weighted, median, and typical) within defined trading sessions and date ranges, providing detailed insights into price volatility and market behavior. **Note:** When the trading platform is closed, the indicator may not load correctly. To ensure it works, you may need to load the indicator, unload it, and then load it again. **Note:** : This indicator can only be used wit
FREE
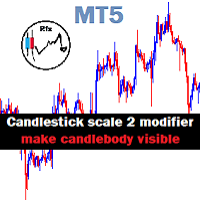
Chart Candlestick scale 2 zoom will visible instead of just a tiny unrecognized line make it look neat and tidy Instruction.
If you don't like the candles colors, you can do so by changing color. read below:
-Colors must be changed in the indicator setting.
-It won't change through the Chart properties to modify.
-After changing the color, save it as template so it wont change the colors to default value.
FREE

The Available Range Bands Technical Indicator draws two lines on the chart indicating the maximum limits (bands) expected for buying and selling for the current period (candle). These limits can be accessed by buffers 0 and 1 respectively.
In addition, it displays in the lower right corner the current average values of the real volatility, the last price, the predicted range of movement available for buying (% and points) and the predicted range of movement available for selling (% and points)
FREE
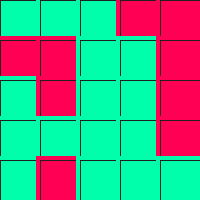
Quickview The Quickview indicator instantly highlights asset variations, delivering crystal-clear market insights at a glance. Effortlessly track multiple assets with visual simplicity, enabling quicker, smarter, and more confident trading decisions daily. ️ Key Features Real-Time Asset Tracking: Instantly monitor multiple assets simultaneously, never missing a critical market move. Flexible and Intuitive Display: Personalize your view, displaying assets exactly as you want—clear, concise, c
FREE
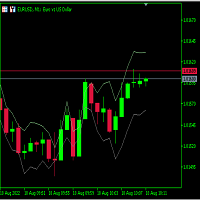
Just learning how to create an indicator from this tutorial .
its just a garbage text to fill the descriptions. Hello there. Hello there Hello there Hello there Hello there Hello there Hello there Hello there Hello there Hello there Hello there Hello there Hello there Hello there Hello there Hello there Hello there Hello there Hello there Hello there Hello there
FREE

Equidistant bands indicator with calculated moving average, allows you to configure the band size and can be used freely as an entry / exit indicator. Buffer 0 = price, buffer 1 = upper band, buffer 2 = lower band. you can also configure the periods of moving averages used in the calculations and also the shift to previous bars in addition to the price that can CLOSE (default) or OPEN. Excellent for fast daily moving pairs and frequent returns.
FREE

This indicator works by plotting fractals on the chart as arrows that can be used as buy or sell signals. It is a great tool for both new and experienced traders as it provides a clear visual representation of the market and helps traders identify fractals. Although it repaints, it can be used quite effectively in conjunction with other tools to filter trading strategies.
We use this indicator in this way in our Royal Fractals EA, which you can purchase on the MQL5 Market: https://www.mql5.com
FREE

Product Description: Adaptive Y-Axis Scaling is a powerful MT5 indicator designed to enhance your trading experience by providing precise control over the Y-axis (price) scaling of your charts. This innovative tool allows you to customize the price scaling by specifying the number of pips from the visible chart's highs and lows. The calculated price range from this input is then used to set the maximum and minimum prices for the open chart, ensuring an optimized and comprehensive view of market
FREE

RXTL indicator Indicator is based on ATR to calculate trend and direction bias Works on all timeframes
Required for the other EA to work accordingly Download and ensure it is placed in the Indicator folder Do inbox me for any questions
installing instructions 1) Download RXTL indicator 2) If indicator does not appear, refresh indicator tab 3) Drag indicator to active chart 4) Use it alongside with other EA
FREE

Индикатор, показывающий моменты пересечения важных уровней индикатора RSI. Может быть использован для поиска моментов пересечения уровней для успешной торговли на отскок или по тренду.
Входные параметры Inform about finding the signal - параметр, отвечающий за получение уведомлений (Alert) о найденном сигнале. По умолчанию - нет RSI period - Период RSI для работы RSI Max - Значение максимальной границы RSI RSI Min - Значение минимальной границы RSI
FREE

Many traders use Price Action as entry and exit signal. Since the beginning of chart analysis, traders have found several candlestick patterns that can indicate possible "behaviors" of the market. Candlestick Pattern indicator is an indicator for MetaTrader platform that can detect many of these patterns and show them on screen or to alert traders about them. though they detect slightly different sets of candle patterns. Candlestick Pattern indicator also has a more modern look compared
FREE

Everyone knows how to analyze the market , which level to buy / sell this is an easy job , which leads to unusual horrible loses , very little few people knows WHEN then enter the market , time is Money , this is the key!!!
This version is a Proof of concept limited version of ZamanCYcles founded here: https://www.mql5.com/en/market/product/81883?source=Site +Market+Product+Page This works Only on 3 Minutes Time frame for 45 Candles Get rest of planets and more than 10 other algorithms to pred
FREE

This indicator closes the positions when Profit. This way you can achieve a goal without determine Take Profit.
Parameters: Profit: the amount of Dolllars you want to close when profit.
Just determine Profit section and open new positions. If Any of your positions reaches above Profit , Indicator will close automatically and you will recieve your Profit.
FREE

This Indicator analyses the Trend and shows signals. When you open the Chart , Indicator shows you Buy or Sell Signal as Alert. Usage: Activate Algo Trading , Activate the Indicator and drag new currencies into chart. Indicator shows you Buy or Sell Signal as Alert.
Results
- Buy Signal
- Sell Signal
- No Signal For any question please don't hesitate to contact.
FREE

# Power Assisted Trend Following Indicator
## Overview
The PowerIndicator is an implementation of the "Power Assisted Trend Following" methodology developed by Dr. Andreas A. Aigner and Walter Schrabmair. This indicator builds upon and improves J. Welles Wilder's trend following concepts by applying principles from signal analysis to financial markets.
The core insight of this indicator is that successful trend following requires price movements to exceed a certain threshold (typically a mul
FREE

Description:
The PTB_MoneyFlow indicator is designed to help traders identify key price levels and potential price movements using Fibonacci retracement levels, alongside tracking recent highs and lows over both short and long periods.
Key Features:
Highs and Lows Tracking:
The indicator calculates and plots the highest and lowest prices over two user-defined lookback periods:
Short Lookback Period: Default is 3 bars.
Long Lookback Period: Default is 144 bars.
These levels are plotted
FREE

SuperTrend Indicator Code Description This code defines a custom indicator for the MetaTrader 5 platform called SuperTrend. The indicator is based on the Average True Range (ATR) to identify upward and downward trends in the market. Code Sections: Indicator Information: Defines the indicator's name, copyright, link, version, etc. Configures the indicator to be displayed in a separate window and have 9 internal buffers and 2 visible plots. Sets the properties of the plots (name, drawing type, col
FREE

MultiTimeAnchor MA — ваш новый помощник для умного и удобного анализа рынка! Этот бесплатный индикатор отображает три различных скользящих средних , каждая из которых настроена на уникальный временной период. Это значит, что вы можете видеть, как ведет себя рынок в короткосрочной, среднесрочной и долгосрочной перспективе — всё одновременно, без необходимости переключаться между графиками. Вы можете выбрать один из нескольких типов скользящих средних, таких как простая скользящая средняя, экспоне
FREE

Standard PVSR is based on Pivot Points.
Steps to Setup the Indicator: Install the Custom Indicator; Set all the Lines Color, Width and Styles; Set visualization to All Timeframe; and DONE
It can be used for: All Pairs: Forex, Cryptocurrencies, Metals, Stocks, Indices etc. All Timeframe All Brokers All type of Trading Style like Scalping, Swing, Intraday, Short-Term, Long-Term etc. Multiple Chart
-->> For any Type of Support, Guidance, Setup Issue, EA Optimization, Input Setup etc. etc
FREE

Индикатор рисует цветную гистограмму из сравнений значений сил быков и медведей. Работает следующим образом: Берутся значения двух индикаторов Bears и Bulls, сравнивается кто сильнее на свече, заполняется столбец. Это всё.
.
FREE

Не каждый сам может написать индикатор. Но у кого угодно может возникнуть идея. Реализовать её самостоятельно поможет индикатор Universal Main Window Free MT5 , принимающий в качестве входного параметра формулу, по которой и будет рисоваться линия индикатора. Данный индикатор предназначен для использования в основном окне графика.
Все индикаторы серии Universal :
В главном окне В дополнительном окне Бесплатные МТ4 Universal Main Window Free МТ5 Universal Main Window Free MT5 МТ4 Universal Sepa
FREE
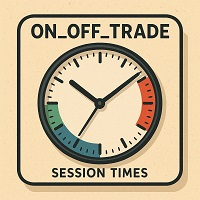
On Off Trade On Off Trade — это индикатор для MetaTrader 5, который выводит прямо на график статус рынка и расписание торговых сессий. Возможности: Показывает, открыт ли рынок сейчас ( СТАТУС: РЫНОК ОТКРЫТ / ЗАКРЫТ ). Отображает активную торговую сессию: время начала и окончания. Если рынок закрыт — указывает, когда начнётся следующая сессия. По желанию можно включить полное расписание всех сессий на неделю с подсветкой текущего дня и активной сессии. Автоматическое обновление данных кажды
FREE

Индикатор SpreadTimeInfo
Многофункциональный индикатор для отслеживания времени сессий, спреда и торговых инструментов.
Основные возможности Отображение времени до открытия/закрытия Американской сессии Таймер обратного отсчета до закрытия текущей свечи Мониторинг спреда с визуальным предупреждением Русскоязычные названия более 100 торговых инструментов Автоматический учёт выходных и праздничных дней
Настройки индикатора
### Американская сессия - Время открытия NY (в вашем времени)
FREE

Pivot Points are used by Forex traders to find support and resistance levels based on the previous day's price action. There are various ways to calculate pivot points, including averaging the open, high, low, and close of the previous day's chart price.
Forex Traders use a combination of pivot points with moving averages to find trading opportunities in the currency markets.
Pivot points are very useful tools that use the previous bars' highs, lows and closings to project support and resist
FREE

Automate Your Strategy! Use the Daily Drop Analyzer Expert Advisor to automatically execute the strategy, with configurable filters, parameters, and order management.
Check it out here: Daily Drop Analyzer EA
The Step Analysis Indicator performs an automated backtest of a simple daily strategy: buy when the price drops a certain percentage from the previous close and sell at the same day's close (or vice versa for short strategy). It tests multiple entry percentages ("steps") and displays the
FREE

Индикатор окрашивает свечи графика в цвета, вычисленные из значений сил быков и медведей. Работает следующим образом: Берутся значения двух индикаторов Bears и Bulls, сравнивается кто сильнее на свече. Это всё.
.
FREE
Drx Spread Monitor – Ваш инструмент для полной прозрачности рынка
Drx Spread Monitor — это мощный индикатор для MT5, который предоставляет трейдерам наглядную визуальную картину текущих и исторических спредов. Особенно полезен на рынках Forex и золота, где спреды могут сильно колебаться; индикатор помогает адекватно оценивать затраты и адаптироваться к рыночным условиям. Основные функции
Гистограмма спреда
Отображение спредов в отдельном окне. Цветовая маркировка для нормальных, высоких и экс
FREE

Не каждый сам может написать индикатор. Но у кого угодно может возникнуть идея. Реализовать её самостоятельно поможет индикатор Universal Separate Window Free MT5 , принимающий в качестве входного параметра формулу, по которой и будет рисоваться линия индикатора. Данный индикатор предназначен для использования в дополнительном окне графика.
Все индикаторы серии Universal :
В главном окне В дополнительном окне Бесплатные МТ4 Universal Main Window Free МТ5 Universal Main Window Free MT5 МТ4 Univ
FREE

Display the date, time and price according to the movement of the mouse cursor on the chart This is useful for discretionary trading.
It is an indispensable tool for verifying and studying past market prices and trades. Characteristic Date,Time and Price are displayed.
The value follows the movement of the mouse.
You can change the color of the text. Please refer to the video on youtube. For MT5 only.
FREE

Realized Volatility Indicator Description The Realized Volatility Indicator measures the actual volatility observed in the market over a specified period.
Unlike implied volatility (which is based on options pricing), realized volatility is based directly on historical price movements, offering a pure and objective view of market turbulence. This indicator can be used to: Assess market conditions, Optimize risk management, Fine-tune trading strategies based on volatility behavior. Key Features
FREE

Индикатор Chandelier Exit, разработанный Чаком ЛеБо (Chuck LeBeau) описан в книге "Трейдинг с доктором Элдером. Энциклопедия биржевой игры" . Этот индикатор вычисляет уровень стопов для длинных позиций от наивысшей цены, достигнутой в течение ралли восходящего тренда. Он назван по аналогии с канделябром, висящим на наивысшей точке комнаты. Для расчета Chandelier Exit использует несколько индикаторов Average True Range (ATR), вычитая их значения из наивысшей цены при начале торговли.
Индикатор

Одно из ключевых правил торговли - никогда не следует сдвигать стопы в направлении увеличения риска.
В этом индикаторе последовательность стопов сужается автоматически, они появляются в виде ряда точек, уменьшающих риски. Вы сможете использовать их для при совершении сделки и каждый день увеличивать их до тех пор, пока цена не заденет стоп. Если входить в позицию не в самом начале новой последовательности, то есть риск близкой установки стопа.
Индикатор Chandelier Long Entries имеет те же парам

Индикатор Chandelier Exit, разработанный Чаком ЛеБо (Chuck LeBeau) описан в книге "Трейдинг с доктором Элдером. Энциклопедия биржевой игры" . Этот индикатор вычисляет уровень стопов для коротких позиций от наименьшей цены, достигнутой в течение ралли нисходящего тренда. Для расчета Chandelier Exit использует несколько индикаторов Average True Range (ATR), вычитая их значения из наименьшей цены.
Индикатор Chandelier Stops отличается от традиционных стопов тем, что он может сдвигаться против позиц

Одно из ключевых правил торговли - никогда не следует сдвигать стопы в направлении увеличения риска.
В этом индикаторе последовательность стопов сужается автоматически, они появляются в виде ряда точек, уменьшающих риски. Вы сможете использовать их для при совершении сделки и каждый день уменьшать их до тех пор, пока цена не заденет стоп. Если входить в позицию не в самом начале новой последовательности, то есть риск близкой установки стопа. Индикатор Chandelier Short Entries имеет те же парамет

Индикатор Elder-Ray базируется на индикаторах Bulls Power и Bears Power , как описано в книге "Трейдинг с доктором Элдером. Энциклопедия биржевой игры" . Индикатор отслеживает относительную силу быков и медведей, измеряя величину отклонений максимальной и минимальной цен бара от среднего значения цены.
Индикатор Elder-Ray разработан Александром Элдером и назван так по аналогии с рентгеновскими лучами (x-rays). Он показывает структуру сил быков и медведей. Elder-ray представляет собой комбинацию

Индикатор MACD XOver разработан Джоном Брунсом (John Bruns) для предсказания цены, при которой гистограмма MACD изменит направление. Этот индикатор отображается на один бар в будущее, позволяя вашей стратегии (если она использует MACD) предсказывать разворотные ценовые точки на следующем баре. Если прогнозируемая цена закрытия больше значения индикатора, то гистограмма MACD будет возрастать, если прогнозируемая цена закрытия меньше значения индикатора, гистограмма MACD будет убывать. Этот индика

Индикатор Market Thermometer описан в книге "Трейдинг с доктором Элдером. Энциклопедия биржевой игры" .
Он измеряет степень волатильности рынка на основе внутридневных диапазонов. Если температура рынка начинает превышать среднюю или остается ниже средней в течение нескольких дней, это является торговым сигналом.
Параметры: Thermometer_EMA_Length (22) – Длина скользящей средней для расчета температуры рынка. Значение по умолчанию 22 равно среднему значению торговых дней в месяце. Spike_Alert_Fa

SafeZone - это метод установки стопов на основе текущей волатильности за пределами уровня рыночного шума. Он описан в книге "Трейдинг с доктором Элдером. Энциклопедия биржевой игры" . При восходящем тренде SafeZone определяет величину шума как часть текущего бара, расширенная до цены Low предыдущего бара в направлении, противоположном направлению преобладающего тренда. Величина уровня рыночного шума усредняется за период времени и умножается на коэффициент, указанный трейдером.
Для длинных пози

Одно из ключевых правил торговли - никогда не следует сдвигать стопы в направлении увеличения риска. В данном индикаторе последовательность стопов сужается автоматически. Они появляются в виде ряда точек цен, уменьшающих риски, сама последовательность сужается до сближения с ценой.
При открытии позиции в точке, не являющейся начальной точкой новой последовательности, может получиться так, что стоп размещен слишком близко. Точки стопов указывают вам начальное значение уровня стопов для каждого б

SafeZone - это метод установки стопов на основе текущей волатильности за пределами уровня рыночного шума. Он описан в книге "Трейдинг с доктором Элдером. Энциклопедия биржевой игры" . При нисходящем тренде SafeZone определяет величину шума как часть текущего бара, расширенная до цены High предыдущего бара в направлении, противоположном направлению преобладающего тренда. Величина уровня рыночного шума усредняется за период времени и умножается на коэффициент, указанный трейдером.
Для коротких по

Одно из ключевых правил торговли - никогда не следует сдвигать стопы в направлении увеличения риска. В данном индикаторе последовательность стопов сужается автоматически. Они появляются в виде ряда точек цен, уменьшающих риски, сама последовательность сужается до сближения с ценой.
При открытии позиции в точке, не являющейся начальной точкой новой последовательности, может получиться так, что стоп размещен слишком близко. Точки стопов указывают вам начальное значение уровня стопов для каждого б

Индикатор Smoothed ROC (Rate of Change), разработанный Фредом Шуцманом (Fred Schutzman), описан в книге "Как играть и выигрывать на бирже" . Индикатор рассчитывает скорость изменения экспоненциальной скользящей средней от цен закрытия. При смене направления тренда он помогает идентифицировать и подтвердить изменение тренда.
Параметры: Smoothing_EMA_Length (13) – Период усреднения EMA; ROC_Period (21) – Период расчета индикатора Rate of Change.

Индикатор Reverse Bar раскрашивает разворотные бары согласно торговой стратегии Б. Вильямса, описанной в книге "Торговый Хаос 2" . Бар медвежьего разворота окрашивается в красный или розовый.(красный – более сильный сигнал) Бар бычьего разворота окрашивается в синий или голубой цвет.(синий – более сильный сигнал) Рекомендуется использовать на таймфреймах H1 и более.
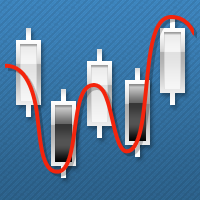
Незаменимый индикатор скальпера - показывает моменты, когда можно спокойно взять на рынке от 10 пунктов прибыли, рискуя при этом всего лишь 2 пунктами. Позволяет за сутки очень сильно увеличить депозит, если правильно использовать мани-менеджмент.
Индикатор имеет всего лишь один настраиваемый параметр - период расчета для определения тренда. Когда появляется сигнал индикатора - выставляем отложенный ордер на 2 пункта выше текущей цены на покупку или на 2 пункта ниже на продажу. Стоп-лосс - 2-3 п

Компоненты: Зеленая линия: Линия цены RSI Красная линия: Линия торгового сигнала Синее заполнение: Полоса волатильности Желтая линия: Основная линия рынка Визуальные сигналы: Направление тренда: Краткосрочное: Зеленая выше красной: Цена растёт. Красная выше зеленой: Цена падает. Общее: Желтая линия колеблется между уровнями 32 и 68. Обратите внимание на отскоки от этих уровней – возможны развороты. Покупайте, если цена выше желтой линии, и продавайте, если ниже. Сила рынка и волатильность: Кратк

----------------------------------------------------------------------------------------- This is a trend indicator, as you can see here. When the white line is above the red, it means a bull market. Conversely, the white line below the red line is a bear market. This index is suitable for long - term trading and is suitable for most trading varieties. --------------------------------------------------------------------------------------------

Индикатор показывает сигналы на покупку и продажу. При закрытии бара и выполнении торговых условий рядом на цене закрытия бара появляется стрелка вверх (сигнал на покупку) или вниз (сигнал на продажу). Индикатор работает на всех таймфреймах. Во входных параметрах можно указать режим звукового оповещения при появлении сигнала.

Этот индикатор основан на классическом индикаторе Moving Average (MA). Индикатор MA позволяет идентифицировать тренд и распознать его изменения. Индикатор MTF-MA показывает данные индикатора Moving Average с четырех таймфреймов, указанных во входных параметрах. Параметры по умолчанию: TF1 = 1; TimeFrame2b = true; TF2 = 5; TimeFrame3b = true; TF3 = 15; TimeFrame4b = true; TF4 = 60; InpPSARStep = 0.02; InpPSARMaximum = 0.2; Значения TF1-TF4 могут находиться в следующих диапазонах: TF1 - от M1 (1)

Этот индикатор основан на классическом индикаторе Commodity Channel Index (CCI). Индикатор MTF-CCI показывает данные индикатора CCI с четырех таймфреймов, указанных во входных параметрах. Параметры по умолчанию: TF1 = 1; TimeFrame2b = true; TF2 = 5; TimeFrame3b = true; TF3 = 15; TimeFrame4b = true; TF4 = 60; InpPSARStep = 0.02; InpPSARMaximum = 0.2; Значения TF1-TF4 могут находиться в следующих диапазонах: TF1 - от M1 (1) до H4 (240); TF2 - от M5 (5) до D1 (1440); TF3 - от M15 (15) до W1 (1008
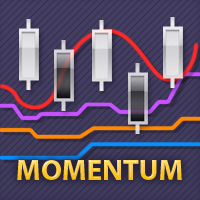
Этот индикатор основан на классическом индикаторе Momentum. Индикатор MTF-Momentum показывает данные индикатора с четырех таймфреймов, указанных во входных параметрах. Параметры по умолчанию: TF1 = 1; TimeFrame2b = true; TF2 = 5; TimeFrame3b = true; TF3 = 15; TimeFrame4b = true; TF4 = 60; InpPeriod = 14; InpappPRICE = 0; Значения TF1-TF4 могут находиться в следующих диапазонах: TF1 - от M1 (1) до H4 (240); TF2 - от M5 (5) до D1 (1440); TF3 - от M15 (15) до W1 (10080); TF4 - от M30 (30) до MN1

Индикатор показывает на графике свечную модель Pin Bar.
Медвежьи пины раскрашиваются в красный цвет, бычьи пины в синий цвет. При появлении нового Pin Bar индикатор выдает алерт. Рекомендуется использовать на таймфреймах H1 и более. Наилучший сигнал к покупке/продаже, когда Pin Bar формируется рядом с уровнем поддержки/сопротивления.
Данная версия стохастика показывает насколько реально взять тот профит в пунктах, который желает трейдер. Он заносится в настройки, и стохастик автоматом показывает возможные варианты для того рынка, на графике которого он стоит. А вариантов значительно больше и информация более обширная, чем у обычного стохастика (это видно на скриншоте). Сигналы: Желтый канал отсутствует (боковое движение, вход нежелателен). Желтый канал сужается (рынок начал движение в какую-либо сторону). Желтый канал расшир

Индикатор корреляции Спирмена с улучшенными сигналами входа и разворота Вертикальные линии показывают бары пересечения линии корреляции Спирмена с уровнями CrossBuy и CrossSell. Значения уровней CrossBuy и CrossSell можно регулировать в соответствующих внешних параметрах. Каждая вертикальная линия обозначает начало зоны перекупленности или перепроданности. Эти вертикальные линии являются сигналами входа (красные - Sell, зеленые - Buy).
В момент появления вертикальной линии для ее бара определяе

Volume-Weighted Moving Average (VW-MA) это скользящая средняя, взвешенная по объему. Стандартные скользящие средние используют цены и просто игнорируют торговые объемы. Индикатор Volume-Weighted Moving Average исправляет данную ситуацию. Учтите, что в отличие от фондового рынка, рынок Forex не централизован. Ордеры и объемы у разных брокеров свои. Вследствие этого объемы, используемым индикатором Volume-Weighted Moving Average, зависят от вашего брокера. Однако, ECN-счета являются выходом из сит

Volume Weighted MACD
Инидкатор Volume Weighted MACD (VW-MACD) был создан Баффом Дормайером и описан в его книге "Инвестирование и Анализ Объема" (Investing With Volume Analysis). Он представляет собой конвергенцию и дивергенцию средневзвешенных по объему ценовых трендов. Использование объема делает VW-MACD более чувствительным и надежным по отношению к традиционному MACD. Что такое MACD (Moving Average Convergence Divergence)? Moving Average Convergence Divergence был создан Джеральдом Аппелем

Данный индикатор предназначен для сравнения силы валютных пар. Индикатор сравнивает валютные пары. Трендовая линия в Currency Strength рисуется на основе всех выбранных валютных пар, что позволяет отчетливее видеть движения рынка. Чем выше линия валютной пары, тем больше ее сила. Входные параметры: Вы можете выбрать 3 пары для сравнения; Вы можете указать базовую дату - дату начала расчетов силы валютных пар.
Tails - это индикатор, который предсказывает, где произойдет отскок цены при достижении максимума дневной свечи. Индикатор следует использовать на таймфреймах ниже D1. По умолчанию индикатор рисует 2 линии сопротивления и поддержки. При необходимости можно включить отрисовку 3 линий сопротивления и поддержки, выставив значение true для параметра Extended_Levels. Входные параметры Extended_Levels - показать дополнительные линии на графике; Clr_Support - цвет линий поддержки; Clr_Resistance - цвет

Только что открыли позицию, а цена резко пошла в другую сторону..Что делать? Просто потерпеть, усредниться или отстопиться (закрыться) и снова войти в сделку, но уже в противоположную сторону? Как поступить...а может просто снимать сливки и торговать по разворотным импульсам ….в этом Вам поможет и подскажет Индикатор тенденций и разворотов на базе коллекции паттернов советника ReversMartinTral https://www.mql5.com/ru/market/product/28761
который кроме рекомендаций и сигналов реверса включа

Появилось желание торговать движение, пробой на самой высокой волатильности, или запустить советника-усреднителя торговать боковик в тихой низковолатильной гавани тогда этот продукт для Вас! Индикатор анализирует 28 валютных пар (основные и кроссы) и в зависимости от выбранных настроек покажет самые высоковолатильные (max) или наоборот (min). Как измерить волатильность? Существует 2 способа. Первый это измерить рендж заданного количества последних баров (bar). Второй замерить о

Индикатор показывает на графике модели свечного паттерна "Вечерняя звезда", "Утренняя звезда".
Вечерняя звезда окрашивается в красный или розовый цвет. Утренняя звезда окрашивается в синий или голубой цвет.
Входные параметры: Max Bars – количество баров, рассчитанное на графике. Make Signal Alert – использовать алерт. Send Push Notification - отправлять уведомление на мобильный терминал Type of rules pattern – тип модели определения паттерна (Hard – с контролем длины теней второго бара). Если

Индикатор показывает динамику формирования дневного диапазона в виде гистограммы, а так же среднее значение дневного диапазона за установленный период. Индикатор является полезным вспомогательным инструментом для трейдеров, торгующих внутри дня.
Настройки N Day - период для расчета среднего значения дневного диапазона. Level Indefinite - уровень неопределённости. Level Confidence - уровень уверенности. Level Alert - сигнальный уровень. При его пересечении выдаётся алерт.

Индикатор Twiggs Money Flow Index был создан Коллином Твиггсом. Он сделан на основе Chaikin Money Flow Index, но использует истинные диапазоны вместо разницы максимумов и минимумов, что позволяет предотвратить шпильки при появлении гэпов. Он также использует сглаженную экспоненциальную среднюю для предотвращения шпилек в объемах, искажающих результаты. Экспоненциальная скользящая средняя - та, что описана Веллесом Вайлдером, использующаяся во многих его индикаторах. Когда Twiggs Money Flow Index
Money Flow Index - это мультитаймфреймовый индикатор, который отображает Money Flow Index, построенный на любом таймфрейме. Он помогает сфокусироваться на долгосрочном движении денежных средств перед анализом движения на текущем таймфрейме. Вы можете использовать столько копий Money Flow Index Multiple timeframes, сколько необходимо. Посмотрите на скриншоты, в одном и том же окне отображаются индикаторы Money Flow Index, построенные на M30 / H1 / H4.

TTMM – "Time To Make Money" – Время Когда Трейдеры На Биржах Делают Деньги Индикатор торговых сессий – ТТММ, показывает следующую Торговые сессии: Американскую, Европейскую, Азиатскую и Тихоокеанскую. (Внимание: сессии показываются только на 5 предыдущих дней и на текущий. Количество дней может меняться в зависимости от праздников – они не отображаются в терминалах. Также сессии не отображаются в субботу и воскресенье). Основные часы работы бирж (время до начала или до окончания), таких как: NZX

Профессиональный инструмент лучших биржевых трейдеров теперь доступен и на платформе MetaTrader 5 . Индикатор Actual depth of market chart визуализирует стакан биржевых заявок в виде гистограммы, помещенной на график цены и обновляющейся в реальном времени. Внимание! Свежее обновление сделано по просьбе наших пользователей!
Теперь индикатор Actual Depth of Market отображает текущее соотношение объемов заявок на покупку и продажу (B/S ratio). Показывается доля объема заявок каждого вида в общем

ACPD – «Auto Candlestick Patterns Detected» - Индикатор автоматического обнаружения свечных моделей. Индикатор свечных моделей ACPD умеет: Определять 40 разворотных свечных моделей Каждый сигнал показывается стрелкой, направленной в предполагаемом дальнейшем движении графика. Каждая подпись модели содержит: ее название , силу сигнала "S" , коэффициент тренда "T" . Отключение каждой модели. Предусмотрена настройка некоторых параметров составляющих модели. Модели, вошедшие в индикатор ACPD – «Auto

Индикатор AABB - Active Analyzer Bulls and Bears (Активный Анализатор Быков и Медведей) предназначен для индикации состояния, насколько та или иная свеча является бычьей или медвежьей. Индикатор хорошо себя показал на графике H4 пары EURUSD с настройками по умолчанию. Стратегия работы индикатора Когда линия индикатора пересекает уровень в 80% вверх, мы покупаем. Когда линия индикатора пересекает уровень в 20% вниз, мы продаем. Важно, чтобы покупка или продажа совершалась, когда сформировалась св
Индикатор Envelopes , построеный на тиковом графике цены. При запуске необходимо подождать прихода требующегося для расчетов объема тиковых данных. Параметры: Averaging period - период усреднения. Smoothing type - метод усреднения. Может быть любым из значений ENUM_MA_METHOD . Option prices - используемая цена. Может быть Ask, Bid или (Ask+Bid)/2. Deviation of boundaries from the midline (in percents) - отклонение от основной линии в процентах. Price levels count - количество отображаемых ценовы

Индикатор Relative Strength Index построен на тиковом графике цены. При запуске необходимо подождать прихода требующегося для расчетов объема тиковых данных. Параметры: RSI Period - период усреднения. overbuying level - уровень перекупленности. overselling level - уровень перепроданности. calculated bar - количество баров на графике для расчета индикатора. Далее следуют параметры, регулирующие веса сигналов осциллятора RSI (от 0 до 100). Их описание можно посмотреть в Справочнике MQL5 в разделе
Индикатор Average Directional Movement Index , построенный на тиковом графике цены. При запуске необходимо подождать прихода требующегося для расчетов объема тиковых данных. Параметры: Period - период усреднения. Сalculated bar - количество баров на графике для расчета индикатора. Номера буферов: 0 - MAIN_LINE, 1 - PLUSDI_LINE, 2 - MINUSDI_LINE.
А знаете ли вы, почему MetaTrader Market - лучшее место для продажи торговых стратегий и технических индикаторов? Разработчику у нас не нужно тратить время и силы на рекламу, защиту программ и расчеты с покупателями. Всё это уже сделано.
Вы упускаете торговые возможности:
- Бесплатные приложения для трейдинга
- 8 000+ сигналов для копирования
- Экономические новости для анализа финансовых рынков
Регистрация
Вход
Если у вас нет учетной записи, зарегистрируйтесь
Для авторизации и пользования сайтом MQL5.com необходимо разрешить использование файлов Сookie.
Пожалуйста, включите в вашем браузере данную настройку, иначе вы не сможете авторизоваться.