Смотри обучающее видео по маркету на YouTube
Как купить торгового робота или индикатор
Запусти робота на
виртуальном хостинге
виртуальном хостинге
Протестируй индикатор/робота перед покупкой
Хочешь зарабатывать в Маркете?
Как подать продукт, чтобы его покупали
Технические индикаторы для MetaTrader 5 - 30

Статистический индикатор для метатрейдер 5 TradingStatisticPro осуществляет сбор статистических данных по вашей торговле, что облегчает оценивать эффективность торговли, полученный профит и риски. Индикатор компактно размещен в углу основного чарта терминала и отображает следующую информацию: 1. Полученную прибыль. 2. Максимальную просадку. 3. Фактор восстановления. 4. Профит фактор. 5. Соотношение прибыльных и убыточных сделок (winrate). 6. Средняя прибыль и убыток по закрытым сделкам. 7. Профи
FREE

https://www.mql5.com/en/users/gedeegi/seller
The design features a bold orange countdown timer icon set against a dark gray background, with the clock hands pointing toward the upper right. Below the timer, a candlestick chart displays green and red bars that represent price movements across different time periods, with sharp detailing and balanced composition. The countdown time of "05:17" is prominently displayed next to the clock, adding a dynamic and informative element to the image.
FREE

Introduction MT5 ships with the Envelopes indicator. This indicator allows you to create equidistant bands from a moving average by specifying a “deviation.” Unfortunately, the deviation is an arbitrary number. You might determine that 0.220 works well to contain 95% of close prices for USDCHF,H1, but when you change the period to H4, most of the bars are now outside the bands. So, I created this self-tuning indicator. Instead of specifying a percent “deviation,” you specify the percent of bars
FREE

Quasimodo Genie Indicator for MetaTrader 5 Introducing the Quasimodo Genie , a technical analysis indicator for MetaTrader 5 that is designed to automatically identify the Quasimodo or "Over and Under" pattern on your charts. This tool provides visual signals based on the structure of this popular chart pattern. This indicator is built to assist with pattern recognition and analysis by highlighting key swing points. It also offers a range of customizable settings, allowing you to fine-tune the
FREE

SecScale Multi‑Symbol Viewer
Точность на секундах × Мульти‑активный анализ × Автономный торговый интерфейс
Увидьте истинный рыночный импульс по любому активу — мгновенно.
Что такое SecScale Multi‑Symbol Viewer?
SecScale — это индикатор нового поколения, созданный для сравнения форекса, криптовалют, индексов и CFD на единой нормализованной шкале — то, чего обычные индикаторы сделать не могут.
Секундный движок фиксирует микро‑движения в реальном времени (на M1) Ценовое движение нормали
FREE

VWAP WAVE [Riz] - MT5 Indicator Advanced VWAP Divergence Detection System
VWAP Wave is a professional-grade Volume Weighted Average Price indicator with built-in divergence detection system. It identifies high-probability reversal and continuation signals by analyzing price-VWAP relationships across multiple timeframes.
FREE

The MP Andean Oscillator is used to estimate the direction and also the degree of variations of trends. It contains 3 components: Bull component, Bear component and Signal component. A rising Bull component indicates that the market is up-trending while a rising Bear component indicates the presence of down-trending market. Settings: Oscillator period: Specifies the importance of the trends degree of variations measured by the indicator. Signal line per: Moving average period of the Signal line
FREE

Value Chart indicator presents the Price evolution in a new form. This indicator, Price Momentum , was developed taking all the calculations presented in the book " Dynamic Trading Indicators " by Mark W. Helweg and David Stendahl (2002). The technique involves de-trended Prices from a user-defined Period of analysis and the addition of a Volatility index correction. The result is an Oscillator with 3 zones: Fair Price Value, Overbought/Oversold and Extremely Overbought/Oversold zones. Adding th
FREE

A price increase indicator calculates range and price changes in percent. It is very useful when you look at the chart.
ldkfoosvkdlsdf
It helps you make decisions to open deals when the price is at the lowest level do not open sell deals and open buy deals and when it is at the highest level do not open buy deals open sell deals, it is not an entry signal for deals but to know the lowest and highest price that will reach in an hour or four hours a day or a week or a month as a whole for the per
FREE

Get ALERTS for break of your TRENDLINES, SUPPORT LINES, RESISTANCE LINE, ANY LINE!!
1. Draw a line on the chart (Trend, support, resistance, whatever you like) and give it a name (e.g. MY EURUSD line) 2. Load the Indicator and input the Line Name the same name in Indicator INPUT so system knows the name of your line (= MY EURUSD line) 3. Get Alerts when Price breaks the line and closes Works on All Time frames and charts LEAVE A COMMENT AND IF THERE IS ENOUGH INTEREST I WILL WRITE AN EA WHICH W
FREE

Индикатор Average Price производит расчет средних цен открытых позиций BUY и открытых позиций SELL, с учетом размера открытых позиций, комиссий и свопов. Индикатор строит среднюю линию открытых позиций BUY, после пересечения которой, ценой снизу вверх, суммарная прибыль по всем позициям BUY по текущему инструменту, становится больше 0. Индикатор строит среднюю линию открытых позиций SELL, после пересечения которой, ценой сверху вниз, суммарная прибыль по всем позициям SELL по текущему инструмен

Индикатор показывает текущий таймфрейм и название символа. Так же есть возможность включить показание времени до окончания текущего бара. В настройках можно указать: - расположение индикатора по отношению к окну терминала. верхний левый, верхний правый, нижний левый и нижний правый - ряд расположения отображения текста так чтобы не налазили друг на друга надписи - цвет - шрифт - размер шрифта.
FREE
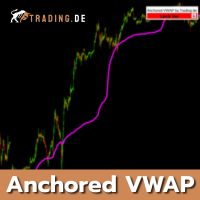
Specially developed Anchored VWAP for MetaTrader 5 (MT5) from Trading.de. To match our day trading strategy, you can place an Anchored VWAP in your chart. The Volume Weighted Average Price indicator can be adjusted in color and also fixed on the chart. It is possible to choose real volume as well as no real volume in the settings. The indicator is best suited for day trading in a 1-minute chart, as you learn in training at Trading.de.
You can use "E" on your Keyboad to lock/unlock the AVWAP, to

Spike Trap is a simple but powerful tool that identifies sharp market spikes and waits for price pullbacks to highlight high-probability entry and exit zones. By combining volatility detection with smart retracement logic, it helps traders capitalize on fast price moves with precision and reduced risk. Ideal for scalping or short-term trading in volatile markets. Spike Trap can be used to trade synthetic indices such as Boom and Crash offered by Deriv Broker as well as Pain and Gain indices offe

Crash 1000 Scalping Indicator for the Crash 1000 Deriv Synthetic Index. Introduction The Crash 1000 Scalping Indicator is a specialized tool designed for the Crash 1000 index on the Deriv Synthetic market. This indicator is particularly useful for scalping on the M1 timeframe, helping traders to identify precise entry and exit points for buy positions. It is designed to be non-repainting, providing clear signals with audible alerts and push notifications, and is compatible with mobile devices th

Alpha Wave Indicator: Pure Precision! This is a tool that will take your trading to the next level. Believe me!! This advanced tool uses a Gaussian window to smooth price data, plotting green upper and red lower bands to identify key trends. With customizable bandwidth, multiplier, and lookback period, plus crossover arrows for clear signals, Alpha Wave helps you navigate the market with confidence. Perfect for traders seeking reliable, non-repainting insights, it can be used on multiple currenc

МНОГОВРЕМЕННАЯ СКОЛЬЗЯЩАЯ СРЕДНЯЯ OSW
(МЕТАТРЕЙДЕР 5)
Этот индикатор позволит вам добавлять скользящие средние всех типов конфигурации, с той разницей, что если вы находитесь на таймфрейме, вы можете добавить скользящую на более высоком уровне, например, если вы находитесь на 5-минутном таймфрейме. и хотите увидеть экспоненциальную скользящую среднюю 20 с временностью 15 минут, 1 час и 4 часа, только настроив правильные параметры в меню индикатора, вы сможете увидеть их, как показано на изобр

MACD is probably one of the most popular technical indicators out there. When the market is trending, it actually does a pretty good job, but when the market starts consolidating and moving sideways, the MACD performs not so well. SX Impulse MACD for MT4 is available here . Impulse MACD is a modified version of MACD that works very well for trading Forex, stocks, and cryptocurrencies. It has its own unique feature which perfectly filters out the values in a moving average range and enables it

"Volality 75 Boom Crash VIX" - инструмент расширенного анализа, предназначенный для выявления ключевых зон прорыва в парах волатильных активов и бум-катастроф. VIX - это инструмент расширенного анализа, предназначенный для выявления ключевых зон прорыва в волатильных парах активов и бум-катастроф. Индикатор ориентирован на выявление моментов высокой волатильности на рынке.
Данный индикатор идеально подходит как для скальпинга, так и для свинговой торговли.
"Volality 75 Boom Crash VIX" - это н
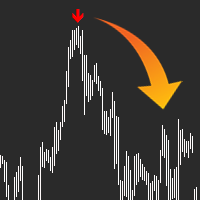
QUICK OVERVIEW: Use AI to predict the markets with AI Arrow, the ultimate trading tool, let it manage the probabilities and send you a simple signal in the form of an arrow, ready to trade, no complex configurations. The indicator will analyze the market and let you know when a potential movement will happen, sometimes it takes some extra bars for the movement to happen as it can't predict the exact top/bottom every time. Arrow will appear at the start of a new bar and alert you, so you have ti

TickVelocity with Smart Alert : Real-Time Buyer vs Seller Speed Dominance **️ Discover the raw energy of the market with the TickVelocity with Smart Alert indicator. Go beyond standard volume and price action to measure the speed and momentum of price changes, revealing the true underlying dominance of buyers or sellers in real-time. This essential tool provides a clear, separate-window view of market dynamics and features a sophisticated Smart Alert System to catch explosive moves early!
FREE

Индикаторы для трендовых!
Торговая система, построенная на трех скользящих средних. Торгуйте по тренду и позвольте прибыли расти. Necessary for traders: tools and indicators Waves automatically calculate indicators, channel trend trading Perfect trend-wave automatic calculation channel calculation , MT4 Perfect trend-wave automatic calculation channel calculation , MT5 Local Trading copying Easy And Fast Copy , MT4 Easy And Fast Copy , MT5 Local Trading copying For DEMO Easy And Fast Copy , MT
FREE

Balance Levels is an easy-to-use trading indicator that provides clear buy and sell signals along with dynamic price levels, helping traders plan their entries and exits with more confidence. The tool is highly flexible – it can be used as a standalone strategy or integrated into any existing trading system. It works on all timeframes and across all markets: Forex, Gold, Indices, Crypto, or Stocks. Balance Levels suits every trading style – from scalping and intraday, to swing trading and even l

If you love this indicator, please leave a positive rating and comment, it will be a source of motivation to help me create more products <3 Key Takeaways Fisher is a repaint indicator. It recalculates previous bars when new bars become available. Modified to avoid repainting to accommodate some merchants. Fisher indicator is quite a simple histogram indicator that detects the trend's direction and strength and signals about trend changes. Traders look for extreme readings to signal potential p
FREE
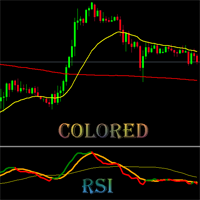
This is Colored RSI Scalper Free MT5 -is a professional indicator based on the popular Relative Strength Index (RSI) indicator with Moving Average and you can use it in Forex, Crypto, Traditional, Indices, Commodities. Colors are made to make trend, and changing trend more easily. Back test it, and find what works best for you. This product is an oscillator with dynamic overbought and oversold levels, while in the standard RSI, these levels are static and do not change.
This allows Colored RSI

The StrobeIndicatorDynamic is the indicator counterpart to the Strobe Expert Advisor, delivering a sophisticated trading strategy that generates precise entry signals through the integration of multiple technical indicators. Designed for MetaTrader 5, this advanced tool combines robust analytical capabilities with a streamlined user experience, catering to traders seeking both performance and ease of use. Key Features: Optimized Input Presets : Features a simplified input structure with five dis

Этот индикатор предназначен для более быстрого и легкого просмотра множества графиков в разных временных масштабах. Отслеживание времени и цены на нескольких графиках Измените символ на одном графике, и все остальные графики того же символа также будут изменены. Простота в использовании, быстрое освоение Индикатор позволяет определить цену и время, когда указатель мыши находится на текущем графике, на всех других графиках, открытых на том же символе. Это позволяет быстро просматривать информацию

Stochastic Alert Indicator for MetaTrader 5
The Stochastic Alert Indicator is a powerful and customizable tool designed for the MetaTrader 5 platform, perfect for traders who want to monitor overbought and oversold conditions while staying informed of potential buying and selling pressure. Key Features: Overbought/Oversold Detection: Automatically detects when the market reaches overbought (above 80) or oversold (below 20) levels, providing you with timely alerts for potential reversal points.

Улучшите свою торговлю прорывами с помощью Trendlines with Breaks by LuxAlgo MT5 — инновационного индикатора на основе pivot-точек, который автоматически рисует динамические трендовые линии и выделяет прорывы в реальном времени, опираясь на популярный набор LuxAlgo на TradingView, где он собрал более 100 000 использований и положительных отзывов за точность в выявлении уровней поддержки/сопротивления. Прославленный в торговых сообществах вроде Reddit и YouTube за опцию без перерисовки и настраив

Introducing the BOOM CRASH MASTER Indicator: Unleash the Power of Precision Trading! Step into the world of unparalleled trading with the BOOM CRASH Master Indicator, exclusively designed for the Boom and Crash indices offered by Deriv broker. This cutting-edge tool is your gateway to mastering the art of spike detection and anti-spike entries, ensuring you stay ahead of the market’s every move. Recommendations: Symbols: Any Boom or Crash Index
Timeframe: 1 minute / 5 minutes
Stop Loss: Recent
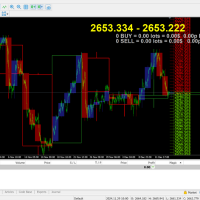
Multi TimeFrame Candle Indicator Description:
Tired of switching between charts to analyze multiple timeframes? The Multi TimeFrame Candle Indicator solves this problem by displaying candlestick data from any higher time frame directly on your current chart. Gain a broader market context and make more informed trading decisions without the clutter. Key Features: View Any Timeframe: Easily display candles from any larger time period (e.g., see H1 candles on your M15 chart). Customizable Appeara
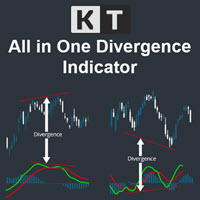
The KT All-In-One Divergence is designed to identify regular and hidden divergences between the price and 11 widely recognized oscillators. This powerful tool is indispensable for swiftly and accurately spotting market reversals. Its a must-have tool in any trader's arsenal, providing clear and accurate divergence patterns. Its accuracy and speed in identifying market reversals are remarkable, allowing traders to seize profitable opportunities confidently.
Features No Interference: You can ad
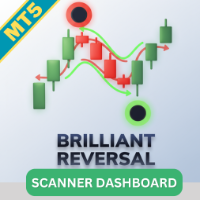
Сканер Brilliant Reversal Multicurrency Scanner MT5 — это мощный инструмент, разработанный для помощи трейдерам в мониторинге множества валютных пар и таймфреймов с использованием индикатора Brilliant Reversal. Этот сканер упрощает выявление потенциальных разворотов рынка, предоставляя сканирование в реальном времени и оповещения прямо с централизованной панели. Независимо от того, торгуете ли вы основными, второстепенными или экзотическими парами, этот инструмент обеспечивает всесторонний ох

An indicator to draw a graph of account current and historical state such as Balance, Equity, Margin, Free Margin, Margin Level, Drawdown, Account Profit, Deposit and Withdrawals.
Indicator Inputs : Draw Balance Graph Draw Equity Graph Draw Margin Graph Draw Free Margin Graph Draw Margin Level Graph Draw Drawdown Graph Draw Account Profit Graph Hide Data on Chart and Buffers Connect Gaps by Lines Sign of DDs on Profit Sign of DDs on Loss
Tips : The Indicator will draw historical balance graph

Half-Trend Indicator for MetaTrader5
To download all of our products, you can click this link: LINK
Introduction The Half-Trend Indicator is one of the leading indicators in the market, which helps you enter your trades through the high, low, moving average and ATR.
Specifications platform metatrader5 (MT5) type custom technical trading indicator level beginner timeframes all timeframes from weekly to trading styles scalping - day trading - swing trading - position trading markets forex - cr

Eabotpro Signals v3.0
A professional MetaTrader 5 indicator designed to deliver high-precision trading signals with real-time notifications, trade management tools, and a clean interface. "Recommended Base time frame is 4H Fibo From input . and trade time frame 1 mint , and 5 mint " Key Features: High-Accuracy Signals : Optimized for precision and consistency across different market conditions. Smart Trade Panel : Displays entry price, targets, stop levels, performance stats, and profit trackin

50% off. Original price: $60 Triangle Finder is a multi symbol multi timeframe dashboard that finds symmetrical triangle pattern in 28 symbols and 9 timeframes with a deep scan feature to scan all market watch symbols (up to 1000 instruments!).
Download Demo here (Scans only M1, M5 and M10) Settings description here MT4 version here
Triangle Finder features: Realtime monitoring of 28 customizable instruments and 9 timeframes at the same time. Deep scan mode to scan all market watch symbo

Этот индикатор представляет собой конвертированную версию индикатора TradingView "ATR Based Trendlines - JD" от Duyck для MetaTrader 5. Индикатор работает путем автоматического и непрерывного построения трендовых линий, основанных не только на цене, но и на волатильности, определяемой ATR. Таким образом, угол наклона трендовых линий определяется (процентом от) ATR. Угол наклона трендовых линий следует за изменением цены, которое диктуется ATR в момент обнаружения точки разворота. Процент ATR опр
FREE

KT Auto Trendline draws the upper and lower trendlines automatically using the last two significant swing highs/lows. Trendline anchor points are found by plotting the ZigZag over X number of bars.
Features
No guesswork requires. It instantly draws the notable trendlines without any uncertainty. Each trendline is extended with its corresponding rays, which helps determine the area of breakout/reversal. It can draw two separate upper and lower trendlines simultaneously. It works on all timeframe

TrendBite v1.5 - Профессиональный индикатор слежения за трендом Разработчик: 8aLt4 Версия: 1.5 Платформа: MetaTrader 5
Обзор TrendBite v1.5 — это усовершенствованный индикатор технического анализа, предназначенный для определения изменений тренда на рынке и предоставления инвесторам четких сигналов на покупку и продажу. Основанный на алгоритме полос Боллинджера, этот инструмент точно фиксирует развороты тренда и идеально подходит как для начинающих, так и для опытных трейдеров.
Основные хар
FREE

JCAutoStm 简繁塞壬模型 1.Zigzag3浪,大中小三浪代表市场潮流、趋势、涟漪。 2.自动识别当前三浪的走势,命名每一种结构形态。 Zig123下跌3浪5浪7浪:D3/D5/D7,下跌中继形态:DRF1/DRF2/DRF3,底部反转形态:BRP1,BRP2,BRP3,特殊结构下跌5浪后底部反转结构Zig123D5BRP1/2 Zig123上涨3浪5浪7浪:U3/U5/U7,上涨中继形态:URF1/URF2/URF3,顶部反转形态:TRP1,TRP2,TRP3,特殊结构上涨5浪顶部反转结构Zig123U5TRP1/2 3.趋势线绘制,分别以大中小三浪相邻的高低点进行绘制。 绘制的原则是,收敛形态。 4.三浪有效SR,F3,F6,F12,F15,绘制水平线。 MACD背离线
FREE

MT5 Version Dashboard: Free scanner to monitor All pairs and timeframes. Please contact me after purchase, i will send it to you! MT4 version indicator: https://www.mql5.com/en/market/product/59127 Tip: This is an indicator for real-time signal display. When the indicator is loaded and running on the chart, the past signal cannot be displayed Market structure changes as price reverses And filter with all import features built inside one tool. Breaker's smart algorithm detects the reverses,

Специальная цена запуска: всего $30!
Обычная цена $39 → сейчас доступно за $30 (ограниченное время) .
Цена вернётся к обычной после получения первых отзывов покупателей.
Gold Scalper Signal Pro — Профессиональный Индикатор для Золота Gold Scalper Signal Pro — это профессиональный высокоточный индикатор, созданный специально для золота (XAUUSD) и скальпинга .
Он предоставляет сигналы на покупку/продажу в реальном времени, позволяя ловить самое начало тренда и минимизировать рыночный шум ,

Основной функцией индикатора является определение и маркировка на гистограмме индикатора Awesome Oscillator торговых сигналов по стратегиям "Торговый Хаос второе издание" и "Новые измерения в биржевой торговле". Индикатор распознает и маркирует следующие торговые сигналы: "Два Пика" - Дивергенция. Сигнал "Второго мудреца" - третий последующий бар гистограммы Awesome Oscillator после смены цвета. Переход гистограммы через линию нуля. Сигнал "Блюдце". Индикатор имеет сигнальный блок, который инфор

In this indicator you choice a data to be used from yesterday (high, low, open, close, etc) to automatically draw an line to be the zero. And, from that a percentage deviation ("Percentage to be used") is calculated and used to draw others line to both side until a limit be reached.
Both sides can have diferrent colours as show in screenshots. Also, more than one indicator can be used at same time.
FREE

Ultimate MACD MTF Pro — это мощная, обновленная версия классического MACD, переработанная для современной торговли. Этот индикатор предлагает мульти-таймфрейм MACD, динамические цвета гистограммы, маркеры сигналов пересечения и умную смену цвета линий в зависимости от моментума. Создан для трейдеров, которым нужны чистые сигналы, раннее определение тренда и визуальная ясность профессионального уровня. Ключевые особенности Мульти-таймфрейм MACD (MTF) Легко переключайтесь между текущим таймфр
FREE

We at Minions Labs love to study, challenge and discover new facts about Price Behavior in current markets. We would NOT call it Price Action because today this is a word totally overused and means, thanks to the False Prophets out there, absolutely NOTHING.
The study hypothesis we propose is this: Some Assets, in certain Timeframes, present a behavior of Price continuity when the candlesticks close without a Wick on them... So the purpose of this indicator is to "color" those candlesticks who
FREE
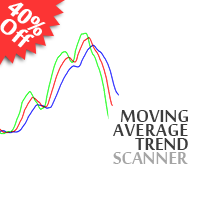
40% off. Original price: $50 Moving Average Trend Scanner is a multi symbol multi timeframe triple MA crossover dashboard that helps traders to monitor, and identify potential market trends from one chart. This panel scans 3 moving averages in up to 28 configurable instruments and 9 timeframes for triple moving average alignment and moving average crossover with a deep scan feature to scan all market watch symbols (up to 1000 instruments!).
Download Demo here (Scans only M1 and M6) Setti

Market Time Watch Лёгкий, чистый и незаменимый инструмент для отображения времени на графике трейдера Market Time Watch — это профессиональный индикатор для отображения времени на графике, созданный для трейдеров, которым требуется точное локальное время, серверное время и таймер текущей свечи. Индикатор показывает всю необходимую информацию прямо на графике, не перегружая интерфейс и не создавая лишних объектов. Если вы торгуете скальпинг, внутри дня, по времени закрытия свечей или вам просто н
FREE
Breakout Shift Trader – MT5 Indicator Trade Like the Market Architects — Not the Victims. Most traders are fighting blind against a rigged game. Market makers engineer false breakouts, liquidity grabs, and “stop hunts” that wipe out retail accounts in seconds. Breakout Shift Trader flips the script. This MT5 indicator decodes the footprints left by institutional manipulation and aligns your trades with the power brokers driving real price action. Proven Results – Tested, Verified, Relentless N
FREE

Индикатор отслеживания тренда с фильтром среднего входного сигнала
Этот индикатор действует как трекер тренда и фильтр, используя скользящие средние в качестве сигналов входа. Скользящие средние являются ключом к определению различных горизонтов тренда:
- Стандартное первичное среднее за 200 периодов указывает на долгосрочную тенденцию. - Среднее среднее значение за 50 периодов указывает на среднесрочную тенденцию. - Третичное среднее за 20 периодов указывает на самый короткий тренд. - Средня
FREE

The “Summary Risk Target” indicator is designed to show the total number of transactions made on a single pair. The transactions counted include active positions as well as pending orders . By setting a stop loss for each trade, this indicator displays the total potential risk (loss) that may be incurred. This helps traders easily understand their overall risk exposure without the need for manual calculations. Likewise, for take profit , if the TP level is defined—either in terms of pips or at a
FREE

Tenet Support & Resistance Pro — это продвинутый индикатор для MetaTrader 5, разработанный, чтобы помочь трейдерам точно определять ключевые уровни поддержки и сопротивления на рынке. Индикатор автоматически строит горизонтальные линии на основе истории цен, выделяя стратегические зоны. Кроме того, он отображает в реальном времени текущую зону, где торгуется свеча , предоставляя ясное представление о критических зонах принятия решений. Уникальная функция — обратный отсчет рядом со свечой , ко
FREE

Просто, понятно и эффективно — вот что такое Bars Trend and Pivot Support.
С помощью этой системы вы получаете в свое распоряжение интуитивно понятный инструмент, облегчающий анализ графика. Он автоматически отмечает важные уровни поддержки и сопротивления на основе выбранного периода, а также выделяет линию пивота, и все это с опциями активации и деактивации в соответствии с вашими предпочтениями.
Панель инструментов также наглядно отображает направление свечей на таймфреймах D1, H4, H1 и M3
FREE
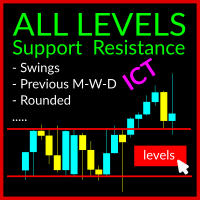
The Swing Levels Support and Resistance Indicator is a robust tool designed for MetaTrader 5 traders (also available for MT4). It aids in identifying crucial market levels where price direction may change by showcasing: Swing High and Swing Lows across all timeframes Previous Highs and Lows for Day, Week, and Month US Midnight level and Yesterday Midnight Level US Preopen 8:30 AM Level Rounded Levels This indicator features a toggle button, enabling you to display or hide these levels on the ch
Alpha Edge Pro – The Manual Trader’s Edge - If you prefer trading manually without stress, this indicator is for you. Get your copy now. Tired of missing the big moves or holding on to losing trades too long? Alpha Edge Pro is your new secret weapon. This high-performance, plug-and-play MT5 indicator gives you crystal-clear BUY and SELL signals — so you can trade with confidence, precision, and speed. If you prefer manual trading profitably , this indicator is made for you. Alpha Edge Pro does
FREE

True Days is a tool designed specifically for the trader who wants to catch intraday volatility in price charts. True day makes it easier for the trader to avoid trading in the dead zone - a period in time where markets are considered dead or non volatile. The trader can concentrate on finding opportunities only during periods of profound market movements. By default the indicator gives you a true day starting at 02:00 to 19:00 hours GMT+2. You can adjust according to your Time Zone. By deafult
FREE
53% OFF until December 31 (Normal price $125)! Don't miss the opportunity to have this invaluable tool!
This is a totally automated multi timeframe support and resistance levels finder on every MT5 chart. No manual work! Just drop this indicator on a chart and you will have the S/R levels always up to date. It is very convenient and helps the trader to anticipate possible stalls and reversions in price movements. The levels are displayed as lines and each timeframe has a different color. The i

Menora (All In One) Indicator.
This is the advanced and premium indicator for the Magic Trend, a free indicator. It has 3 output signals driven by different market conditions. This indicator has a double function of working as an indicator and utility at the same time.
Specifications
1] 3 output signals a) Slow Moving Average with color change - The MA has a non-repaint color change, which makes it perfect for entry signals. b) Fast Moving Average (the original Magic Trend line) - Gives a
FREE
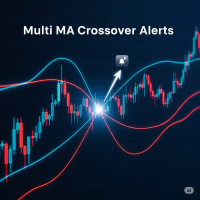
Multi MA Crossover Alerts - The Ultimate Trend Trading Tool Full Description: Tired of staring at charts for hours, afraid of missing a critical crossover signal? Do you find it difficult to analyze the trend using multiple moving averages at the same time? The Multi MA Crossover Alerts indicator is the all-in-one solution that will transform your trend trading. This powerful tool is designed to give you a complete market overview and alert you at the perfect moment, freeing you from the screen
FREE

Displays a USD DXY chart in a seperate window below the main chart. YOUR BROKER MUST HAVE THESE SYMBOLS FOR THE INDICATOR TO WORK Based on EUR/USD, USD/JPY, GBP/USD, USD/CAD, USD/CHF and USD/SEK All these pairs must be added to Market Watch for the indicator to work correctly As this is calculated using a formula based on the 6 pairs it will only work when the market is open.
YOUR BROKER MUST HAVE THESE SYMBOLS FOR THE INDICATOR TO WORK
Displays a USD DXY chart in a seperate window below the m
FREE
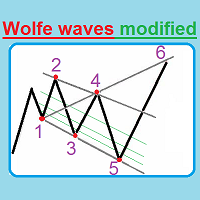
Представляем вашему вниманию совершенно уникальный индикатор, который автоматически строит Волны Вульфа и отличается высокой эффективностью торговой стратегии. Использование При появлении цифры 5 ждем, когда первая свеча закроется за Moving Average, далее смотрим на центральные три линии, которые показывают, какой объем лота нужно открыть, если 5 точка пересекла линию 25%, и свеча закроется за Moving Average, далее мы открываем сделку с лотом: = (Берем наш лот к примеру (0.40) и делим на четыр

Индикатор My Big Bars (мои большие бары) показывает бары (свечи) более старшего таймфрейма. То есть, если открыт график с таймфреймом H1 (один час), индикатор "подкладывает" снизу график с таймфреймом H3, H4, H6 и так далее. Используются следующие старшие таймфреймы: M3, M5, M10, M15, M30, H1, H3, H4, H6, H8, H12, D1, W1 и MN1.
Индикатор автоматически подбирает только те старшие таймфреймы, которые кратны текущему. Если открыт график с таймрфеймом M2 (2 минуты), то среди старших таймфреймов не б
FREE

Neural Levels Indicator – Precise AI-Based Market Levels Unlock next-level trading precision with the Neural Levels Indicator, a powerful market analysis tool built on advanced price-action principles and inspired by cutting-edge neural networks. Instantly identify three key neural trading levels directly on your chart:
Neural Level 1 Purpose: Crucial equilibrium level, ideal for identifying market balance points and potential turning zones.
Neural Level 2 (Optimal Entry) Purpose: Indicates p
FREE
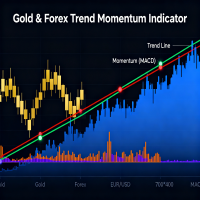
Overview QuantumEdge Oscillator is a professional-grade trading indicator that combines advanced momentum analysis with sophisticated trend detection algorithms. This 30-day trial version provides full access to all features, allowing you to thoroughly test its capabilities in live market conditions before making a purchase decision. Key Features Dual-Signal System : Combines RSI moving average with smoothed ATR-based volatility bands Multi-Timeframe Analysis : Built-in support for higher timefr
FREE

ICT, SMC, Smart Money Concept, Support and Resistance, Trend Analysis, Price Action, Market Structure, Order Blocks, Breaker Blocks, Momentum Shift, Strong Imbalance, HH/LL/HL/LH, Fair Value Gap, FVG, Premium & Discount Zones, Fibonacci Retracement, OTE, Buyside Liquidity, Sellside Liquidity, Liquidity Voids, Market Sessions,Market Time, NDOG, NWOG,Silver Bullet,ict template
На финансовом рынке точный анализ рынка критически важен для инвесторов. Чтобы помочь инвесторам лучше понять тенденции

Вы устали упускать выгодные рыночные тренды? Вы хотели бы иметь надежный инструмент, который мог бы точно и точно определять продолжение тренда?
Не смотрите дальше! Наш индикатор продолжения тренда призван усилить вашу торговую стратегию и помочь вам опережать конкурентов.
Индикатор продолжения тренда — это мощный инструмент, специально созданный для помощи трейдерам в выявлении и подтверждении паттернов продолжения тренда на различных финансовых рынках.
Независимо от того, торгуете ли вы ак

TrendCompass ALMA — Описание для MT5 Market (на русском)
TrendCompass ALMA — это высокоточный трендовый индикатор, который сочетает плавность ALMA, волатильностные сигналы полос Боллинджера и динамический диапазон ATR‑каналов. Он мгновенно показывает направление и силу тренда с помощью чистой 5‑уровневой цветовой системы.
Основные особенности: • 5‑цветная визуализация наклона тренда • Ультра‑плавное ядро ALMA с пониженным шумом • Обнаружение сжатия/расширения Bollinger Bands • Дина
FREE

A stochastic oscillator is a momentum indicator comparing a particular closing price of a security to a range of its prices over a certain period of time. The sensitivity of the oscillator to market movements is reducible by adjusting that time period or by taking a moving average of the result. It is used to generate overbought and oversold trading signals, utilizing a 0-100 bounded range of values. This indicator show 8 stochastic on one chart.
FREE

Любите скальпинг? Индикатор PZ Market Depth MT5 отображает информацию о последних котировках, полученных от брокера. Легкое распознавание тикового тренда Синий ряд означает, что цена увеличилась Красный ряд означает, что цена снизилась Настраиваемые цвета и размеры шрифтов Отображение выбранного количества рядов Индикатор не перерисовывается
Параметры Все параметры индикатора понятны, например, цвета - colors и размер шрифта - font-size.
Автор Артуро Лопез Перез, частный инвестор, биржевой спе
FREE
MetaTrader Маркет предлагает каждому разработчику торговых программ простую и удобную площадку для их продажи.
Мы поможем вам с оформлением и подскажем, как подготовить описание продукта для Маркета. Все продаваемые через Маркет программы защищаются дополнительным шифрованием и могут запускаться только на компьютере покупателя. Незаконное копирование исключено.
Вы упускаете торговые возможности:
- Бесплатные приложения для трейдинга
- 8 000+ сигналов для копирования
- Экономические новости для анализа финансовых рынков
Регистрация
Вход
Если у вас нет учетной записи, зарегистрируйтесь
Для авторизации и пользования сайтом MQL5.com необходимо разрешить использование файлов Сookie.
Пожалуйста, включите в вашем браузере данную настройку, иначе вы не сможете авторизоваться.