Смотри обучающее видео по маркету на YouTube
Как купить торгового робота или индикатор
Запусти робота на
виртуальном хостинге
виртуальном хостинге
Протестируй индикатор/робота перед покупкой
Хочешь зарабатывать в Маркете?
Как подать продукт, чтобы его покупали
Технические индикаторы для MetaTrader 5 - 51

This is a Free Display Dashboard for The ArbitrageATR Recovery MT5 EA. This indicator is used to track existing Total hedge positions (Account Summary) , Balance, Equity, P/L and Symbols, Correlation Status. Please adjust size and colours according to your desired preference. Feel free to message me if there are any queries required. Please note that this an indicator and not an Expert Advisor.
LINK TO THE EA: https://www.mql5.com/en/market/product/131269?source=Site+Market+Product+Page#descr
FREE

*Used by MeditionSeed EA. Meditation is a practice in which an individual uses a technique – such as mindfulness, or focusing the mind on a particular object, thought, or activity – to train attention and awareness, and achieve a mentally clear and emotionally calm and stable state.[1][2][3][4][web 1][web 2] Plant a Meditation Seed to have wonderful future.
FREE

The Teamtrader Channel Stop indicator allows you to determine the current trend. If the Teamtrader Channel Stop indicator line has moved below the price and turned blue, then you should open deals for an increase. If the Teamtrader Channel Stop indicator line has appeared above the price and turned red, then you should open deals for a decrease: The indicator is suitable for any time frames, but it needs to be supplemented with filtering indicators, since by itself it is late and does not have
FREE

High and Low
The indicator marks bars with a simple trend definition“ each subsequent high above/below the previous one and each subsequent low above/below the previous one ”. Charles Dow
Formula:
Max – The current maximum Min – The current minimum MaxK – Maximum per period MinK – Minimum per period
Min>MinK & Max>=MaxK – Symbol on top Max<MaxK & Min<=MinK – The symbol on the bottom
Input parameter:
Number of bars in the calculated history Period for current timeframe The distance to th
FREE

Трендовый индикатор на основе индикатора ADX / ADXWilder
Индикатор показывает трендовые участки, используя данные индикатора ADX или ADXWilder.
Принцип работы индикатора: если PDI больше NDI, то устанавливается бычье движение; если PDI меньше NDI, то устанавливается медвежье движение; если ADX меньше либо равен значению фильтра, указанного в параметрах, то состояние движения отсутствует.
Входные параметры индикатора: Calculate Timeframe - таймфрейм для расчета; ADX Type - тип расчета ADX, на
FREE
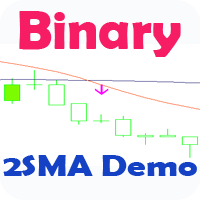
Стрелочный индикатор, выдающий сигнал при пересечении 2 SMA. Сигналы выдаются в виде стрелок и подходят для торговли бинарными опционами.
Это демо версия индикатора, в не нельзя изменять параметры. Полная версия .
Входные параметры First period- период 1 MA Second period - период 2 MA Invert signals - Возможность давать инвертированные сигналы (для работы по тренду) Candles to count - количество свечей для подсчета статистики Expiration - время экспирации сигнала Length - расстояние для
FREE

////////////////////////////////////////////////////////////////////////////////////
Улучшенная версия стандартного индикатора Standard Deviation.
Теперь это адаптивная и сглаженная линия.
Настройка не совсем простая - но я надеюсь что вы справитесь. Понять показания этого индикатора очень просто, смысл такой же как и у обычного Standard Deviation .
/////////////////////////////////////////////////////////////////////////////////////
Надеюсь этот индикатор очень Вам пригодится в успешной
FREE

Скалированный индикатор потрясающего осциллятора (SAO) представляет собой усовершенствованную версию индикатора потрясающего осциллятора, целью которой является установление стабильных точек опоры для выявления рыночных перегибов. В отличие от стандартного индикатора потрясающего осциллятора, который регистрирует изменения в пипсах для разных товаров, единственной неизменной точкой отсчета является нулевая линия. Это ограничение мешает инвесторам и трейдерам точно определить уровни для разворота
FREE

This indicator displays the Daily Range of a selected pair directly on your chart, providing a clear and concise view of the pair’s movement for the day. It simplifies tracking how far a pair has moved, offering traders a practical advantage in analyzing market activity. This feature is especially useful for making faster and more accurate trading decisions. Whether you’re a beginner or an experienced trader, it helps streamline your strategy by highlighting key market insights in real-time.
FREE

Дает полное представление о ситуации на рынке: сила и направление тренда, волатильность, канал движения цены. Два графических компонента: Гистограмма: размер и цвет столбика указывают силу и направление тренда. Положительные значения - восходящий тренд, отрицательные - нисходящий. Зеленый столбик - восходящее движение, красный - нисходящее движение, желтый - отсутствие тренда. Сигнальная линия - значение гистограммы (можно включить поиск дивергенции). Канал тренда: верхняя, нижняя граница и сере
FREE

Indicator for fast navigation through financial instruments. When you click on the button, you go to the chart of the financial instrument, the name of which was written on the button. In other words, the indicator opens or unfolds an existing chart window. For each chart, you can customize the name of the financial instrument, text color and background color; in total, you can customize symbols buttons that you trade often. The indicator can be installed on any charts for which you need to swit
FREE

Indicador Volatilidade Histórica Indicador é um oscilador que faz o plot da volatilidade histórica de um ativo, representado pelas fórmulas: Volatilidade Histórica = Raiz quadrada da média das diferenças ao quadrado * Fator de anualização. Média das diferenças ao quadrado = soma de todas as diferenças de retorno diário / número total das diferenças. Retorno diário = (preço atual - preço anterior) / preço anterior. Nesse indicador estamos utilizando os preços de fechamento de cada barra e fazemos
FREE

**MA Distance Filter: Your Smart Trading Ally!** Discover the **MA Distance Filter**, a powerful MetaTrader 5 indicator designed to elevate your trading strategy! Easily spot precise **buy** and **sell** opportunities based on moving average crossovers and minimum distance thresholds.
**What it offers:** - **Striking visual signals**: Green arrows for buy and red for sell, displayed live on the latest candle. - **Dynamic moving averages**: Track the fast, slow, and optionally a third
FREE

Простой индикатор показывающий размер спреда в текущее время, максимальный за день и максимальный за все время работы индикатора.
Так же выведена ежедневная статистика максимального спреда с указанием времени, когда этот спред был зафиксирован.
Местоположение индикации полученной информации можно менять в зависимости от предпочтений и располагать в любой точке экрана. Предусмотрена возможность вывода алертов о превышении размера спреда, указанного во входных параметрах.
FREE

The indicator is based on the concept of price channels, which are formed by plotting the highest high and lowest low prices over a specified period of time. The Donchian Channel Indicator consists of three lines: an upper channel line, a lower channel line, and a middle channel line. The upper channel line represents the highest high over a specified period, while the lower channel line represents the lowest low. The middle channel line is the average of the two and can be used as a reference f
FREE

Привет. Сегодня представляем индикатор корреляции - SynchroWindowTomson. Индикатор в одном окне показывает движение нескольких инструментов, по отношению друг к другу, удобно определять направление и изменение, особенно когда вы работаете с целым портфелем разных инструментов и нужно определить какой из них тянет результат назад и движется в другую сторону. Так же видны точки разворота спреда.
FREE

Dynamic Theoretical Stop
Histogram indicator that dynamically analyzes the theoretical Stop levels in real time.
Operation :
The DTS - Dynamic Theoretical Stop does a mapping of fractals in previous candles and suggests two levels of Stop: For purchase and for sale.
Suggested reading :
It is necessary to make the definition of Maximum Stop in points in the Trading Plan. In this way, the trader can decide the best entry point by analyzing the theoretical stop levels:
Stop for sales: Shown a
FREE

Индикатор по параметрам Bollinger Bands определяет положение бара и выводит значение в окно индикатора.
При закрытии бара ниже нижней линии Bollinger Bands, значение индикатора становится отрицательным.
В таком случае можно ожидать скорого разворота рынка и двидения вверх.
При закрытии бара выше верхней линии Bollinger Bands, значение индикатора становится больше 1.
В таком случае можно ожидать скорого разворота рынка и двидения вниз.
Желательно использовать другие индикаторы для подтвержден
FREE

This indicator saves the chart as a template when you change the symbol. It also loads the template from the new symbol. Therefore you are able to save all objects that you have drawn on the chart. It is an addition to the Watchlist Indicator.
How to use it: - Pull the indicator to the chart - The first parameter defines which timeframes are saved into one file. An example: If you do not want to see a drawn object (e.g. line) from D1 in M1 you need to specify the timeframes.
- The default valu
FREE

Spread Indicator MT5 - NS Finanças. (http://www.nsfinancas.com.br) Auxiliary tool to give Spread visibility to all types of currency pairs and timeframes. The labels are well positioned in the upper right corner of the chart so as not to disturb the visualization during the trade, however it is also possible to drag the indicator to the best place on your screen. In addition to the current spread, this indicator also monitors the minimum, maximum and average spread of the selected currency pair
FREE

Critical Trading, Omni-Channel This indicator lets you create a unique channel from a base type and a range type. Channels are great for spotting over-extensions or the start of new trends. With an ever changing market it is important to create your own edge in the market that no one else has. Let Omni-Channel add to your unique trading strategy. Please contact criticaltrading@outlook.com for more info or advice on adding any other functionality.
FREE
Hi Traders, ATR is one of the most popular indicators used to measure volatility. This indicator displays two optional ATR values on your chart, helping you save chart space and keep things clean and organized. You can set your desired threshold for each ATR to monitor volatility. If the ATR value is greater than your threshold, the text color will remain your default color; otherwise, it will be displayed in red. Happy Trading !
FREE
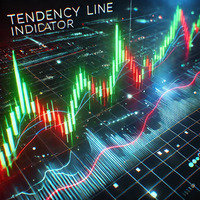
TendencyLine Indicator - Market Trend Analysis (An exclusive indicator by PPF - Past Project Future)
General Description TendencyLine is a technical indicator developed by PPF - Past Project Future to help traders identify the prevailing market trend. It overlays a trend line based on a user-selected moving average on the price chart and displays a colored histogram that signals the trend direction.
Main Features Trend Identification: The indicator differentiates between bullish and bear
FREE

Introducing this manual trading strategy that will change the way you approach funding tests! Our indicator has been meticulously designed to maximize your success, offering an impressive accuracy rate of 83% on entries . Imagine having a tool at your disposal that guides you accurately through the financial markets, giving you an unparalleled competitive advantage. With our innovative technology, you'll be one step ahead in every operation. You no longer have to rely solely on intuition or expe
FREE

FLAT ADVANCED TREND V1.5 – Identify Trends with Professional Precision
Flat Advanced Trend is your ultimate solution. It combines the power of ADX, ATR and RSI into a visually intuitive, easy‑to‑use tool designed for serious traders. Key Features: Smart Trend Detection – Filters out market noise using ADX + +DI/–DI and displays only the most reliable signals. Advanced Filters – Includes ATR for volatility and RSI for momentum (fully customizable). Real‑Time Info Panel – Shows current trend, stre
FREE
Swap Monitor Indicator v1.0 by @marekfleisi Swap Monitor is a clean, lightweight MetaTrader 5 indicator that displays real-time swap values and open position swap data for the current symbol — directly on your chart. Whether you're a swing trader optimizing overnight holds or just want clear insight into swap costs and income, Swap Monitor gives you instant transparency on: LONG & SHORT swap values Color-coded swap profitability Open positions summary (including total swap profit/loss)
FREE
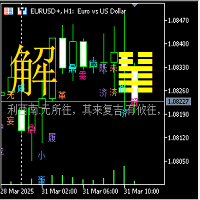
I Ching 64 Hexagram Change Indicator
1. Hexagram Indicator Description: (1) This 64 Hexagram Change Indicator is based on the Yin-Yang transformation thought of the "I Ching" philosophy in ancient Chinese culture, integrating the results of the long and short game of each candlestick K-line period of the financial trading K-line chart, using China's oldest prediction coding method, in the form of the I Ching 64 hexagrams, combining the Yin-Yang of each line of the hexagram with the Yin-Yang of
FREE

Numa folha qualquer
Eu desenho um sol amarelo
E com cinco ou seis retas
É fácil fazer um castelo
Corro o lápis em torno da mão e me dou uma luva
E se faço chover com dois riscos, tenho um guarda-chuva
Se um pinguinho de tinta
Cai num pedacinho azul do papel
Num instante imagino uma linda gaivota a voar no céu
Vai voando, contornando
A imensa curva norte-sul
Vou com ela viajando
Havai, Pequim ou Istambul
Pinto um barco à vela
Branco navegando
É tanto céu e mar num beijo azul
Entre as nuvens vem
FREE

This is a regression tree indicator for MT4/MT5.
This indicator classificate nodes on the time period so that the deviation becomes smaller,
and displays regression line and channel for each node.
It's free!
Attached CartDemo.ex4 and CartDemo.ex5 is a Demo version and has the following limitations:
Can't use HighSpeed method (default method is RandomForest)
Maximum number of bars is 260 (increase from 200)
There is no expiration date and can be started many times, but it stops after an hour.
FREE

O indicador mostra o preço ou volume em milissegundos, ótimo para identificar padrões de entrada por agressão de preço ou volume e escalpelamento rápido. Características Período de tempo do WPR em milissegundos Oscilador de agressão de preço Tela personalizável O indicador pode indicar movimentos de entrada, como: Cruzamento da linha 0.0 Identificando padrões de onda
A velocidade de exibição do gráfico dependerá do seu hardware, quanto menores os milissegundos, mais serão necessários do hardwar
FREE

This is a tool to estimate your probability of bankruptcy. features. estimate a probability of bankruptcy (Nauzer J. Balsara) from your trade history usually, it is small print and never interfere with trades alert in large prints and color when it exceed the alert level you can set parameters(i.e. winning ratio) fixed and simulate freely *1: this value is for reference only and is not guaranteed to occur.
FREE
A professional-grade Bollinger Bands percentage analyzer.
Transform your trading strategies with the BBPCT Indicator, an advanced Bollinger Band Percentage indicator developed by iDevelop.expert. This tool is tailored to provide traders with a clear and actionable visualization of price movements relative to Bollinger Bands, along with insightful overbought and oversold signals.
Key Features: Dynamic Histogram Visualization: A dual-colored histogram for quick identification: Green bars indicat
FREE

Smart Market Flow Detector (SMFD) - Professional V1.31 I CAN CONSISTENTLY GRIND MONEY FROM THIS, BE IT SCALPING OR LOWER LOTS ON LONGER TIME FRAMES. IF YOU ARE WILLING TO PUT THE WORK IN, TRADING GIVES BACK IN PROFIT WHAT YOU GIVE IN PATIENCE AND DISCIPLINE. WET DREAM 5000% PROFIT A MONTH GAMBLERS MOVE ALONG — THIS IS NOT FOR YOU. 4 Advanced Algorithms Combined Into One Powerful Indicator The Smart Market Flow Detector (SMFD) is a professional-grade Meta Trader 5 indicator that integrates four d

GeoInfo5 - один из наиболее информативных индикаторов, в компактном виде отображает основную информацию о торговом инструменте.
Версия для терминала МетаTrader 4 приобрела широкую популярность среди трейдеров.
Индикатор бесплатный и всегда будет бесплатным.
Теперь доступна стартовая версия и для MetaTrader 5. выводит в строку в левом верхнем углу графика в кратком виде информацию об основных параметрах инструмента: Спред, Своп для ордера Buy, своп для ордера Sell, текущий спред, залог (маржу)
FREE

Оригинальный трендовый индикатор. Индикатор рисует в отдельном окне три линии, характеризующие текущую динамику цены. Может принимать значения от -1 до +1. Чем ближе значение индикатора к +1, тем сильнее восходящий тренд. Чем ближе к -1, тем сильнее нисходящий. Также может применяться в качестве осциллятора для определения перекупленности/перепроданности. Индикатор имеет один входной параметр Period, в котором указывается количество баров, используемых для расчета.
FREE

Indicador que cria um painel para acompanhamento to total de posições abertas no ativo do gráfivo.
São apresentados os dados: Ativo do gráfico Total de posições de venda em aberto Quantidade do volume de posições de venda em aberto Total de posições de compra em aberto Quantidade do volume de posições de compra em aberto.
Painel simples mas eficiente para o equilíbrio das ordens
FREE

*Used by MeditionSeed EA. Meditation is a practice in which an individual uses a technique – such as mindfulness, or focusing the mind on a particular object, thought, or activity – to train attention and awareness, and achieve a mentally clear and emotionally calm and stable state.[1][2][3][4][web 1][web 2] Plant a Meditation Seed to have wonderful future.
FREE

Advanced Trend Builder - трендовый индикатор, использующий оригинальный алгоритм вычислений. ATB применим на любых данных и периодах. Рекомендую для расчета использовать 4 - 16 - 64 - 256 и т.д. баров, но это не является обязательным условием. Середина трендовой волны, так же как и грани, это места особого накала и поведения рынка, при написании ATB осуществлялась попытка реализовать именно нахождение середины. Входные параметры: Bars will be used for calculation - количество баров, используемых
FREE
Aydmaxx Trade Tracker Описание: Aydmaxx Trade Tracker – это мощный и удобный инструмент для трейдеров, который позволяет отслеживать текущую прибыль или убыток по каждой сделке в режиме реального времени. Индикатор выводит на экран информацию о текущей прибыли, помогая трейдерам быстро оценивать результаты своих торговых операций. Основные функции: Отображение текущей прибыли или убытка по всем открытым позициям в реальном времени. Настройка угла экрана для отображения информации (правый нижний
FREE

Индикатор "Изменение цены от нуля" предназначен для отображения изменения цены за выбранный период в пунктах. 1. Основная идея Индикатор рассчитывает разницу между ценой закрытия на текущем баре и ценой открытия на баре, отстоящем назад на Period свечей. Результат отображается в виде линии в отдельном окне. 2. Интерпретация Положительное значение: Цена выросла за период. Отрицательное значение: Цена снизилась за период. Нулевое значение: Цена вернулась к исходному уровню. 3.
FREE
Индикатор показывает изменение цены текущего или любого другого инструмента с начала дня/недели.
Можно выбрать отображение в пунктах или же в процентах относительно цены открытия начала периода.
Индикатор выполнен в виде гистограммы с двумя цветами, для восходящего и нисходящего изменения цены.
Вы так же можете выбрать, для какого инструмента показывать данные. Данные будут отображены на текущем графике.
FREE

Индикатор MAtrioMT5, отображает на любом таймфрейме сразу три скользящих средних с периодом 50 -дневная ,100 -дневная , 200 -дневная . После присоединения к графику сразу отображает три скользящих средних с параметрами простой (SMA) скользящей средней MAmethod50 , простой (SMA) скользящей средней MAmethod100 , простой (SMA) скользящей средней MAmethod200 . Соответственно с типом цены MAPrice50, MAPrice100, MAPrice200 по умолчанию везде стоит цена Close price . Все параме
FREE

White Crow Indicator
by VArmadA A simple yet powerful candle analysis based indicator using the White Soldiers & Crow patterns.
Works with timeframes 1H and higher and tested on all major pairs. Pay attention to the signal: An arrow indicating a long or short entry.
How It Works:
Arrows indicate a ongoing trend. After multiple bullish or bearish candles in a row the chances for another candle towards that trend is higher.
Instructions: - Crow Count: Set the number of candles that need to su
FREE
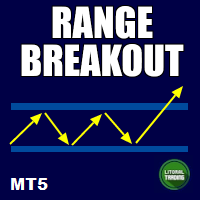
This is an indicator that highlights the price range, specifically in the morning. So it is very easy to identify when these zones are broken, giving you an excellent entry opportunity! Range Breakout works on all symbols and timeframes. It displays past price regions and projects the current one. If you find any bug or have any suggestion, please, contact us. Enjoy!

Utility for show on charts the visual informations about:
- a vertical line at start of each bar of selected timeframe
- a vertical line at start of each day
- a vertical line at start of each week
- vertical lines at start / end of trading sessions selected
- bid / ask prices, spread, money value for each point (of 1 standard lot) and last tick time recived"
You can enable / disable each information and set the color for each line
FREE

This indicator helps keep track of the number of trades taken in the day. It shows losses and potential profit then the total profits which is, profits - losses. Then total profit for the week and month. Soon the indicator will be sharing some trading tips based on your trading. It really does put necessary pressure and helps you to set a goal for yourself for the day. Familiarise yourself to draw your analysis on the same chart with the indicator because it will have to alert you if price brok
FREE

An easy indicator that simply shows the moment we connect to the market. We can easily see what has happened while we were gone because the line has two different colors that show the start time. It is only that, a visualization aid that allow us to mark the market behavior while it was night time in our country, or if we have stopped several hours. Input: Server start working date: Day of month Month Year Hour Minutes
FREE

Buy and sell signals based on the Wave Setup strategy for entering a trade on the pullback after a reversal.
How does the indicator work? The indicator activates the buy and sell signal when their respective conditions are met. For an uptrend, we need a reversal up on the EMA9 followed by prices above the ascending SMA21 making a pullback and a touch on it. For a downtrend, we need a reversal down on the EMA9 followed by prices below the descending SMA21 making a pullback and a touch on it.

The Trend Quality Indicator (by David Sepiashvili) is intended to measure trend activity. Some benchmarks can be used to determine the strength of a trend.
In the range of values from -1 to +1 ( Ignored zone parameter) , the trend is buried beneath noise. It is preferable to stay out of this zone.
The greater the value, the less the risk of trading with a trend, and the more reliable the trading opportunity.
The range from +1 to +2, or from -1 to -2, may be treated as zone of weak trend

The Rise of Sky walker is a trend indicator is a powerful indicator for any par and any timeframe. It doesn't requires any additional indicators for the trading setup.The indicator gives clear signals about opening and closing trades.This Indicator is a unique, high quality and affordable trading tool. Can be used in combination with other indicators Perfect For New Traders And Expert Traders Low risk entries. Never repaints signal. Never backpaints signal. Never recalculates signal. Great Fo

Это специальная утилита, для подключения внешнего индикатора к торговой панели . Она позволяет получать данные из буфера индикатора и рисует стрелочные объекты для передачи их в торговую панель. Входные параметры
Number of call buffer - номер индикатора для покупки Number of sell buffer -номер индикатора для продажи Indicator window - окно индикатора Indicator position in list - позиция индикатора в списке Default value of indicator - значения по умолчанию для индикатора Show information - показ
FREE
The EMA Navigator Pro is an advanced version of the popular EMA indicator, designed to provide superior flexibility and multi-timeframe analysis capabilities. This indicator not only displays EMA lines but also offers a powerful alert system to ensure you never miss a crucial signal. Key Features: Multi-Timeframe Support: You can assign a separate timeframe to each individual EMA line, allowing you to analyze long-term (e.g., D1) and short-term (e.g., H1) trends on the same chart. Automatic Cro
FREE

Мультитаймфреймовый трендовый индикатор, на основе индикатора ADX / ADXWilder Индикатор показывает трендовые участки, используя данные индикатора ADX или ADXWilder с нескольких таймфреймов. Импульсный режим индикатора позволяет поймать начало тренда, а несколько "Экранов" с разными таймфреймами позволяют отфильтровать рыночный шум.
Принцип работы индикатора: если PDI больше NDI, то устанавливается бычье движение; если PDI меньше NDI, то устанавливается медвежье движение; для определения какого-
FREE

JCStatistics 简繁数据统计 1.显示账户信息:内容显示 交易员、账号、本金、杠杆、保证金、保证金比例、余额、净值; 日周月开盘余额、持仓收益、日收益、周收益、月收益; 收益为正时显示红色字体,收益为负时显示绿色字体; 日收益低于-5%时显示CircuitBreak; 总收益低于-10%时显示MarginCall; 2.显示统计数据: 收益(收益率)(交易量)(胜率) 5日数据;4周数据;12月数据; 3.当前标的统计:Symbol()收益(交易量)(胜率) 4.主流标的统计:收益(交易量)(胜率) 可以选择性显示账户信息、数据信息,调整显示颜色,调整字体,调整字体大小。 指标删除后自动删除桌面文字及背景。 备注:如遇使用问题,请联系邮箱:16692618587@qq.com.
FREE
Индикатор отображает изменение баланса В правом нижнем углу окна.
Отображаются следующие периоды Сегодня Вчера 3 дня Неделя 10 дней Месяц 3 месяца Полгода Год Все время Есть возможность выставить расчетное время. Удобно пользоваться для расчетов прибыли/убытков с определенного часа.
Будет полезен например ночным скальперам. Данные совпадают с расчетами отчета в терминалее.
FREE

Главное достоинство представленного индикатора - фильтрация сигналов на покупку и продажу в направлении рыночного импульса и ранжировании их по силе. Настройка с индикатора проста и интуитивно понятна. Все, что от вас требуется - реагировать только на сильные сигналы. Соблюдайте правила управления капиталом.
Описание индикатора Индикатор Color Stochastic with an analytical panel состоит из собственно самого индикатора стохастик и информационно-аналитической панели. Для индикатора имеются возмож

Представляем индикатор “Информация о Стоимости Символа” – ваш незаменимый инструмент для поддержания лидерства на рынке форекс! Этот инновационный индикатор создан для того, чтобы обеспечить трейдеров информацией о реальной стоимости в режиме реального времени, непосредственно на их графиках. Вот почему каждому трейдеру необходим индикатор “Информация о Стоимости Символа” в его арсенале: Мониторинг Спреда в Реальном Времени: Внимательно следите за спредом любой валютной пары, чтобы входить на р
FREE

The Graphic Alignment Context (GAC) Technical Indicator measures the vertical difference of the simple average price of a financial instrument in the context of three different timeframes determined by a defined number of bars or candles (periods) to determine the strength of the buy or sell trend. sale. Ascending average prices indicate Buying strength (1), Descending average prices indicate Selling strength (-1) and any scenario different from the previous two conditions indicates Neutrality
FREE

Corretora recomendada para usar esse indicador: https://tinyurl.com/5ftaha7c Indicador que pinta o candle de amarelo em pontos de muita agressão no mercado. Sempre que o mercado for se movimentar o candle irá ficar amarelo. Valido para todos ativos e todos timeframes. SEE OUR RESULTS ON INSTAGRAM: https://www.instagram.com/diogo.cansi/ TELEGRAM GROUP = https://t.me/robosdsc More information by email dscinvestimentos@gmail.com or by Whatsapp 55-991372299
FREE

It is the simplest indicator in existence. It has only one function: report the seconds elapsed since the last minute end in a very convenient way, with a label that can be moved in the chart, so that the trader does not have to take his eye off the forming candle. It is used on M1, but also on larger intervals, for those interested in opening/closing positions at the best time. Sometimes an intense movement in the last 10" of the minute gives indications of future trend, and can be used for sc
FREE
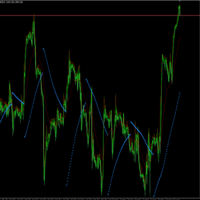
La idea de este indicador es la siguiente: reemplazar los precios High, Low del indicador SAR por los valores del indicador Moving Average. Al final tendremos la siguiente imagen:
Es decir, el indicador SAR cambia su dirección después de tocar el indicador Moving Average.
Parámetros de entrada SAR: Step - parámetro "Step" del indicador SAR; SAR: Maximum - parámetro "Maximum" del indicador SAR; MA: Period - parámetro "período de promediación" del indicador MA; MA: Shift - parámetro "des
FREE

Данный индикатор умеет определять ценовые уровни, на которых было больше всего объёма за указанный промежуток истории. В будущем, ч асто цена отбивается от таких уровней, и это можно с успехом применять в торговле. Они отображаются линиями, некоторые параметры для определения уровней можно настраивать. Этот индикатор прост, поэтому не сообщает сигналы, а построение уровней делает только на EUR/USD. Параметры HistoryBars - количество баров для определения ближних объемных уровней; Range -
FREE

MOON 4 TREND COLORS: is a Tren indicator. I s a powerful indicator of TREND for any par and any timeframe. It doesn't requires any additional indicators for the trading setup.The indicator gives clear signals about opening and closing trades, PAINTING THE CANDLES OF COLOR IN FUNCTION OF THE SENSE OF TREND .This Indicator is a unique, high quality and affordable trading tool.
Perfect For New Traders And Expert Traders Low risk entries. For MT5 Only Great For Scalping Great For Swing Tradi

Пользовательский индикатор Bollinger Bands Height - высота полос Bollinger Bands.
Показывает текущее состояние индикатора Bollinger Bands: полосы удаляются друг от друга или полосы начинают сближаться.
Сжатие - сближение полос, означает, что текущий движение рынка ослабевает и указывает на скорое начало нового сильного движения.
Значит нужно искать удачный момент для входа в позицию, так как можно ожидать резкое изменение цены.
Наиболее эффективен в работе с другими трендовыми индикаторами.
FREE

Introducing the "Cybercycle Trend" Forex Oscillator, a powerful technical indicator designed to enhance your trading experience in the foreign exchange market. This innovative tool utilizes advanced algorithms to identify and analyze market trends, providing you with valuable insights and helping you make informed trading decisions.
The Cybercycle Trend Forex Oscillator is specifically designed to detect and measure cyclical price movements in the forex market. By incorporating this oscillator
FREE

Time your trades perfectly with the Ultimate Candle Timer . This professional tool for MetaTrader 5 gives you a precise and smooth countdown to the next candle without any lag. It's built for traders who need reliable performance and runs efficiently without slowing down your computer. Unlike other timers, it provides a steady, second-by-second countdown that works perfectly even when the market is slow.
FREE

Take control of your trading workspace with the Switcher Dashboard – a smart and efficient tool that auto-detects all open charts (Forex, VIX, stocks) and turns them into neatly organized, color-coded buttons for instant chart switching. Key Features: One-click chart navigation – Seamlessly switch between charts with a single click. Trend visualization – Instantly identify bullish or bearish conditions with clear color cues. Flexible layout options – Choose from 4 customizable views (left, righ
FREE

A scrolling Market Ticker that displays price changes from all symbols in the Market Watch list. Provides an easy snapshot of symbol prices, and keeps scrolling automatically while you trade and analyse the chart.
Options include: - MTF, eg choose to show price changes of the daily chart, or the hourly - use the live candle or the recently completed - font and background coloring
FREE

这是一个组合指标分析趋势、支撑阻力、买卖点。运用了均线MA、布林带、KDJ、CCI、RSI。 主图上下线是布林带上下线,采用的是20周期和2.3标准差可以用来支撑阻力。 中间的是分析趋势的均线,趋势分析是用均线多周期: 为涨趋势,反之为下跌趋势。在同一种颜色,基本说明趋势没有发生变化。 子图是由 KDJ、CCI、RSI三个指标组成,大于70超买,小于30超卖, 智能提示是运用了算法,主要计算布林带, KDJ、CCI、RSI指标
有三个或四个指标超出市场常态就会发出提示行情可能反转。 子图指标运用了很多数据,刚刚开始加载会有点慢,耐心等待就可以 这个指标是主图指标,还要再下我发布的RCD分析,这样就刚刚好组成一套分析 电脑分辨率的文本大小请设置100%,不然字体会不一样
FREE

Sometimes swaps are hidden for certain financial instruments , hence incurring unprecedented costs over night. The need to uncover hidden swap costs is vital for profitable trading. With that being said, this expert indicator helps the trader to uncover the hidden swap costs.
Features chart objects with text short and long trade swap plug and play
Advantages uncover hidden swaps plug and play, no other configurations are needed to use it. usable on all charts and symbols swaps can be easily s
FREE
MetaTrader Маркет - уникальная площадка по продаже роботов и технических индикаторов, не имеющая аналогов.
Памятка пользователя MQL5.community расскажет вам и о других возможностях, доступных трейдерам только у нас: копирование торговых сигналов, заказ программ для фрилансеров, автоматические расчеты через платежную систему, аренда вычислительных мощностей в MQL5 Cloud Network.
Вы упускаете торговые возможности:
- Бесплатные приложения для трейдинга
- 8 000+ сигналов для копирования
- Экономические новости для анализа финансовых рынков
Регистрация
Вход
Если у вас нет учетной записи, зарегистрируйтесь
Для авторизации и пользования сайтом MQL5.com необходимо разрешить использование файлов Сookie.
Пожалуйста, включите в вашем браузере данную настройку, иначе вы не сможете авторизоваться.