Смотри обучающее видео по маркету на YouTube
Как купить торгового робота или индикатор
Запусти робота на
виртуальном хостинге
виртуальном хостинге
Протестируй индикатор/робота перед покупкой
Хочешь зарабатывать в Маркете?
Как подать продукт, чтобы его покупали
Технические индикаторы для MetaTrader 5 - 11

Симметричный треугольный паттерн представляет собой период сокращения и консолидации, прежде чем цена вынуждена совершить прорыв вверх или пробой. Пробой нижней линии тренда указывает на начало нового медвежьего тренда, а прорыв верхней линии тренда указывает на начало нового бычьего тренда.
Версия MT4 доступна здесь: https://www.mql5.com/en/market/product/68709/
Этот индикатор идентифицирует эти паттерны и предупреждает вас, когда формируются 4 ключевые точки и цена снова возвращается в треу
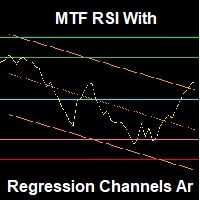
Note: The inputs of this indicator are in the Arabic language An advanced RSI indicator that displays dynamic linear regression channels in both the indicator window and the price chart, with predefined horizontal levels to detect overbought and oversold zones. Main Features (Summary): Synchronized linear regression channels on both price and RSI Multitimeframe support Smart and ready-to-use horizontal levels Professional design with optimized performance Feedback & Support We value your ex
FREE

N/B: All our product purchase comes with our free ‘’DAILY SCALPER EA’’ - bit.ly/4qlFLNh Whatsapp Developer for yours after successful purchase
OMEGA ONE SPIKE DETECTOR: Catch Every Explosive Move /Spikes with Surgical Precision
"I Used To Watch Spikes Fly By - Now I Catch Them Consistently Using Institutional Order Levels"
WATCHING 500-POINT SPIKE and not profiting? ENTERING TOO LATE after the big move already happened? GETTING STOPPED OUT right before the explosion?
What If

CandlePatternProUltimate для MetaTrader 5 Обзор Индикатор CandlePatternProUltimate — это продвинутый инструмент для обнаружения японских свечных паттернов на графиках в платформе MetaTrader 5. Он обладает привлекательным художественным интерфейсом и обнаруживает 150+ различных паттернов с помощью интеллектуального анализа на основе ИИ. Ключевые особенности Художественный дизайн Настраиваемые цвета : Полностью настраиваемая художественная цветовая палитра Визуальные эффекты : Свеч
FREE
Cumulative Delta Volume Indicator for MT5 (CDV Indicator for MT5) Volume-Based Market Sentiment and Trend Strength Indicator The Cumulative Delta Volume (CDV) indicator analyzes the balance between buying and selling volume to reveal the underlying market sentiment.
By accumulating the difference between upward and downward volume, it shows whether buyers or sellers are in control and helps traders confirm the strength or weakness of a trend. This tool provides both candle-based visualization an
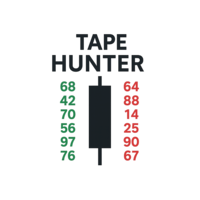
Tape Hunter – Ваш радар усилий и результата в MT5 Tape Hunter — это идеальный индикатор для трейдеров, которые хотят видеть настоящую игру за ценами на MetaTrader 5. Он четко и интуитивно показывает агрессивные объемы покупок и продаж на основе POC (Point of Control), позволяя визуализировать усилия рынка и реальный результат на каждом свече. ️ Почему это важно?
Не весь объем двигает цену! Tape Hunter показывает, действительно ли усилия (агрессивный объем) эффективно влияют на движение ц

INDICATOR: GEN Zenith Developer: gedeegi General Description GEN Zenith is a technical indicator designed to automatically identify price reversal patterns (Zenith) based on pivot price detection and delta volume movement. This indicator looks for points where the price forms a swing high or swing low, then detects a breakout from that area to confirm a strong reversal signal. This indicator is highly suitable for reversal and breakout strategies, or as a signal confirmation tool in your tradin
FREE
Advanced Market Analysis Tool. Full Documentation: Download Free Professional Education Course: After purchasing, contact me to receive access to the complete CDV Professional Training Video Course. — It will help you master CDV , Aggressive Buyer & Seller dynamics , and Volume Microstructure concepts through a clear, step-by-step learning process. Overview The Professional CDV with Aggressive Score is a comprehensive volume analysis tool that combines visual Cumulative Delta Volume (CDV)

Индикатор отображает профили объёма по принципу вложенности. Периоды профилей предустановлены так, что каждый последующий профиль имеет протяжённость вдвое большую, чем протяжённость предыдущего профиля. Помимо профилей индикатор отображает кластеры объёма, отсортированные по цвету, в зависимости от содержащегося в них объёма.
Особенности работы индикатора Индикатор работает на типовых таймфреймах от M5 до MN, но для вычислений использует исторические данные меньших таймфреймов: M1 - для таймф
FREE

Necessary for traders: tools and indicators Waves automatically calculate indicators, channel trend trading Perfect trend-wave automatic calculation channel calculation , MT4 Perfect trend-wave automatic calculation channel calculation , MT5 Local Trading copying Easy And Fast Copy , MT4 Easy And Fast Copy , MT5 Local Trading copying For DEMO Easy And Fast Copy , MT4 DEMO Easy And Fast Copy , MT5 DEMO Расширенные полосы Боллинджера:
1. Рельс Боллинджера изменит цвет в зависимости от направлени
FREE
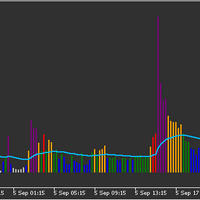
Volume indicator judging level of volume per bar accordingly to Volume Spread Analysis rules. It allows either to set static volume levels or dynamic ones based on ratio comparable to Moving Average. Bars are coloured based on ratio or static levels, visually presenting level of Volume (low, average, high, ultra high). Release Notes - Fixed and optimised calculations of Session Average Volume
- added predefined settings for time to calculate Session Average for EU and US markets
FREE

Индикатор TickCounter осуществляет подсчет тиков вверх и вниз на каждом новом баре. Подсчет начинается с момента установки индикатора на график. Столбики гистограммы отображают: Желтые столбики - общее количество тиков; Синие столбики - тики ВВЕРХ; Красные столбики - тики ВНИЗ. Если синий столбик не виден, значит тиков вниз больше и красный столбик отображается поверх синего (красный слой выше синего). MT4 version: https://www.mql5.com/en/market/product/82548 Каждая переинициализация ин

Presenting one-of-a-kind Gann Indicator for XAUUSD
IQ Gold Gann Levels is a non-repainting, precision tool designed exclusively for XAUUSD/Gold intraday trading. It uses W.D. Gann’s square root method to plot real-time support and resistance levels, helping traders spot high-probability entries with confidence and clarity. William Delbert Gann (W.D. Gann) was an exceptional market analyst whose trading technique was based on a complex blend of mathematics, geometry, astrology, and ancient calcul

The Quantitative Qualitative Estimation (QQE) indicator is derived from Wilder’s famous Relative Strength Index (RSI). In essence, the QQE is a heavily smoothed RSI.
Modification of this version: ( converted from tradingview script by Mihkell00, original from Glaz, 100% identical output)
So there are Two QQEs. One that is shown on the chart as columns, and the other "hidden" in the background which also has a 50 MA bollinger band acting as a zero line.
When both of them agree - you get a b
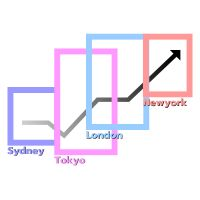
Time Zones and the Forex Market
The Forex market operates continuously 24 hours a day, facilitated by its global distribution across various time zones. The market is anchored by four primary trading centers: Sydney , Tokyo , London , and New York . Each trading center has specific opening and closing times according to its respective time zone. These differences significantly impact market volatility and trading opportunities during each session. Features Enable/Disable Date Display Enable/Di
FREE
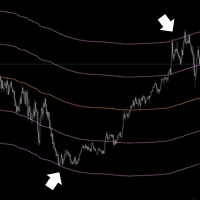
Elevate Your Trading with Advanced Anchored Volume Weighted Average Price Technology Unlock the true power of price action with our premium Anchored VWAP Indicator for MetaTrader 5 - the essential tool for precision entries, strategic exits, and high-probability trend continuation setups. Write me a DM for a 7 day free trial. Anchored VWAP Plus gives traders unprecedented control by allowing custom anchor points for Volume Weighted Average Price calculations on any chart. With support for 4 sim
FREE

Liquidity Swings SMC Zones Liquidity Swings SMC Zones is a professional indicator for MetaTrader 5 that automatically detects, displays, and updates liquidity-based swing high and swing low zones directly on your chart. This tool is designed for traders who use Smart Money Concepts (SMC), supply and demand, or support and resistance trading methods. Features Automatic Zone Detection:
Identifies significant swing highs and swing lows based on customizable pivot settings. Clear Visual Zones:
Hi
FREE

Full implementation of Directional Movement System for trading, originally developed by Welles Wilder, with modifications to improve profitability, to reduce the number of unfavorable signals, and with Stop Loss lines.
No re-paint
Features
Buy/sell signals displayed on the chart Stop levels visually indicated on the chart Profit-taking points presented in the indicator window Exit points for unfavorable positions presented in the indicator window Signal confirmation through high/low swing cros

Volume Profile Flex - POC, VAH and VAL with Price Level Display
Volume Profile Flex is a flexible and performance-optimized Volume Profile indicator designed to help traders identify important price levels based on traded volume rather than time.
The indicator provides a clear view of market acceptance areas, price rejection zones, and the most actively traded price levels directly on the chart. Main Features:
The indicator automatically calculates and displays key Volume Profile levels within
FREE
Level Box Tool is a powerful and user-friendly custom indicator designed for traders who utilize technical analysis tools like rectangles and trend lines to identify key support, resistance, and price zones. This tool simplifies and speeds up the process of marking chart levels, offering both visual clarity and precision with its fully customizable panel, and now includes price-cross alerts — so you’ll never miss a key level again. MT4 Version - https://www.mql5.com/en/market/product/136009/ Jo
FREE

本指标 基于 Zigzag 基础上... 增加了: 1.增加了箭头指示,使图表更鲜明 2.增加了价格显示,使大家更清楚的看清价格. 3.增加了报警等设置,可以支持邮件发送 原指标特性: 1.基本的波段指标构型. 2.最近的2个ZIGZAG点不具有稳定性,随着行情而改变,(就是网友所说的未来函数) 3.原指标适合分析历史拐点,波段特性,对于价格波动有一定的指导性.
Zigzag的使用方法一 丈量一段行情的起点和终点 (1)用ZigZag标注的折点作为起点和终点之后,行情的走势方向就被确立了(空头趋势); (2)根据道氏理论的逻辑,行情会按照波峰浪谷的锯齿形运行,行情确立之后会走回撤行情,回撤的过程中ZigZag会再次形成折点,就是回撤点; (3)在回撤点选择机会进场,等待行情再次启动,止损可以放到回撤的高点。 一套交易系统基本的框架就建立起来了。 Zigzag的使用方法二 作为画趋势线的连接点 趋势线是很常见的技术指标,在技术分析中被广泛地使用。 但一直以来趋势线在实战中都存在一个BUG,那就是难以保证划线的一致性。 在图表上有很多的高低点,到底该连接哪一个呢?不同的书上画趋势线的方法
FREE

TG MTF MA MT5 is designed to display a multi-timeframe moving average (MA) on any chart timeframe while allowing users to specify and view the MA values from a particular timeframe across all timeframes. This functionality enables users to focus on the moving average of a specific timeframe without switching charts. By isolating the moving average values of a specific timeframe across all timeframes, users can gain insights into the trend dynamics and potential trading opportunities without sw
FREE

IQ Trade Status – A Professional Trade Panel to track all your LIVE TRADES in a signle dashboard. IQ Trade Status is not just a trade panel; it is a professional dashboard designed for MetaTrader. It replaces the default Terminal window with a clean, structured, and actionable overview of your account and open trades.
The dashboard is designed to help you instantly answer three critical questions: How much have I made today? How much will I lose if all my trades go wrong? Is my account over-lev

Currency Strength Meter - это самый простой способ определить сильные и слабые валюты. Этот индикатор показывает относительную силу 8 основных валют + Золото: AUD, CAD, CHF, EUR, GBP, JPY, NZD, USD, XAU . Символ золота может быть изменен на символ другого инструмента, например такого как XAG, XAU и т.д.
По умолчанию значение силы нормализовано в диапазоне от 0 до 100 для алгоритма RSI: Значение выше 60 означает сильную валюту; Значение ниже 40 означает слабую валюту;
Для работы данного индика

YOU CAN NOW DOWNLOAD FREE VERSIONS OF OUR PAID INDICATORS . IT'S OUR WAY OF GIVING BACK TO THE COMMUNITY ! >>> GO HERE TO DOWNLOAD
More About Advanced Currency Meter Every good forex system has the following basic components: Ability to recognize the trend direction. Ability to identify the strength of the trend and answer the basic question Is the market trending or is it in a range? Ability to identify safe entry points that will give a perfect risk to reward (RR) ratio on every position.
FREE

Blahtech Fisher Transform indicator is an oscillator that displays overbought and oversold locations on the chart. The Fisher Transform algorithm transforms prices with any distribution shape into a normal distribution. The end result is a curve with sharp turning points that may help to identify bullish or bearish trends. Fisher Transform values exceeding 1.66 on the daily chart are considered to be good areas for reversal trades. Links [ Install | Update | Training | All Products ]
F

Donchian Channel is an indicator created by Richard Donchian. It is formed by taking the highest high and the lowest low of the last specified period in candles. The area between high and low is the channel for the chosen period.
Its configuration is simple. It is possible to have the average between the upper and lower lines, plus you have alerts when price hits one side. If you have any questions or find any bugs, please contact me. Enjoy!
FREE
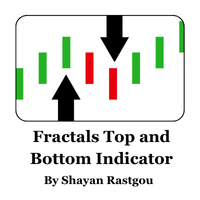
Discover the power of fractals to uncover significant market reversals! This custom Fractals Indicator for MetaTrader 5 is designed to help traders quickly and effectively spot potential swing highs and lows, providing visual cues that make trading decisions easier. Key Features: Clear Buy & Sell Signals: Green and red arrows highlight bullish and bearish fractals, helping you effortlessly identify significant price pivots. Customizable Analysis Depth: Choose the number of bars to evaluate for f
FREE

Volume Profile Pro Signals
Точный анализ объёма встречается с автоматической генерацией сигналов. Что делает индикатор
Volume Profile Pro Signals строит актуальную, основанную на данных картину распределения объёма по ценам — подчёркивая зоны рынка, где цена принимается или отвергается. Он выделяет POC, VAH, VAL и точно определяет зоны HVN/LVN. На этой основе индикатор генерирует сигналы пробоя в реальном времени (VAH/VAL) и отображает продуманные уровни SL/TP, рассчитанные по волатильности (
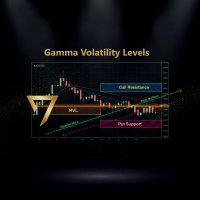
Gamma & Volatility Levels Pro [XAUUSD Edition] – The indicator used by professional gold traders in 2025 Fully automatic indicator developed exclusively for XAUUSD (Gold). Displays in real time the most powerful institutional levels that move gold price every single day: • HVL (High Volatility Level) – Orange dashed line Dynamic extreme volatility level (20-period SMA + 1 standard deviation). Gold bounces or breaks this level 87 % of sessions with moves of +$40 to +$120. • CALL RESISTANCE – Blue

Представьте себе самую редкую пару. Этот индикатор сможет рассчитать ее силу. Этот измеритель сил валют рассчитывает любые символы, будь то валютные пары, металлы, контракты на разницу, сырьевые товары, криптовалюта (например, Bitcoin/BTC или Ethereum/ETH) и даже акции. Просто назовите ее, и индикатор ее рассчитает! Нет такой валютной пары, которую этот индикатор не смог бы рассчитать. Не важно, насколько редкой или экзотической является эта валюта, этот измеритель валют всегда сможет ее рассчит

Phoenix ATR Volatility Meter (MT5)
Инструмент для мониторинга волатильности в реальном времени для MetaTrader 5. Использует средний истинный диапазон (ATR) для отображения текущей волатильности рынка на вашем графике.
Назначение
Волатильность рынка напрямую влияет на размещение стопов, размер позиций, проскальзывание и эффективность стратегии. Торговля без учета волатильности часто приводит к чрезмерному риску на быстро меняющихся рынках или упущенным возможностям в спокойных условиях.
Индик
FREE

Закрытие предыдущего дня и смещение баров для MetaTrader! Индикатор Закрытие предыдущего дня и смещение баров - это инструмент, разработанный для улучшения технического анализа и принятия решений в торговле. С помощью этого индикатора вы получите подробную информацию о уровнях открытия, максимума, минимума и закрытия любого бара, что позволит провести точный и всесторонний анализ движения рынка. Представьте себе возможность поместить один таймфрейм в другой, позволяя детально анализировать кажды
FREE

VM SuperAshi Trend Precision Trend Sniper using Smoothed Heiken Ashi, Supertrend and EMA Trend
Optimized for M1–M5 Scalping
Overview VM SuperAshi Trend is an indicator that combines a standardized Supertrend with smoothed Heiken-Ashi candles to deliver clear, confirmed, and non-repainting buy/sell signals directly on the chart. It automatically draws Buy/Sell arrows, displays Fast, Slow, and Trend EMA lines, and provides Popup, Email, and Push notifications.
Key Features Supertrend-based signal

Multi Currency Strength Dashboard Mini (БЕСПЛАТНО) – Индикатор силы валют для MetaTrader 5 Multi Currency Strength Dashboard Mini — это бесплатный индикатор для MetaTrader 5 , который в реальном времени показывает относительную силу 8 основных валют (USD, EUR, GBP, JPY, CHF, CAD, AUD, NZD) в виде понятной панели (dashboard). Цель: за секунды находить сильные и слабые валюты, чтобы проще формировать список наблюдения и выбирать пары по логике сильная против слабой . Основные возможности (версия M
FREE

Мультивалютный и мультитаймфреймовый индикатор Moving Average (MA). На панели вы можете видеть текущее состояние индикатора — прорывы и касания (ценой) Быстрой МА и Медленной МА, а также пересечение линий МА между собой. В параметрах можете указать любые желаемые валюты и таймфреймы. Также индикатор может отправлять уведомления о касании ценой линий и о их пересечении. По клику на ячейке будет открыт данный символ и период. Параметры
Fast MA
Averaging period — период усреднения для вычисления

Панель предупреждений RSI / TDI позволяет вам одновременно отслеживать RSI (выбирается вами) по каждой основной паре, которой вы торгуете.
Вы можете использовать его двумя способами:
1. Выберите несколько таймфреймов, и тире покажет вам, когда несколько таймфреймов выходят за рамки обычных торговых условий. Отличный индикатор того, что цена в последнее время сильно подросла, поскольку она достигла уровня перекупленности или перепроданности в нескольких временных рамках, поэтому вскоре ожидае
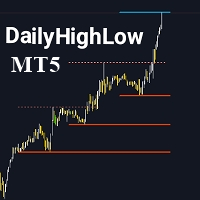
Пожалуйста, не забудьте оценить индикатор, чтобы помочь мне повысить его видимость. Индикатор DailyHighLow для MetaTrader 5 (MT5) — это мощный инструмент для отслеживания ежедневных ценовых движений. Разработанный для трейдеров, которым необходима чёткая и полезная информация о максимумах и минимумах на рынке, этот индикатор автоматически чертит линии тренда на основе самых высоких и самых низких цен за настраиваемый период. Основные особенности: Персонализация линий тренда: Настройте цвета, с
FREE

Smart Entry Levels - Fractal and ATR Based Indicator Smart Entry Levels identifies key support and resistance zones using classical fractal detection and ATR-based volatility measurement. The indicator is designed for clarity, stability, and compliance with MQL5 Market rules. Features Upper Zone - Resistance area based on recent fractal highs Lower Zone - Support area based on recent fractal lows ATR-based sizing - Zones adapt dynamically to market volatility with selectable timeframe Non-repain
FREE

For those who appreciate Richard Wyckoff approach for reading the markets, we at Minions Labs designed a tool derived - yes, derived, we put our own vision and sauce into this indicator - which we called Waves PRO . This indicator provides a ZigZag controlled by the market volatility (ATR) to build its legs, AND on each ZigZag leg, we present the vital data statistics about it. Simple and objective. This indicator is also derived from the great book called " The Secret Science of Price and Volum

The Weis Wave first takes the market volume and then organizes it with the price into Wave charts. It is the only software that will present the true picture of the market before you. If anyone of you, has watched an intraday price movement then you must know that it unfolds in a series of selling as well as buying waves-a procedures tearing down and building up. Wave analysis is an integral part of the trading method. The indicator helps to deal with today’s volatile market. Moreover, it works
FREE

The Breakout Finder (BF) is a technical analysis indicator designed for MetaTrader 5 (MT5) platforms. It identifies potential breakout and breakdown patterns in price action by analyzing pivot highs and lows over a specified period. The indicator detects "cup" formations—clusters of pivot points within a narrow price channel—indicating areas of consolidation that may lead to strong directional moves when broken. EA: BlackHole Breakout EA https://www.mql5.com/en/market/product/149206
Key Featur
FREE
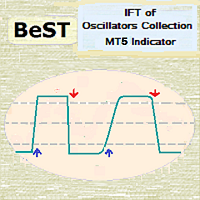
BeST_IFT of Oscillators Collection is a Composite MT4/5 Indicator that is based on the IFT ( Inverse Fisher Transformation ) applied to RSI , CCI , Stochastic and DeMarker Oscillators in order to find the best Entry and Exit points while using these Oscillators in our trading. The IFT was first used by John Ehlers to help clearly define the trigger points while using for this any common Oscillator ( TASC – May 2004 ). All Buy and Sell Signals are derived by the Indicator’s crossings of the Bu

Smart Session Box Displays Asia, London, and New York trading sessions with automatic timezone adjustment and session overlap highlighting. Main Features Complete session analysis with no limitations. Key Features The indicator draws session boxes with high and low lines for each trading session. Session overlaps are highlighted with distinct colors to identify high liquidity periods. Breakout alerts notify when price crosses previous session levels. A control panel provides quick toggles for al
FREE

Contact me after payment to send you the user manual PDF file. Download the MT4 version here. Unlocking Trading Insights Dive into the heart of market dynamics with Advance Divergence Scanner designed for traders seeking a competitive edge. The Divergence Indicator is your key to identifying crucial divergences across various charts, empowering you to make informed decisions in the dynamic world of financial markets. The Divergence A Divergence signals a potential reversal point because directi

MT5 Version : This indicator represents a genuine momentum oscillator according to the true definition of "Momentum", and as realised by the techniques of digital filters. Scholarly papers on the subject by the current developer can be found here and here , but in this description we shall borrow only the minimum of conceptual and mathematical framework needed. In the process, we expose some long-held myths about indicators supposedly measuring price momentum, and in particular the one ca
FREE

Local Time Scale Overlay is a technical indicator for MetaTrader 5 that enhances chart readability by overlaying a local time scale on the trading chart. It calculates the difference between your local system time and the server time and uses this difference to display time labels that reflect your local time at predefined intervals. The time interval is customizable via a drop‐down menu with options such as 5, 10, 15, 20, 30, 60, 120, and 480 minutes (with 15 minutes as the default).
Key Featu
FREE

Swing BOS Structure is a market structure indicator for MetaTrader 5.
The indicator automatically detects: • Swing High (SH) • Swing Low (SL) • Break of Structure (BOS) • Change of Character (CHoCH)
Swings are confirmed only after a defined number of candles, ensuring no repainting. BOS signals indicate trend continuation. CHoCH signals indicate a potential change in market structure and may appear less frequently depending on market conditions and timeframe.
The indicator is lightweight, fa
FREE

Zenith Session Flux is a professional-grade technical indicator for MetaTrader 5 designed to identify and visualize institutional trading windows known as ICT Killzones. The indicator automates the process of time-alignment by synchronizing your broker's server time with New York local time, ensuring that session boxes and price pivots appear at the precise institutional moments regardless of your broker's timezone. Indicator Features: Automatic Timezone Sync: Automatically calculates the offset
FREE

This is RSI with alarm and push notification -is a indicator based on the popular Relative Strength Index (RSI) indicator with Moving Average and you can use it in Forex, Crypto, Traditional, Indices, Commodities. You can change colors to see how it fits you. Back test it, and find what works best for you. This product is an oscillator with dynamic overbought and oversold levels, while in the standard RSI, these levels are static and do not change.
This allows RSI with alarm and push notifica
FREE

Создайте свою стратегию самостоятельно Этот инструмент позволяет вам разрабатывать свои стратегии, используя все доступные индикаторы нативно в MetaTrader и все индикаторы, загруженные из интернета, которые используют буферы для отображения данных на экране. Этот инструмент - еще одна причина рассмотреть MetaTrader для автоматизации ваших торговых стратегий. С его помощью вы можете создавать свои собственные сигналы стратегии простым и интуитивным способом, используя любой индикатор MetaTrader.
FREE

Buy Sell Signal Low TF gives buy/sell signals and alerts with up and down arrow at potential reversal of a pullback or a trend continuation pattern in low timeframe. This is an indicator which gives signals based on trend => It works best in trend market with the principle is to ride on the trend not trade against the trend.
The components of Buy Sell Signal Low TF: - The trend is determined by SMMA 13 , SMMA 21 and SMMA 35 ( can be changed manually to suit your preference). - The signal is b
FREE

Developed by Chuck LeBeau, the Chandelier Exit indicator uses the highest high / lowest low -/+ a multiple of the ATR value to draw trailing stop lines (orange under buys, magenta over sells) that advance with the trend until the trend changes direction.The value of this trailing stop is that it rapidly moves upward in response to the market action. LeBeau chose the chandelier name because "just as a chandelier hangs down from the ceiling of a room, the chandelier exit hangs down from the high
FREE

Breakout Monitor is a powerful trading tool designed to track price action within your custom-drawn zones. Simply draw a rectangle on your chart to define your consolidation or key levels, and the indicator will do the rest. It highlights the price range clearly and monitors it in real-time, ensuring you never miss a significant market move. When the price breaks through your defined boundaries, the indicator sends an instant Push Notification directly to your mobile phone in a clear, actionable
FREE

It is one of the famous indicator in TradingView platform. Supertrend indicator shows the trend of the market intuitively . You can use it for understanding the trend or get insight about the market.
------- Value & Color -------- You can change the colour (line, filled). Default value is the same as Tradingview Supertrend default value ( period 10, ATR multiplier 3.0)

VWAP Fibo Bands RSJ is an indicator that traces the lines of the daily VWAP and from it creates bands using Fibonacci proportions. This spectacular indicator creates 10 band levels through the selected VWAP period using Fibonacci ratios.
It is fantastic how the prices respect each level of the bands, where it is possible to realize that almost every time the price closes above / below a level of the bands he will seek the next one. If close above will seek to reach the level above and if close
FREE

Hydra Trend Rider is a non-repainting, multi-timeframe trend indicator that delivers precise buy/sell signals and real-time alerts for high-probability trade setups. With its color-coded trend line, customizable dashboard, and mobile notifications, it's perfect for traders seeking clarity, confidence, and consistency in trend trading. Setup & Guide: Download MT4 Version here. To learn how to use the Indicator: Indicator Manual & Guide - Read Here
Exclusively for you: It's your chance to st
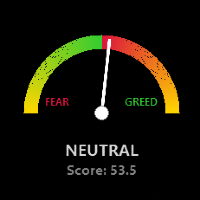
Global Market Risk Sentiment Meter 1. Abstraction The Global Market Risk Sentiment Meter is a sophisticated analytical tool designed for the MetaTrader 5 (MQL5) platform. Unlike traditional indicators that analyze a single asset in isolation, this utility employs an Inter-Market Analysis approach to reconstruct the psychological state of the global financial markets. By aggregating real-time data from US Indices, Global Equities, Cryptocurrencies, and Safe Haven assets (Gold and the US
FREE

Монитор свечных паттернов Phoenix (MT5)
Инструмент для обнаружения и мониторинга свечных паттернов в реальном времени для MetaTrader 5. Автоматически идентифицирует классические свечные паттерны по нескольким символам и отображает комплексную статистику паттернов на визуальной панели инструментов.
Обзор
Монитор свечных паттернов Phoenix обнаруживает и отслеживает паттерны Доджи, Молот, Падающая звезда, Бычий поглощающий, Медвежий поглощающий, Утренняя звезда, Вечерняя звезда, Три белых солдат
FREE

Elliot Waves Analyzer Pro calculates Elliot Waves to Help Identify Trend direction and Entry Levels. Mainly for Swing Trading Strategies. Usually one would open a Position in trend direction for Wave 3 or a Correction for Wave C . This Indicator draws Target Levels for the current and next wave. Most important Rules for Elliot Wave Analysis are verified by the Indicator. The Pro version analyzes Multiple Timeframes and shows the Subwaves and Target-Levels. For an Overview " Elliot Waves Anal

Линии поддержки и сопротивления: Динамические и перемещаемые линии для определения ключевых уровней. Референсный канал: Создает канал между поддержкой и сопротивлением, отображая расстояние в пунктах. Нейтральная зона и каналы для тейк-профита: Генерирует нейтральную зону и несколько каналов для тейк-профита в зависимости от направления рынка (восходящий или нисходящий тренд). Разделение канала: Делит канал на квартили (25%, 50%, 75%) для определения зон интереса. Интерактивные кнопки: Заблокир
FREE

FREE Bookmap Volume Heatmap Indicator Overview The Bookmap Volume Heatmap is a custom MetaTrader 5 (MQL5) indicator that creates a visual heatmap of trading volume distribution across price levels, similar to professional trading platforms like Bookmap. It provides traders with a clear visualization of where significant trading activity has occurred within a specified price range. Key Features 1. Volume Distribution Visualization Creates color-coded rectangles on the chart representing vol
FREE

Product Name: Auto Trend Pattern Pro [Subho - India] Short Description:
An advanced Price Action tool that automatically detects and draws Trend Channels, Wedges, and Triangles with a live Dashboard. Full Description: Auto Trend Pattern Pro is a sophisticated technical indicator designed for MetaTrader 5. It automates the complex task of drawing Trend Lines and Channels. By analyzing historical price action, the indicator identifies the most accurate "Best Fit" channels for both short-term
FREE

This indicator uses support and resistance, volume and some special formula to calculate the volume to filter the candles. If the volume reaches a specific value, And at the same time, Candle breaks the support/resistance line, There would be a signal and we can enter the market. Signals appear when the current candle closes. then you can enter the trade when a new candle appears. Please don't forget to follow your money management plan.
MT4 Version Support/Resistance Breakout MT4 : https:/
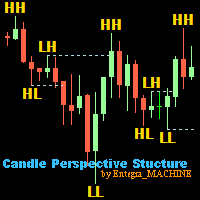
Candle Perspective Structure Indicator MT5 - это простой индикатор определяющий и отображающий свечную структуру рынка. Этот индикатор подойдет как опытным трейдерам, так и новичкам, которым тяжело визуально следить за структурой. Основные функции: Определение High и Low свингов используя паттерн трех свечей. Определение слома структуры. Настройка визуального отображения структурных элементов. Настройка периода, за который анализируется структура. Входящие параметры: General Settings Bars Back -
FREE

A personal implementation of the famous Bollinger bands indicator as a trend following mechanism, which uses a moving average and the standard deviation to define what a trend is and when it changes. Bollinger bands are usually used as an oversold/overbought indicator only, but in my opinion, the trading approach is more complete using the trend variant as an exit strategy. [ Installation Guide | Update Guide | Troubleshooting | FAQ | All Products ] Easy to trade Customizable colors and sizes I
FREE
Volume Profile Density V2.40 Отображает распределение объема по уровням цены, показывая зоны институционального интереса.
В отличие от обычного объема по времени, показывает, где объем реально сосредоточен. Основное: Горизонтальные полосы = объем на каждом уровне цены Длиннее полоса → больше объема Красные зоны = сильная поддержка / сопротивление Использование: Определение зон поддержки и сопротивления Поиск POC (Point of Control) Определение Value Area (70% объема) Использование зон низкого объ
FREE

Multi-period Parallel Random Oscillator 1. Main chart cycle main line and signal line 2. 15M 30M 1H fixed cycle signal line Mainly used to observe the overbought and oversold conditions of other cycles in the same chart。 Its main function is to identify moments of multi-cycle resonance, enabling you to better grasp opportunities for buying and selling points.
FREE

Elliot Waves Analyzer calculates Elliot Waves to Help Identify Trend direction and Entry Levels. Mainly for Swing Trading Strategies. Usually one would open a Position in trend direction for Wave 3 or a Correction for Wave C . This Indicator draws Target Levels for the current and next wave. Most important Rules for Elliot Wave Analysis are verified by the Indicator. This free version is limited for Analyzing one Timperiod Waves. Waves are Shown only in PERIOD_H4 and above. Not Useful for Intr
FREE

ОПИСАНИЕ
ICSM (Impulse-Correction SCOB Mapper) - это индикатор, который анализирует движение цены и определяет действительные импульсы, коррекции и SCOB (ордер блок на одну свечу). Это мощный инструмент, который можно использовать с любым типом технического анализа, так как он гибкий, информативный, прост в использовании и существенно улучшает понимание трейдером наиболее ликвидных зон интереса.
НАСТРОЙКИ
Общие | Визуальные
Цветовая тема - определяет цветовую тему ICSM.
SCOB | Визуальные
Узнайте, как легко и просто купить торгового робота в MetaTrader AppStore - магазине приложений для платформы MetaTrader.
Платежная система MQL5.community позволяет проводить оплату с помощью PayPal, банковских карт и популярных платежных систем. Кроме того, настоятельно рекомендуем протестировать торгового робота перед покупкой, чтобы получить более полное представление о нем.
Вы упускаете торговые возможности:
- Бесплатные приложения для трейдинга
- 8 000+ сигналов для копирования
- Экономические новости для анализа финансовых рынков
Регистрация
Вход
Если у вас нет учетной записи, зарегистрируйтесь
Для авторизации и пользования сайтом MQL5.com необходимо разрешить использование файлов Сookie.
Пожалуйста, включите в вашем браузере данную настройку, иначе вы не сможете авторизоваться.