Смотри обучающее видео по маркету на YouTube
Как купить торгового робота или индикатор
Запусти робота на
виртуальном хостинге
виртуальном хостинге
Протестируй индикатор/робота перед покупкой
Хочешь зарабатывать в Маркете?
Как подать продукт, чтобы его покупали
Технические индикаторы для MetaTrader 5 - 10
TimeLeftCandle – Countdown Clock for Candles in MT5 Overview
TimeLeftCandle is an indicator for MetaTrader 5 that displays in real time the remaining time until the current chart candle closes. Its design is minimalist, clear, and movable, adapting to any type of chart and trading style. Ideal for traders who need to precisely track candle closing times and make timely decisions. Main Advantages Clear and precise display: A digital-style counter to know exactly how much time is left before the
FREE

PipTick Heiken Ashi - это наша версия индикатора Heiken Ashi. В отличие от конкурирующих продуктов, этот индикатор предлагает широкие возможности для расчета свечей Heiken Ashi. Он может отображаться в классическом или сглаженном виде. Данный индикатор рассчитывает Heiken Ashi со скользящей средней четырьмя способами: SMA - простая скользящая средняя SMMA - сглаженная скользящая средняя EMA - экспоненциальная скользящая средняя LWMA - линейно-взвешенная скользящая средняя
Основные характеристик
FREE

This indicator shows the TLH and TLL and some trendlines that allow us to estimate the trend of market. It also shows the values of the angles of the lines in percentage in points (pip) , the standard deviation, and the trend of each line, and when it breaks the lines of support and resistance (TLH and TLL). And finally, it also shows the points identified as supports and resistances through the fractal algorithm in the graph. The high and low trend lines are supported by the highs and lows, th
FREE

ملاحظة هامة: في الصورة تظهر مؤشراتي: مؤشر "مستويات سليمان" ومؤشر "RSI Trend V". مؤشر مستويات سليمان هو تحليل أداة مؤشر قياسية وعالمية ومهنية. تم التواصل مع ما يقرب من 9800 كود نبضي لرسوماتك التحليلية منذ وقت طويل. هذا ليس مؤشرا. مستويات سليمان القوية: Жёлтые пямоугольники ( ملاحظة حول السياسات المالية) - Промечание для нёлты прамоугольникив: "مؤشر الابتكار السيادي والوظائف الحصرية - تم تصميمه : توفير المال من البنوك والمؤسسات في شكل شموع يسلط هؤلاء النقاد الضوء على النشاط المالي النقدي،

Order Block Indicator для MT5 — это мощный инструмент для трейдеров, использующих концепции умных денег и институциональные торговые стратегии. Он автоматически определяет ключевые блоки ордеров на графике, помогая находить зоны с высокой вероятностью разворота и продолжения тренда.
Основные особенности: • Автоматическое определение блоков ордеров – Выделяет сильные зоны покупок и продаж на основе ценового движения и объема. • Поддержка нескольких таймфреймов – Анализируйте блоки
FREE

The indicator that shows the countdown to the change of candles is equipped with an alert when the bar changes (the alert is not active if installed on the M1 time frame). Displays seconds if installed in time frame M1, displays minutes and seconds if installed in time frame above M1, and displays hours and minutes if installed in time frame h1 and above. The time displayed is calculated based on the running time.
FREE

Phoenix Moving Average Meter (MT5)
Профессиональный инструмент для анализа и визуализации тренда скользящего среднего для MetaTrader 5. Объединяет интеллектуальный анализ наклона, измерение ширины облака и классификацию режимов в наглядной панели инструментов в режиме реального времени.
Обзор
Phoenix Moving Average Meter анализирует взаимосвязь между быстрым и медленным скользящим средним для определения направления, силы и зрелости тренда. Индикатор непрерывно отслеживает угол наклона MA, ра
FREE

Easy Trend , as the name implies, is an indicator that easily shows the prevailing trend by bringing several indicators into one. The strategy is: when all indicators point in the same direction a signal is triggered. When red, is a signal to sell, when blue, signal to buy. It is that simple :) There are a total of 9 indicators: Moving Average, RSI, CCI, Parabolic SAR, William's Range, Stochastic, MACD, ADX and Heiken Ashi. It is possible to configure each of these indicators to suit your way of

M5 Scalp Wick Entry Arrows
Индикатор отображает на графике два независимых вида стрелок. Оба типа стрелок рассчитываются строго по данным таймфрейма M5, при этом сам индикатор можно устанавливать на любой таймфрейм для удобного просмотра и анализа. Стрелки помогают быстро отмечать потенциально важные моменты, не перегружая график лишними линиями. В настройках доступны размер стрелок и их цвета. Протестировано на XAUUSD (золото) и EURUSD.
FREE

Stargogs Spike Catcher V4.0 This Indicator is Developed To milk the BOOM and CRASH indices .
Now Also work on weltrade for PAIN and GAIN indices. Send me Message if you need any help with the indicator. CHECK OUT THE STARGOGS SPIKE CATCHER EA/ROBOT V3: CLICK HERE ALSO CHECK OUT SECOND TO NONEFX SPIKE CATCHER: CLICK HERE STARGOGS SPIKE CATCHER V4.0 WHATS NEW! Brand New Strategy. This is the Indicator you need for 2025. New Trend Filter to minimize losses and maximize profits. New Trendline th
Ekom Spike Detector
Navigate the volatile world of Boom and Crash indices with the Ekom Spike Detector Indicator. This powerful tool detects explosive price movements, providing traders with precise buy and sell signals 24/7.
Key Features:
Spike Detection : Identify high-probability spike patterns in real-time Clear Visual Signals : Displays clear buy and sell arrows on the chart for easy decision-making Customizable : Easily switch from either Boom based on individuals choice Reliable : Te
FREE

This MQL5 indicator draws four Exponential Moving Averages (EMAs) — 21, 50, 100, and 200 — directly on the chart window.
The EMA 21 is displayed as a color-changing line , while EMA 50, 100, and 200 are standard single-color lines.
The color of EMA 21 changes dynamically based on price position.
When the closing price is above EMA 21 , the line turns blue , indicating bullish pressure.
When the closing price is below EMA 21 , the line turns yellow , indicating bearish pressure.
If the price equa
FREE

Стратегия "Agulhadas" Вдохновленная популярными концепциями бразильского рынка, эта стратегия объединяет пять технических индикаторов для определения потенциальных точек входа и выхода на основе трендов, силы рынка и импульса. Среди используемых индикаторов — известный Didi Index, разработанный Одаиром Агиаром, широко применяемый для анализа пересечений скользящих средних. Скачать Сканнер акций Используемые индикаторы Didi Index ADX Полосы Боллинджера Trix Стохастик Как работает стратегия Индика
FREE

Candle Counter - это индикатор, который печатает количество свечей от первой свечи дня. Первая свеча дня будет иметь номер 1, и каждая новая свеча будет увеличиваться на 1 в этом подсчете.
Входные параметры Выберите четное, нечетное или все Расстояние от свечи до печати числа Размер шрифта текста Цвет шрифта текста
Если у вас остались вопросы, свяжитесь со мной в прямом сообщении: https://www.mql5.com/ru/users/robsjunqueira/
FREE
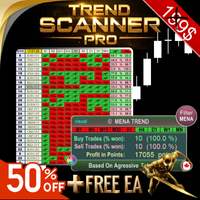
Trend Scanner PRO First of all, it’s worth emphasizing that this trading system is 100% Non-Repainting, Non-Redrawing, and Non-Lagging ,
which makes it ideal for both manual and algorithmic trading setups. Online course, user manual, and downloadable presets included. The Trend Scanner Dashboard is a professional multi pair scanner that analyzes multiple symbols and timeframes at once, giving you an instant market scanner view of the real trend direction. Instead of switching charts endl

Эта информационная панель представляет собой инструмент оповещения для использования с индикатором разворота структуры рынка. Его основная цель - предупредить вас о возможностях разворота на определенных временных рамках, а также о повторных проверках предупреждений (подтверждении), как это делает индикатор. Панель инструментов предназначена для самостоятельного размещения на графике и работы в фоновом режиме, чтобы отправлять вам оповещения о выбранных вами парах и таймфреймах. Он был разработ

Contact me to send you instruction and add you in group.
QM (Quasimodo) Pattern is based on Read The Market(RTM) concepts. The purpose of this model is to face the big players of the market (financial institutions and banks), As you know in financial markets, big traders try to fool small traders, but RTM prevent traders from getting trapped. This style is formed in terms of price candles and presented according to market supply and demand areas and no price oscillator is used in it. RTM conc

Успех или неудача при торговле на рынке Форекс по большей части зависит от управления капиталом. Как известно, открытие каждой сделки сопряжено с риском потери денег. Именно поэтому так важно контролировать риск.
Использование соотношения риска к прибыли в торговле При помощи Risk Reward Ratio для MetaTrader вы сможете оценивать риск каждой сделки, открытой на валютном рынке. Благодаря этому инструменту вы сможете проверить соотношение риска к прибыли у каждой запланированной сделки и точно оце
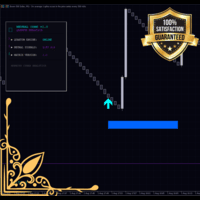
Monet Signal Master - Advanced Neural Trading System Version 1.00 Author: MONETFX Introduction Monet Signal Master is a professional technical indicator for MetaTrader 5 that generates non-repainting buy and sell signals using advanced multi-oscillator analysis. The indicator combines Stochastic and RSI crossovers with SuperTrend filtering to identify high-probability trading opportunities. Features include a cyberpunk-style dashboard, visual risk management zones, and comprehensive alert system
FREE

First time on MetaTrader, introducing IQ Star Lines - an original Vedic Astrology based indicator. "Millionaires don't use astrology, billionaires do" . - J.P. Morgan, Legendary American financier and banker.
IQ Star Lines, an unique astrological indicator purely based on Vedic astrology calculations, published for the first time on Metatrader. This unique tool plots dynamic planetary grid lines based on real-time stars, constellations, and celestial movements, which allows you to plot t
Scalper Pro – Профессиональный индикатор для скальпинга XAUUSD, EURUSD и JPY (M1/M5/M15) с объёмными всплесками и пробоями структуры рынка Торгуйте умнее. Торгуйте быстрее. Торгуйте с Scalper Pro. Scalper Pro — это высокопроизводительный индикатор скальпинга для MetaTrader 5 , созданный для профессиональных трейдеров , специализирующихся на скальпинге золота XAUUSD, внутридневной торговле EURUSD и стратегиях пробоя JPY .
Разработан для точности на графиках M1 и поддерживает подтверждение сигнало

Boom and crash Gold Miner v2 trend histogram which works in conjunction with the indicator above that has arrows as shown in the video. PLEASE Note: That the top indicator and the bottom indicator are two separate indicators. the top indicator is https://www.mql5.com/en/market/product/98066 the bottom one is free. which is the histogram at the bottom. the trend histogram trading tool that helps to easy detect the trend blue color indicates an uptrend. Orange color is a down trend.
FREE

Strifor Lot Calculator — это индикатор для MetaTrader 5, который помогает трейдерам рассчитывать оптимальный размер лота исходя из заданного риска и стоп-лосса.
Он позволяет торговать более осознанно, управлять рисками и экономить время на ручных расчетах. Преимущества Точный контроль риска — автоматический расчет размера лота в зависимости от выбранного процента риска. Два режима работы — ручной ввод параметров или расчет по линиям на графике. Поддержка популярных инструментов — валютные пары,
FREE

Cогласно торговой стратегии Б. Вильямса, описанной в книге "Торговый Хаос 2" , индикатор отображает на графике цены: 1. Бары медвежьего и бычьего разворота: Бар медвежьего разворота окрашивается в красный или розовый (красный – более сильный сигнал). Бар бычьего разворота окрашивается в синий или голубой цвет (синий – более сильный сигнал). 2. Формацию "Ангуляция" с оценкой скорости расхождения. 3. Уровень установки отложенного ордера (отображается в виде пунктирной линии). Ангуляция образуется

Haven RSI Candlestick — это инновационный технический индикатор, который преобразует традиционный линейный график Relative Strength Index (RSI) в интуитивно понятную форму свечного графика (K-линий).
Этот инструмент разработан для трейдеров, которые полагаются на технический анализ и стремятся быстрее и глубже интерпретировать рыночный импульс и потенциальные точки разворота. Другие продукты -> ЗДЕСЬ . Ключевые особенности: Визуализация RSI в виде свечей: Ключевая функция. Теперь вы можете напр
FREE

KT Knoxville Divergence — это мощный инструмент, который выявляет уникальные ценовые дивергенции на финансовых рынках, используя тщательно подобранную комбинацию индикатора относительной силы (RSI) и индикатора импульса. Этот индикатор эффективно фиксирует тонкие изменения рыночной динамики и помогает трейдерам точнее находить потенциально прибыльные торговые возможности. Knoxville Divergence — это тип дивергенции в трейдинге, разработанный Робом Букером. Дивергенция возникает, когда цена актив

KT Stochastic Alerts — это персональная реализация стохастического осциллятора, которая подаёт сигналы и оповещения на основе шести пользовательских событий: Бычий кроссовер: когда основная линия стохастика пересекает сигнальную снизу вверх. Медвежий кроссовер: когда основная линия стохастика пересекает сигнальную сверху вниз. Когда стохастик входит в зону перекупленности. Когда стохастик выходит из зоны перекупленности. Когда стохастик входит в зону перепроданности. Когда стохастик выходит из

KT Price Border создаёт трехполосный ценовой канал, который определяет потенциальные области разворота рынка. Эти уровни также могут использоваться в качестве динамической поддержки и сопротивления. Средняя полоса может использоваться для определения направления тренда. Таким образом, индикатор также выполняет функцию трендового инструмента. Кроме того, его простота использования и понятные торговые сигналы приносят значительную пользу начинающим трейдерам.
Особенности
Хорошо работает на больш

Повысьте точность торговли с помощью Fibonacci Killer Alert MT5 — мощного индикатора, использующего уровни коррекции Фибоначчи для предоставления точных сигналов входа на рынках форекс, акций, криптовалют и сырьевых товаров. Высоко ценится в торговых сообществах, таких как Forex Factory и Reddit’s r/Forex, и отмечен в обсуждениях на Investopedia и TradingView за точность в определении разворотов и продолжений тренда, этот индикатор является фаворитом среди трейдеров, ищущих высоковероятные устан

Сканер Stochastic Multicurrency Scanner Dashboard MT5 — это мощный инструмент для мониторинга множества валютных пар и таймфреймов с использованием осциллятора Стохастик. Он организует сигналы в табличном формате, отображая статус каждого символа по таймфреймам от M1 до MN1. Трейдеры могут включать или отключать определенные таймфреймы в соответствии со своими стратегиями. Версия для MT4 доступна здесь: Stochastic Oscillator Multicurrency Scanner MT4 Для подробной документации нажмите здесь: Док
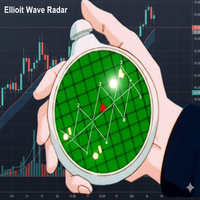
Что делает этот индикатор? Он автоматически анализирует график, чтобы определить паттерны волн Эллиотта (импульсы и коррекции), и показывает, где находятся волны 1, 2, 3, 4 и 5 в реальном времени. Кроме того, он включает ценовые проекции , проверку объёмов и определение треугольников . В чем эта версия «Радар» лучше? Проекция целей: Подсказывает, куда может двигаться цена в волне 5. Проверка объёмов: Подтверждает, поддерживают ли объёмы обнаруженный паттерн. Определение треугольников: Идентифици
FREE
Лучший инструмент для ловли стрелы и ударов шипов, как профессионал !!!
Вы хотите стать трейдером с постоянным бумом и крахом Это расширенный индикатор, используемый для предварительного обнаружения всплесков индексов бума и падения. Он предупреждает о входах с высокой вероятностью с удивительной вероятностью успеха. Мы рекомендуем использовать виртуальный частный сервер для круглосуточного получения уведомлений по электронной почте или телефону.
Как торговать с Mega Spikes Max 1.4? Когда н

Full implementation of Directional Movement System for trading, originally developed by Welles Wilder, with modifications to improve profitability, to reduce the number of unfavorable signals, and with Stop Loss lines.
No re-paint
Features
Buy/sell signals displayed on the chart Stop levels visually indicated on the chart Profit-taking points presented in the indicator window Exit points for unfavorable positions presented in the indicator window Signal confirmation through high/low swing cros

This Demand & Supply Zone Indicator with Volume Filtering is a technical analysis tool for MetaTrader that identifies key price zones where buying (demand) or selling (supply) pressure is concentrated. It uses fractals, volume analysis, and price action to detect and highlight these zones on the chart. Key Features: Zone Detection Based on Fractals Identifies demand (support) and supply (resistance) zones using fractal patterns (local highs/lows). Zones are formed from open prices ar
FREE

Are you tired of drawing Support & Resistance levels for your Quotes? Are you learning how to spot Support & Resistances? No matter what is your case, Auto Support & Resistances will draw those levels for you! AND, it can draw them from other timeframes, right into you current chart, no matter what timeframe you are using... You can also Agglutinate regions/zones that are too much closer to each other and turning them into one single Support & Resistance Level. All configurable.
SETTINGS
Timefr
FREE
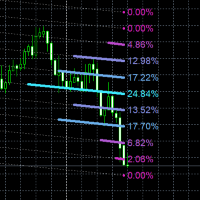
Индикатор Linear Regression Volume Profile объединяет анализ линейной регрессии с профилированием распределения объема для создания усовершенствованного инструмента визуализации рыночной структуры. Основа начинается с расчета линейной регрессии по заданному количеству исторических баров, вычисляя значения наклона и точки пересечения с осью Y, которые определяют траекторию линии тренда через ценовое действие. Эта линия регрессии служит центральной осью, вокруг которой анализируется распределение

This indicator automatically identifies demand and supply zones on a number of 1000 candles or more, and you can change that number of settings.
It also carries a high level of accuracy in describing the type of each zone, as it contains:
Weak areas .
Untested areas . Strong areas . Role-taking areas . Areas tested + number of times visited . Areas to which a return is expected, depending on the direction . The indicator contains alert zones.
For signals and more free indicators, you can foll
FREE

ScalpReactor X A Tactical Indicator for Precision Traders The Ritz Scalping Habbit is a powerful MT5 indicator designed to help traders execute disciplined, high-probability trades through clear visual cues and multi-strategy confirmations. Whether you’re an intraday scalper or a swing trader , this tool integrates advanced market analysis into a single, easy-to-use interface. Key Strengths: Smart Buy & Sell Arrows — Based on multi-layer signals from RSI, ATR, EMA, ADX, and price momentum. Colo

ATREND: Как это работает и как его использовать Как это работает Индикатор "ATREND" для платформы MT5 разработан для предоставления трейдерам надежных сигналов на покупку и продажу с использованием комбинации методов технического анализа. Этот индикатор в первую очередь использует среднюю истинную амплитуду (ATR) для измерения волатильности, наряду с алгоритмами обнаружения тренда для выявления потенциальных движений рынка. Оставьте сообщение после покупки и получите специальный бонусный подаро

Gold Scalper Pro PSAR ADX Dashboard MT5 Профессиональный многоинтервальный индикатор с продвинутым распознаванием сигналов Обзор Parabolic SAR V3 + ADX — это сложный технический индикатор, который объединяет возможности трендовой модели Parabolic Stop and Reverse (PSAR) с измерением силы импульса с помощью индекса Average Directional Index (ADX). Эта улучшенная версия включает оптимизацию для конкретных валютных пар, систему многоязычных уведомлений и подробную панель многовременных интервалов д

SUPERTREND INDICATOR MT5 Developer: gedeegi General Description GEN SmartTrend Signal is a comprehensive technical indicator for MetaTrader 5 (MT5), focused on trend identification and automated risk management. It utilizes a refined SuperTrend -based algorithm powered by the Average True Range (ATR) to determine the primary trend direction. What sets this indicator apart is its integrated trade management features displayed directly on the chart, including visual placement of Stop Loss (SL)
FREE

Ренко - это вневременной график, то есть он учитывает не период времени, а изменение цены, что делает изменение цены на графике более четким.
Hyper Renko является индикатором, который обеспечивает это.
Для настройки у вас есть только один параметр - размер свечи в тике *, который вы хотите использовать.
* галочка: это наименьшее возможное изменение актива.
Спасибо за выбор индикатора Hyper Trader.
Википедия: Диаграмма Ренко показывает минимальное изменение значения переменной - например, ц
FREE

This is a simple Candle Stick Pattern Indicator, which shows in the current time period all standardisized Patterns in the chart. All Patterns will be calculatet automatically based on standard conditions. Following Candle Stick Patterns are included: Bullish Hammer | Bearish Hammer Bullish Inverted Hammer | Bearish Inverted Hammer Bullish Engulfing | Bearish Engulfing Piercing | Dark Cloud Cover Bullish 3 Inside | Bearish 3 Inside There are only a few settings at the begining to take. Every Pat
FREE

ADVANCED MARKET ANALYSIS INDICATOR Overview of the Indicator
This is not a simple indicator — it’s a multi-analysis predictive system. It combines:
Volume Profile (POC, VAH, VAL)
Fibonacci Extensions
Pivot Levels (Daily, Weekly, 4H)
Trend Determination (MA-based)
Smart Money Concepts & Pattern Detection (basic placeholders for expansion)
Prediction Engine (projects price forward for 1 hour)
It gives you:
Target Price Line (projection)
Stop Loss Line (usually at Volume POC)
FREE

Chart Symbol Changer для MT5 - это индикатор / утилита, которая предлагает вам возможность изменить текущий графический символ, на который прикреплен, одним нажатием кнопки символа на его панели. Chart Symbol Changer для MT5 дает вам возможность настроить кнопки с 32 символами в соответствии с вашими личными предпочтениями, добавив пары, за которыми вы хотите следить и торговать чаще. Таким образом, вы никогда не упустите возможность, потому что вы можете быстрее просматривать рынок на св
FREE
Level Box Tool is a powerful and user-friendly custom indicator designed for traders who utilize technical analysis tools like rectangles and trend lines to identify key support, resistance, and price zones. This tool simplifies and speeds up the process of marking chart levels, offering both visual clarity and precision with its fully customizable panel, and now includes price-cross alerts — so you’ll never miss a key level again. MT4 Version - https://www.mql5.com/en/market/product/136009/ Jo
FREE

Introduction The "Ultimate Retest" Indicator stands as the pinnacle of technical analysis made specially for support/resistance or supply/demand traders. By utilizing advanced mathematical computations, this indicator can swiftly and accurately identify the most powerful support and resistance levels where the big players are putting their huge orders and give traders a chance to enter the on the level retest with impeccable timing, thereby enhancing their decision-making and trading outcomes.
FREE
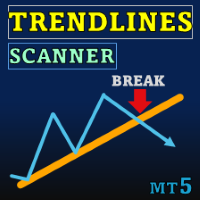
Special offer : ALL TOOLS , just $35 each! New tools will be $30 for the first week or the first 3 purchases ! Trading Tools Channel on MQL5 : Join my MQL5 channel to update the latest news from me Trendlines with Breaks Scanner — это современный торговый инструмент, предназначенный для помощи трейдерам в выявлении критически важных трендов и определении прорывов в режиме реального времени. Благодаря автоматически создаваемым трендовым линиям на основе точек поворота, этот индикато

Индикатор отображает профили объёма по принципу вложенности. Периоды профилей предустановлены так, что каждый последующий профиль имеет протяжённость вдвое большую, чем протяжённость предыдущего профиля. Помимо профилей индикатор отображает кластеры объёма, отсортированные по цвету, в зависимости от содержащегося в них объёма.
Особенности работы индикатора Индикатор работает на типовых таймфреймах от M5 до MN, но для вычислений использует исторические данные меньших таймфреймов: M1 - для таймф
FREE
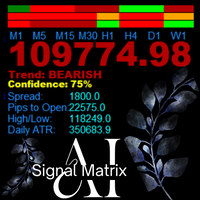
AanIsnaini Signal Matrix MT5 Multi-Timeframe Confidence Signal Dashboard The Free Version of AanIsnaini Signal Matrix MT5 Pro AanIsnaini Signal Matrix MT5 is a powerful all-in-one indicator that analyzes market direction and confidence levels across multiple timeframes — allowing traders to see the overall bias of the market at a single glance. It combines signals from Price Action , Support–Resistance , and several proven technical tools (MACD, ADX, RSI, MA slope, ATR, and Volume Ratio), then
FREE

SAM Waves PRO – Professional Signal Indicator for Day Trading SAM Waves PRO is the extended version of the popular SAM Waves indicator, designed specifically for disciplined intraday Forex traders. It includes real-time notifications via push, email, and sound alerts, ensuring you never miss a qualified trading signal. Backtested on over 5.5 years of historical data, the strategy has achieved a consistent win rate above 60 percent when traded using a fixed stop loss and take profit between 20 an

BeST_Oscillators Collection is a Composite MT5 Indicato r including the Chaikin , Chande and TRIX Oscillators from which by default Chaikin and TRIX Oscillators but not Chande Momentum Oscillator are contained in MT5 platform. It also provides for each Oscillator the option of displaying or not a Mov. Average as a Signal Line and the resulting Signals as Arrows in a Normal (all arrows) or in a Reverse Mode (without showing up any resulting successive and of same type arrows).
Analytically fo
FREE

This indicator is an MQL5 port inspired by the "Cyclic Smoothed RSI" concept originally developed by Dr_Roboto and popularized by LazyBear and LuxAlgo on TradingView. The Cyclic Smoothed RSI (cRSI) is an oscillator designed to address the two main limitations of the standard RSI: lag and fixed overbought/oversold levels. By using digital signal processing (DSP) based on market cycles, the cRSI reduces noise without sacrificing responsiveness. It features Adaptive Bands that expand and contract
FREE

Преимущество, которого вам не хватает, чтобы стать профессионалом. Следуйте за пошаговой системой, которая обнаруживает самые мощные прорывы!
Изучите рыночные модели, которые дают возможность получить значительную прибыль на основе проверенной и протестированной стратегии.
Воспользуйтесь своим важным преимуществом
Получите его здесь www.mql5.com/en/blogs/post/723208
Версия надежного советника
Автоматизируйте сигналы Breakout EDGE с помощью "EA Breakout EDGE" ссылка У вас есть доступ к уник

Баланс спроса и предложения – простой и достаточно эффективный метод анализа рынка. Заблаговременно, ещё до разворота тренда, диаграмма спроса и предложения подскажет нам – где закончилось предложение и уже зарождается спрос, где закончился спрос и уже зарождается предложение – существенно увеличивая вероятность совершения сделки с высоким профит фактором и в правильном направлении.
Сигналы индикатора По сочетанию значений цена/объём индикатор генерирует сигналы: ED (Excess demand) – избыточный

Necessary for traders: tools and indicators Waves automatically calculate indicators, channel trend trading Perfect trend-wave automatic calculation channel calculation , MT4 Perfect trend-wave automatic calculation channel calculation , MT5 Local Trading copying Easy And Fast Copy , MT4 Easy And Fast Copy , MT5 Local Trading copying For DEMO Easy And Fast Copy , MT4 DEMO Easy And Fast Copy , MT5 DEMO Расширенные полосы Боллинджера:
1. Рельс Боллинджера изменит цвет в зависимости от направлени
FREE

Симметричный треугольный паттерн представляет собой период сокращения и консолидации, прежде чем цена вынуждена совершить прорыв вверх или пробой. Пробой нижней линии тренда указывает на начало нового медвежьего тренда, а прорыв верхней линии тренда указывает на начало нового бычьего тренда.
Версия MT4 доступна здесь: https://www.mql5.com/en/market/product/68709/
Этот индикатор идентифицирует эти паттерны и предупреждает вас, когда формируются 4 ключевые точки и цена снова возвращается в треу

Check out my TRADE PLANNER MT5 – strongly recommended to anticipate account scenarios before risking any money. You get a professional moving average indicator with multiple calculation methods available, including exponential, linear, smoothed and linear weighted approaches. The indicator is designed to work on smoothed Heikin Ashi candles, which are included in the 'Examples' folder of Meta Trader 5. By applying this tool, traders can significantly reduce unwanted market noise.
FREE

Breakout Monitor is a powerful trading tool designed to track price action within your custom-drawn zones. Simply draw a rectangle on your chart to define your consolidation or key levels, and the indicator will do the rest. It highlights the price range clearly and monitors it in real-time, ensuring you never miss a significant market move. When the price breaks through your defined boundaries, the indicator sends an instant Push Notification directly to your mobile phone in a clear, actionable
FREE
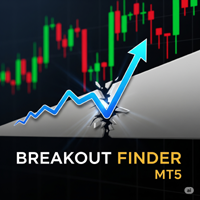
The "Breakout Finder" is a technical indicator designed to automatically identify potential price breakouts and breakdowns on a chart. The highlight of this indicator is its robust signal filtering system, which helps traders avoid false signals (fakeouts) and focus on higher-probability trading opportunities. Key Features Automatic Pivot Point Detection: The indicator automatically identifies significant pivot highs and lows on the chart to establish potential support and resistance levels. Bre
FREE

OMEGA ONE SPIKE DETECTOR: Catch Every Explosive Move /Spikes with Surgical Precision
"I Used To Watch Spikes Fly By - Now I Catch Them Consistently Using Institutional Order Levels"
WATCHING 500-POINT SPIKE and not profiting? ENTERING TOO LATE after the big move already happened? GETTING STOPPED OUT right before the explosion?
What If You Could See Spikes BEFORE They Happen - And Know Exactly Where to Enter?
Introducing Omega One Spike Detector - The Only Tool That Combines Real-T

The worktime indicator helps you identify the most important times to day to trade the currency pairs. It was created based on the ICT day trading free tutorials that are freely vailable on his youtube channel. You can use this indicator together with my other indicators that i have shared freely with you like the true day, custom periods, daily month, weekly open lines - they together complement each other very well.
Nuggets from this indicator: 1. Draws the asian session box showinng you the
FREE

Улучшенная версия MACD Histogram (для отслеживания изменения силы тренда) Стандартный индикатор MACD в MT5 использует значение самой линии MACD для построения гистограммы. В условиях быстрых колебаний или бокового движения такие столбцы изменяются медленно и не всегда наглядно отражают ускорение или замедление бычьей или медвежьей силы. Особенно это заметно, когда цена ещё не демонстрирует явного разворота — сигнал запаздывает. В этой версии используется классическое определение MACD Histogram :
FREE

Cumulative Delta Volume Indicator for MT5 (CDV Indicator for MT5) Volume-Based Market Sentiment and Trend Strength Indicator The Cumulative Delta Volume (CDV) indicator analyzes the balance between buying and selling volume to reveal the underlying market sentiment.
By accumulating the difference between upward and downward volume, it shows whether buyers or sellers are in control and helps traders confirm the strength or weakness of a trend. This tool provides both candle-based visualization an
This indicator is designed to automate the process of identifying and visualizing market structure, a cornerstone of price action and Smart Money Concepts (SMC) trading. It intelligently maps the flow of the market by plotting Higher Highs (HH), Higher Lows (HL), Lower Highs (LH), and Lower Lows (LL) directly on your chart. How It Works The indicator's logic is based on detecting pivot swing points using a configurable number of bars to the left and right of a candle. It then uses these pivots t
FREE
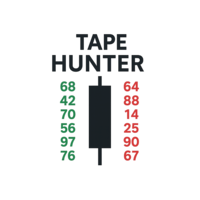
Tape Hunter – Ваш радар усилий и результата в MT5 Tape Hunter — это идеальный индикатор для трейдеров, которые хотят видеть настоящую игру за ценами на MetaTrader 5. Он четко и интуитивно показывает агрессивные объемы покупок и продаж на основе POC (Point of Control), позволяя визуализировать усилия рынка и реальный результат на каждом свече. ️ Почему это важно?
Не весь объем двигает цену! Tape Hunter показывает, действительно ли усилия (агрессивный объем) эффективно влияют на движение ц
Note: The inputs of this indicator are in the Arabic language An advanced RSI indicator that displays dynamic linear regression channels in both the indicator window and the price chart, with predefined horizontal levels to detect overbought and oversold zones. Main Features (Summary): Synchronized linear regression channels on both price and RSI Multitimeframe support Smart and ready-to-use horizontal levels Professional design with optimized performance Feedback & Support We value your ex
FREE
Advanced Market Analysis Tool. Full Documentation: Download Free Professional Education Course: After purchasing, contact me to receive access to the complete CDV Professional Training Video Course. — It will help you master CDV , Aggressive Buyer & Seller dynamics , and Volume Microstructure concepts through a clear, step-by-step learning process. Overview The Professional CDV with Aggressive Score is a comprehensive volume analysis tool that combines visual Cumulative Delta Volume (CDV)

Liquidity Swings SMC Zones Liquidity Swings SMC Zones is a professional indicator for MetaTrader 5 that automatically detects, displays, and updates liquidity-based swing high and swing low zones directly on your chart. This tool is designed for traders who use Smart Money Concepts (SMC), supply and demand, or support and resistance trading methods. Features Automatic Zone Detection:
Identifies significant swing highs and swing lows based on customizable pivot settings. Clear Visual Zones:
Hi
FREE

INDICATOR: GEN Zenith Developer: gedeegi General Description GEN Zenith is a technical indicator designed to automatically identify price reversal patterns (Zenith) based on pivot price detection and delta volume movement. This indicator looks for points where the price forms a swing high or swing low, then detects a breakout from that area to confirm a strong reversal signal. This indicator is highly suitable for reversal and breakout strategies, or as a signal confirmation tool in your tradin
FREE
MetaTrader Маркет - лучшее место для продажи торговых роботов и технических индикаторов.
Вам необходимо только написать востребованную программу для платформы MetaTrader, красиво оформить и добавить хорошее описание. Мы поможем вам опубликовать продукт в сервисе Маркет, где его могут купить миллионы пользователей MetaTrader. Так что занимайтесь только непосредственно своим делом - пишите программы для автотрейдинга.
Вы упускаете торговые возможности:
- Бесплатные приложения для трейдинга
- 8 000+ сигналов для копирования
- Экономические новости для анализа финансовых рынков
Регистрация
Вход
Если у вас нет учетной записи, зарегистрируйтесь
Для авторизации и пользования сайтом MQL5.com необходимо разрешить использование файлов Сookie.
Пожалуйста, включите в вашем браузере данную настройку, иначе вы не сможете авторизоваться.