 MetaTrader 5
 Эксперты
 Индикаторы
 Библиотеки
 Утилиты
 Виджеты
 Правила
Смотри обучающее видео по маркету на YouTube
Как купить торгового робота или индикатор
Запусти робота на
виртуальном хостинге
виртуальном хостинге
Протестируй индикатор/робота перед покупкой
Хочешь зарабатывать в Маркете?
Как подать продукт, чтобы его покупали
Технические индикаторы для MetaTrader 5 - 94
 На основании сигналов технических индикаторов принимаются решения относительно открытия или закрытия сделки на фондовом и форекс-рынках. Суть индикаторов заключается в математическом преобразовании цены и/или объемов финансового инструмента для прогнозирования изменений цен в будущем.
Протестируйте технические индикаторы, чтобы лучше предсказывать поведение рынка и зарабатывать на этом.
На основании сигналов технических индикаторов принимаются решения относительно открытия или закрытия сделки на фондовом и форекс-рынках. Суть индикаторов заключается в математическом преобразовании цены и/или объемов финансового инструмента для прогнозирования изменений цен в будущем.
Протестируйте технические индикаторы, чтобы лучше предсказывать поведение рынка и зарабатывать на этом. 
Ииндикатор отслеживает рыночный тренд, игнорируя резкие колебания рынка и шумы вокруг средней цены. Показывает точки для входа в рынок, точки потенциального разворота рынка. Индикатор реализует разновидность технического анализа, основанную на идее о том, что рынок имеет циклическую природу. Индикатор можно использовать как для пипсовки на мелких периодах, так и для долгосрочной торговли.

Hello, pleasure to welcome you here, my name is Guilherme Santos. QB Indicator is the best indicator with easy to setup built-in RSI, truly a powerful tool! Basically its concept is to indicate entries in regions of market exhaustion. Just attach it with the default settings on any currency pair and watch the magic happen. Also try and other timeframes like M1 and M15. Some settings available: RSI Period RSI Overbought Limit RSI Oversold Limit when to buy When the indicator sets a green arrow on

Dynamic Market Insights for Smart Trading Our goal is to provide seamless, high-quality services that empower market participants, traders, and analysts with real-time market insights and key indicators for informed decision-making. Advanced & User-Friendly Trend Analysis This is a cutting-edge, highly robust, and easy-to-use dynamic trend analysis indicator. The DYJ Market Watch Indicator evaluates market bullish and bearish strength using two distinct methods—each designed to measure differe

RSI Crossover Alert — это мощная система уведомлений, разработанная специально для трейдеров, которые используют индекс относительной силы (RSI) в своих торговых стратегиях. Этот индикатор фокусируется на выявлении пересечений RSI, которые происходят, когда быстрая линия RSI пересекает выше или ниже медленную линию RSI. Комбинируя эти пересечения, индикатор эффективно отфильтровывает ложные сигналы, позволяя трейдерам принимать более точные торговые решения. RSI Crossover Alert предлагает
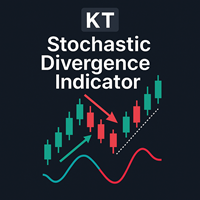
Если вы замечали, что цена обновляет максимум, а Stochastic не подтверждает это движение, вы уже понимаете, почему трейдеры следят за дивергенциями. KT Stoch Divergence отмечает такие расхождения прямо на графике, помогая находить возможные развороты и точки продолжения тренда без ручного построения линий. Индикатор определяет обычные и скрытые дивергенции между ценой и осциллятором Stochastic. Он дает дополнительный контекст, а не готовую команду на вход. Окончательное решение всегда остается з
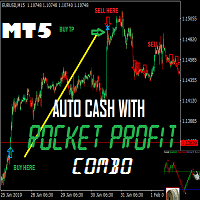
This is a great Metatrader5 Tool , which you can use Daily for your profitable Trading. The Accuracy is the best system you need to succeed in trading without stress. The signals doesn't repaint at all, alerts on bar close, and stays glued. The system works on MT5 and another version for MT4 also available.
What you get upon purchase:
-Lifetime support for the use of the system - Easy to use, clean user friendly interface with no single settings required - Arrow Signals showing where to b
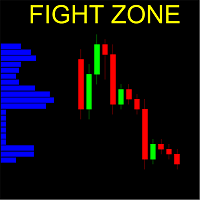
Vertical bar chart of candles!
What is it
This indicator creates a vertical bar chart of all visible candles corresponding to the amount of candles that the bars cross. The goal of this indicator is to easily check the places or regions where the candles concentrate. Those regions are a good place to place positions because they have a increased chance of staying more time there again.
It's hard to explain in words the exactly working of this indicator, we suggest you watch the video, it is o

Этот индикатор определяет краткосрочный и долгосрочный тренд. Анализ основан на выбраном таймфрейме. Индикатор показывает точки открытия сделок на продажу или покупку, а также указывает направление тренда на: Краткосрочном периоде Долгосрочном периоде Этот индикатор не только сигнализирует о немедленной покупке или продаже. Он указывает краткосрочный и долгосрочный тренд. Индикатор позволяет вам подробнее изучить реальный и исторический рыночный тренды!
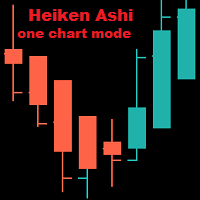
Heiken Ashi On One Chart Mode Индикатор отображается только на одном из режимов графика: Бары, Свечи, Линия. По умолчанию -- Бары. При переключении режима графика индикатор показывается или пропадает в зависимости от режима графика. Входные параметры: iChartMode: на каком режиме графика отображать индикатор: mBars (Бары) mCandles (Свечи) mLine (Линия) Цвета: LightSeaGreen: бычья свеча Tomato: медвежья свеча
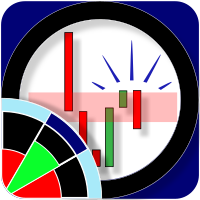
ZoneFinder is an indicator panel that presents an interactive, multi-timeframe visualisation of trend direction and strength. Trend strength and direction is measured using a modified ADX indicator based on smoothed DI+ and DI- values. High probability trading zones are identified using Fibonacci retracements. Where such zones are found, they are marked on the chart together with a proposed Fibonacci targets.
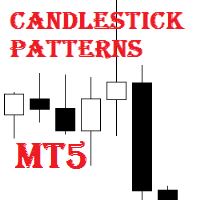
Candlestick Patterns MT5 Candlestick Patterns MT5 - простой и удобный индикатор свечных моделей, находит 29 свечных моделей.
Индикатор выгодно отличается следующим Находит и помечает на графике 29 свечных моделей; Обозначает стрелкой каноническое направление торговли; Каждая свечная модель может быть отключена в настройках; Индикатор можно использовать в качестве стрелочного индикатора в советниках.
Параметры TextSize - размер текста на графике; TextColor - цвет текста на графике; Alert -

Он Предупреждение о потрясающем осцилляторе Это практичный инструмент анализа импульса, измеряющий ускорение рынка путем сравнения краткосрочного и долгосрочного движения цен . Вместо того чтобы заставлять трейдеров постоянно следить за гистограммой, этот индикатор отслеживает ключевые сигнальные формации и отправляет в режиме реального времени всплывающие, мобильные, электронные и звуковые оповещения при появлении этих паттернов. Система фокусируется на двух проверенных стратегиях
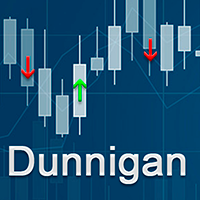
This is a trend indicator based on a strategy created by William Dunnigan that emit signals to buy or sell on any timeframe and can assist in decision making for trading on stock market or Forex. The signals are fired according to the following rules: Buy Signal = Fired at the first candlestick in which close price is higher than the higher price of the last candlestick. The higher and lower prices of the current candlestick must be higher than the corresponding ones of the last candlestick as w
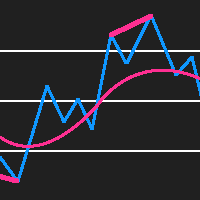
RSI Divergence Detector is an RSI indicator which also detects divergences and plots arrows and trend lines on the chart where you should buy and sell. Please note that this indicator provides 5 buffers and doesn't repaint making it an exceptional indicator for Expert Advisors. The indicator also provides alerts. Buffer 0 = RSI Buffer 1 = Buy Buffer 2 = Sell Buffer 3 = RSIGradient Buffer 4 = PriceGradient
NON REPAINTING
DIVERGENCE DETECTION

The Metatrader 5 has a hidden jewel called Chart Object, mostly unknown to the common users and hidden in a sub-menu within the platform. Called Mini Chart, this object is a miniature instance of a big/normal chart that could be added/attached to any normal chart, this way the Mini Chart will be bound to the main Chart in a very minimalist way saving a precious amount of real state on your screen. If you don't know the Mini Chart, give it a try - see the video and screenshots below. This is a gr

The VMA is an exponential moving average that adjusts its smoothing constant on the basis of market volatility. Its sensitivity grows as long as the volatility of the data increases. Based on the Chande's Momentum Oscillator, the VMA can automatically adjust its smoothing period as market conditions change, helping you to detect trend reversals and retracements much quicker and more reliable when compared to traditional moving averages.
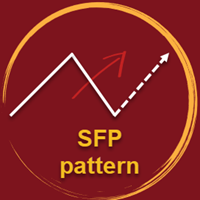
A Swing Failure Pattern ( SFP ) is a trade setup in which big traders hunt stop-losses above a key swing high or below a key swing low for the purpose of generating the liquidity needed to push price in the opposite direction. When price 1) pierces above a key swing high but then 2) closes back below that swing high, we have a potential bearish SFP . Bearish SFPs offer opportunities for short trades. When price 1) dumps below a key swing low but then 2) closes back above that swing low, we have

Every trader knows that he or she should never Risk more than 2% (or 5%) per trade. This is a Money Management law and an usable LotSize should be calculated each time because a trader must use a different StopLoss value for different Support and Resistant level. This indicator will calculate an appropriate LotSize for the moment when you will put it on the chart and each time you will drag the "Stop Loss Line" in any direction.
Inputs: Order_Type - Buy or Sell TakeProfitPoints - how many po
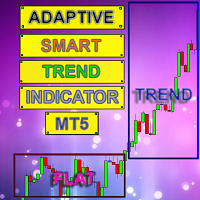
Интеллектуальный индикатор Adaptive Smart Trend Indicator определяет секторы Тренда и Флета и также в виде гистограммы показывает точки пробоя уровней (1 - 5).
Индикатор проводит множество математических вычислений для отображения на графике более оптимальных Трендовых движения.
Программа содержит два индикатора в одном: 1 - рисует секторы Тренда и Флета, 2 - индикатор гистограмма показывает наиболее хорошие сигналы для открытия ордера. Индикатор автономно вычисляет наиболее опт
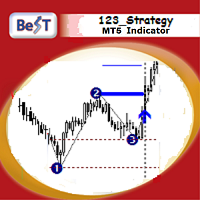
BeST_123 Strategy is clearly based on the 123 Pattern which is a frequent Reversal Chart Pattern of a very high Success Ratio .It occurs at the end of trends and swings and it’s a serious indication of high probability for a change in trend.Theoretically an 123_pattern is valid when the price closes beyond the level of #2 local top/bottom, a moment when the indicator draws an Entry Arrow, raises an Alert, and a corresponding Position can be opened.
The BeST 123_Strategy Indicator is non-repain

The Rise of Sky walker is a trend indicator is a powerful indicator for any par and any timeframe. It doesn't requires any additional indicators for the trading setup.The indicator gives clear signals about opening and closing trades.This Indicator is a unique, high quality and affordable trading tool. Can be used in combination with other indicators Perfect For New Traders And Expert Traders Low risk entries. Never repaints signal. Never backpaints signal. Never recalculates signal. Great Fo
Пересечение рыночной цены и скользящей средней со всеми видами предупреждений и возможностями улучшения визуализации на графике.
Возможности Пересечение рыночной цены и скользящей средней на текущем баре или на закрытии последнего бара; Может пропускать однотипные сигналы, идущие один за другим, и после сигнала на продажу отображать только сигнал на покупку и наоборот; Для скользящей средней можно настроить способы усреднения: простое скользящее среднее (SMA), экспоненциальное скользящее средн
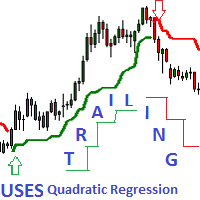
- это индикатор направленного движения, позволяющий определять тренд в момент его зарождения и задавать уровни защитного стопа. Трейлинг может осуществляться как снизу, когда уровень стопа ниже текущей цены и подтягивается за ценой, если она возрастает, так и сверху, когда уровни стопа выше текущей цены. В отличие от трейлинга с постоянной дистанцией уровень стопа устанавливается на нижней границе канала квадратичной регрессии (в случае трейлинга снизу). При трейлинге сверху стоп расположен н
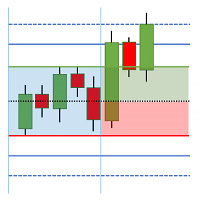
The Breakout Box for MT5 is a (opening) range breakout Indicator with freely adjustable: - time ranges - end of drawing time - take profit levels by percent of the range size - colors - font sizes It can not only display the range of the current day, but also for any number of days past. It can be used for any instrument. It displays the range size and by request the range levels and the levels of the take profit niveaus too. By request it shows a countdown with time to finish range. The indic

Мощный трендовый индикатор, снабженный всем необходимым для торговли и при этом очень прост в использовании. Могу поспорить, что вы сталкивались с индикатором или советником, содержащим множество входных параметров и сложных инструкций. Индикатор полностью оправдывает свое название: входные параметры интуитивно просты и подбирать ничего не нужно — за вас все сделает нейронная сеть.
Отличия от классической версии
Добавлена мультитаймфреймовая панель, чтобы вы могли проверять тренд на других тайм
KT Power Pennant обнаруживает и отмечает на графике известную фигуру «вымпел». Вымпел — это фигура продолжения тренда, характеризующаяся значительным движением цены в одном направлении, за которым следует период консолидации с сходящимися линиями тренда.
После формирования фигуры вымпела подаётся сигнал на покупку или продажу в зависимости от пробоя вверх или вниз после завершения модели.
Особенности
Фигуры вымпела обеспечивают вход с низким риском после фазы консолидации и последующего пробо
This app supports customer investments with equipment financing and leasing solutions as well with structured chat Our success is built on a unique combination of risk competence, technological expertise and reliable financial resources.
Following topics are covered in the Trading Support Chat -CUSTOMISATION -WORKFLOW -CHARTING TIPS -TRADE ANALYSIS
PLEASE NOTE That when the market is closed, several Brokers/Metatrader servers do not update ticks from other timeframes apart from the current on

Индикатор тренда Carina . Реализация индикатора тренда простая - в виде линий двух цветов. В оаснове алгоритма индикатора лежат стандартные индикаторы а также собственные математические расчеты. Индикатор поможет пользователям определиться с направлением тренда. Также станет незаменимым советчиком для входа в рынок или для закрытия позиции. Этот индикатор рекомендуется для всех, как для новичков так и для профессионалов.
Как трактовать информацию от индикатора. Покупаем, когда происходит смена

Индикатор горизонтальных объемов ( Horizontal Volumes ) - отражает с помощью гистограммы, объем заключенных сделок по определенной цене без привязки за временем. При этом гистограмма появляется непосредственно в окне терминала, а каждый столбик объема легко сопоставить со значением котировки валютной пары. Индикатор практически не требует изменения настроек, а при желании с ними может разобраться любой трейдер.
Объемы заключенных сделок имеют большое значение в биржевой торговле, обычно увелич

mql4 version: https://www.mql5.com/en/market/product/44606 Simple indicator to calculate profit on fibonacci retracement levels with fixed lot size, or calculate lot size on fibonacci levels with fixed profit. Add to chart and move trend line to set the fibonacci retracement levels. Works similar as default fibonacci retracement line study in Metatrader. Inputs Fixed - select what value will be fix, lot or profit Fixed value - value that will be fix on all levels Levels - levels for which
This indicator measures the largest distance between a price (high or low) and a moving average. It also shows the average distance above and below the moving average. It may come in handy for strategies that open reverse positions as price moves away from a moving average within a certain range, awaiting it to return so the position can be closed. It just works on any symbol and timeframe. Parameters: Moving average period : Period for moving average calculation. Moving average method : You can
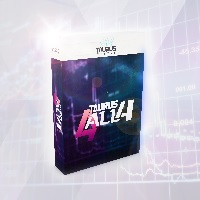
Indicador Taurus All4 Taurus All4
O Taurus All4 é um indicador de alto desempenho, que indica a força da tendência e você pode observar a força da vela. Nosso indicador tem mais de 4 confirmações de tendência.
É muito simples e fácil de usar.
Modos de confirmação Confirmações de tendências de velas: Quando a vela muda para verde claro, a tendência é alta. Quando a vela muda para vermelho, a tendência está voltando para baixo. Quando a vela muda para vermelho escuro, a tendência é baixa. Co
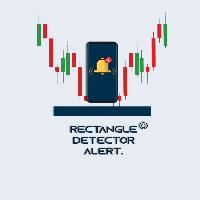
Rectangle Detector Alert
About Rectangle Detector Alert Indicator
Rectangle detector alert detects manually drawn rectangle shapes on charts and sends out push notifications
also auto extending the rectangles at the same time as new candles form.
The concept behind this indicator is based on the manual trading of supply and demand zones. Most traders prefer
to draw their supply (resistance) and demand (support) zones manually instead of depending on indicators to auto draw
the zones.

The main idea of this product is to generate statistics based on signals from 5 different strategies for the Binary Options traders, showing how the results would be and the final balance based on broker's payout.
Strategy 1: The calculation is secret. Strategy 2: The signal is based on a sequence of same side candles (same color). Strategy 3: The signal is based on a sequence of interspersed candles (opposite colors). Strategy 4: The signal consists of the indicators bollinger (we have 3 type
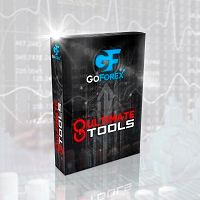
This product is a set of tools that help the trader to make decisions, bringing information from different categories that complement each other: trend, support / resistance and candle patterns. It also has a panel with information about the balance. The trend has two different calculations and is shown as colored candles. Strategy 1 is longer, having 3 different states: up, down and neutral trend. Strategy 2 has a faster response and has only 2 states: up and down trend. Support and resistance
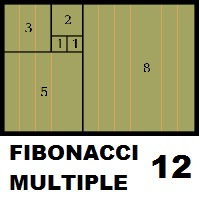
Fibonacci Múltiple 12, utiliza la serie fibonacci plasmado en el indicador fibonacci, aumentadolo 12 veces según su secuencia. El indicador fibonacci normalmente muestra una vez, el presente indicador se mostrara 12 veces empezando el numero que le indique siguiendo la secuencia. Se puede utilizar para ver la tendencia en periodos cortos y largos, de minutos a meses, solo aumentado el numero MULTIPLICA.
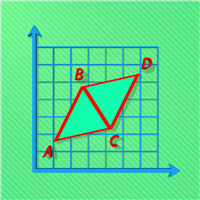
Индикатор для торговли по сигналам гармонического паттерна AB=CD. Даёт сигналы и показывает уровни входа в рынок, а так же, уровни для выставления стоп приказов, что позволяет трейдеру своевременно принимать решения по входу в рынок, а также эффективно управлять позициями и ордерами. Поддерживается отправка push-уведомлений на мобильное устройство, и-мейл, а так же алерты. Данный индикатор был портирован с версии для MetaTrader 4. Больше информации, а также подробное описание и видео с демонстра

O Touch VWAP é um indicador que permite calcular uma Média Ponderada por Volume (VWAP) apenas apertando a tecla 'w' no seu teclado e após clicando no candle do qual deseja realizar o calculo, clicando abaixo do candle é calculada a VWAP baseado na minima dos preços com o volume, clicando sobre o corpo do candle é calculado uma VWAP sobre o preço medio com o volume e clicando acima do candle é calculado uma VWAP baseado na máxima dos preços com o volume, voce tambem tem a opção de remover a VWAP

1. Why did I develop this series of indicators
I found that most traders need to use multiple time frame indicators. They usually switch time frame to see indicators. However, once the timeframe is switched, you cannot see the corresponding relationship between the price in the smaller timeframe and the indicator in the larger timeframe . For example: if your price chart is in H1 timeframe, you can see H4, D1 and W1 indicators in H1 timeframe Chart. This is more helpful for you to find th

1. Why did I develop this series of indicators
I found that most traders need to use multiple time frame indicators. They usually switch time frame to see indicators. However, once the timeframe is switched, you cannot see the corresponding relationship between the price in the smaller timeframe and the indicator in the larger timeframe . For example: if your price chart is in H1 timeframe, you can see H4, D1 and W1 indicators in H1 timeframe Chart. This is more helpful for you to find th

1. Why did I develop this series of indicators
I found that most traders need to use multiple time frame indicators. They usually switch time frame to see indicators. However, once the timeframe is switched, you cannot see the corresponding relationship between the price in the smaller timeframe and the indicator in the larger timeframe . For example: if your price chart is in H1 timeframe, you can see H4, D1 and W1 indicators in H1 timeframe Chart. This is more helpful for you to find th

1. Why did I develop this series of indicators
I found that most traders need to use multiple time frame indicators. They usually switch time frame to see indicators. However, once the timeframe is switched, you cannot see the corresponding relationship between the price in the smaller timeframe and the indicator in the larger timeframe . For example: if your price chart is in H1 timeframe, you can see H4, D1 and W1 indicators in H1 timeframe Chart. This is more helpful for you to find th

1. Why did I develop this series of indicators
I found that most traders need to use multiple time frame indicators. They usually switch time frame to see indicators. However, once the timeframe is switched, you cannot see the corresponding relationship between the price in the smaller timeframe and the indicator in the larger timeframe . For example: if your price chart is in H1 timeframe, you can see H4, D1 and W1 indicators in H1 timeframe Chart. This is more helpful for you to find th

1. Why did I develop this series of indicators
I found that most traders need to use multiple time frame indicators. They usually switch time frame to see indicators. However, once the timeframe is switched, you cannot see the corresponding relationship between the price in the smaller timeframe and the indicator in the larger timeframe . For example: if your price chart is in H1 timeframe, you can see H4, D1 and W1 indicators in H1 timeframe Chart. This is more helpful for you to find th

1. Why did I develop this series of indicators
I found that most traders need to use multiple time frame indicators. They usually switch time frame to see indicators. However, once the timeframe is switched, you cannot see the corresponding relationship between the price in the smaller timeframe and the indicator in the larger timeframe . For example: if your price chart is in H1 timeframe, you can see H4, D1 and W1 indicators in H1 timeframe Chart. This is more helpful for you to find th

1. Why did I develop this series of indicators
I found that most traders need to use multiple time frame indicators. They usually switch time frame to see indicators. However, once the timeframe is switched, you cannot see the corresponding relationship between the price in the smaller timeframe and the indicator in the larger timeframe . For example: if your price chart is in H1 timeframe, you can see H4, D1 and W1 indicators in H1 timeframe Chart. This is more helpful for you to find th

1. Why did I develop this series of indicators
I found that most traders need to use multiple time frame indicators. They usually switch time frame to see indicators. However, once the timeframe is switched, you cannot see the corresponding relationship between the price in the smaller timeframe and the indicator in the larger timeframe . For example: if your price chart is in H1 timeframe, you can see H4, D1 and W1 indicators in H1 timeframe Chart. This is more helpful for you to find th

1. Why did I develop this series of indicators
I found that most traders need to use multiple time frame indicators. They usually switch time frame to see indicators. However, once the timeframe is switched, you cannot see the corresponding relationship between the price in the smaller timeframe and the indicator in the larger timeframe . For example: if your price chart is in H1 timeframe, you can see H4, D1 and W1 indicators in H1 timeframe Chart. This is more helpful for you to find th

1. Why did I develop this series of indicators
I found that most traders need to use multiple time frame indicators. They usually switch time frame to see indicators. However, once the timeframe is switched, you cannot see the corresponding relationship between the price in the smaller timeframe and the indicator in the larger timeframe . For example: if your price chart is in H1 timeframe, you can see H4, D1 and W1 indicators in H1 timeframe Chart. This is more helpful for you to find th

1. Why did I develop this series of indicators
I found that most traders need to use multiple time frame indicators. They usually switch time frame to see indicators. However, once the timeframe is switched, you cannot see the corresponding relationship between the price in the smaller timeframe and the indicator in the larger timeframe . For example: if your price chart is in H1 timeframe, you can see H4, D1 and W1 indicators in H1 timeframe Chart. This is more helpful for you to find th

1. Why did I develop this series of indicators
I found that most traders need to use multiple time frame indicators. They usually switch time frame to see indicators. However, once the timeframe is switched, you cannot see the corresponding relationship between the price in the smaller timeframe and the indicator in the larger timeframe . For example: if your price chart is in H1 timeframe, you can see H4, D1 and W1 indicators in H1 timeframe Chart. This is more helpful for you to find th

1. Why did I develop this series of indicators
I found that most traders need to use multiple time frame indicators. They usually switch time frame to see indicators. However, once the timeframe is switched, you cannot see the corresponding relationship between the price in the smaller timeframe and the indicator in the larger timeframe . For example: if your price chart is in H1 timeframe, you can see H4, D1 and W1 indicators in H1 timeframe Chart. This is more helpful for you to find th

1. Why did I develop this series of indicators
I found that most traders need to use multiple time frame indicators. They usually switch time frame to see indicators. However, once the timeframe is switched, you cannot see the corresponding relationship between the price in the smaller timeframe and the indicator in the larger timeframe . For example: if your price chart is in H1 timeframe, you can see H4, D1 and W1 indicators in H1 timeframe Chart. This is more helpful for you to find th

1. Why did I develop this series of indicators
I found that most traders need to use multiple time frame indicators. They usually switch time frame to see indicators. However, once the timeframe is switched, you cannot see the corresponding relationship between the price in the smaller timeframe and the indicator in the larger timeframe . For example: if your price chart is in H1 timeframe, you can see H4, D1 and W1 indicators in H1 timeframe Chart. This is more helpful for you to find th

1. Why did I develop this series of indicators
I found that most traders need to use multiple time frame indicators. They usually switch time frame to see indicators. However, once the timeframe is switched, you cannot see the corresponding relationship between the price in the smaller timeframe and the indicator in the larger timeframe . For example: if your price chart is in H1 timeframe, you can see H4, D1 and W1 indicators in H1 timeframe Chart. This is more helpful for you to find th

1. Why did I develop this series of indicators
I found that most traders need to use multiple time frame indicators. They usually switch time frame to see indicators. However, once the timeframe is switched, you cannot see the corresponding relationship between the price in the smaller timeframe and the indicator in the larger timeframe . For example: if your price chart is in H1 timeframe, you can see H4, D1 and W1 indicators in H1 timeframe Chart. This is more helpful for you to find th

1. Why did I develop this series of indicators
I found that most traders need to use multiple time frame indicators. They usually switch time frame to see indicators. However, once the timeframe is switched, you cannot see the corresponding relationship between the price in the smaller timeframe and the indicator in the larger timeframe . For example: if your price chart is in H1 timeframe, you can see H4, D1 and W1 indicators in H1 timeframe Chart. This is more helpful for you to find th

1. Why did I develop this series of indicators
I found that most traders need to use multiple time frame indicators. They usually switch time frame to see indicators. However, once the timeframe is switched, you cannot see the corresponding relationship between the price in the smaller timeframe and the indicator in the larger timeframe . For example: if your price chart is in H1 timeframe, you can see H4, D1 and W1 indicators in H1 timeframe Chart. This is more helpful for you to find th
1. Why did I develop this series of indicators
I found that most traders need to use multiple time frame indicators. They usually switch time frame to see indicators. However, once the timeframe is switched, you cannot see the corresponding relationship between the price in the smaller timeframe and the indicator in the larger timeframe . For example: if your price chart is in H1 timeframe, you can see H4, D1 and W1 indicators in H1 timeframe Chart. This is more helpful for you to find th
1. Why did I develop this series of indicators
I found that most traders need to use multiple time frame indicators. They usually switch time frame to see indicators. However, once the timeframe is switched, you cannot see the corresponding relationship between the price in the smaller timeframe and the indicator in the larger timeframe . For example: if your price chart is in H1 timeframe, you can see H4, D1 and W1 indicators in H1 timeframe Chart. This is more helpful for you to find th
1. Why did I develop this series of indicators
I found that most traders need to use multiple time frame indicators. They usually switch time frame to see indicators. However, once the timeframe is switched, you cannot see the corresponding relationship between the price in the smaller timeframe and the indicator in the larger timeframe . For example: if your price chart is in H1 timeframe, you can see H4, D1 and W1 indicators in H1 timeframe Chart. This is more helpful for you to find th
1. Why did I develop this series of indicators
I found that most traders need to use multiple time frame indicators. They usually switch time frame to see indicators. However, once the timeframe is switched, you cannot see the corresponding relationship between the price in the smaller timeframe and the indicator in the larger timeframe . For example: if your price chart is in H1 timeframe, you can see H4, D1 and W1 indicators in H1 timeframe Chart. This is more helpful for you to find th
1. Why did I develop this series of indicators
I found that most traders need to use multiple time frame indicators. They usually switch time frame to see indicators. However, once the timeframe is switched, you cannot see the corresponding relationship between the price in the smaller timeframe and the indicator in the larger timeframe . For example: if your price chart is in H1 timeframe, you can see H4, D1 and W1 indicators in H1 timeframe Chart. This is more helpful for you to find th
1. Why did I develop this series of indicators
I found that most traders need to use multiple time frame indicators. They usually switch time frame to see indicators. However, once the timeframe is switched, you cannot see the corresponding relationship between the price in the smaller timeframe and the indicator in the larger timeframe . For example: if your price chart is in H1 timeframe, you can see H4, D1 and W1 indicators in H1 timeframe Chart. This is more helpful for you to find th
1. Why did I develop this series of indicators
I found that most traders need to use multiple time frame indicators. They usually switch time frame to see indicators. However, once the timeframe is switched, you cannot see the corresponding relationship between the price in the smaller timeframe and the indicator in the larger timeframe . For example: if your price chart is in H1 timeframe, you can see H4, D1 and W1 indicators in H1 timeframe Chart. This is more helpful for you to find th
1. Why did I develop this series of indicators
I found that most traders need to use multiple time frame indicators. They usually switch time frame to see indicators. However, once the timeframe is switched, you cannot see the corresponding relationship between the price in the smaller timeframe and the indicator in the larger timeframe . For example: if your price chart is in H1 timeframe, you can see H4, D1 and W1 indicators in H1 timeframe Chart. This is more helpful for you to find th
1. Why did I develop this series of indicators
I found that most traders need to use multiple time frame indicators. They usually switch time frame to see indicators. However, once the timeframe is switched, you cannot see the corresponding relationship between the price in the smaller timeframe and the indicator in the larger timeframe . For example: if your price chart is in H1 timeframe, you can see H4, D1 and W1 indicators in H1 timeframe Chart. This is more helpful for you to find th

1. Why did I develop this series of indicators
I found that most traders need to use multiple time frame indicators. They usually switch time frame to see indicators. However, once the timeframe is switched, you cannot see the corresponding relationship between the price in the smaller timeframe and the indicator in the larger timeframe . For example: if your price chart is in H1 timeframe, you can see H4, D1 and W1 indicators in H1 timeframe Chart. This is more helpful for you to find th
1. Why did I develop this series of indicators
I found that most traders need to use multiple time frame indicators. They usually switch time frame to see indicators. However, once the timeframe is switched, you cannot see the corresponding relationship between the price in the smaller timeframe and the indicator in the larger timeframe . For example: if your price chart is in H1 timeframe, you can see H4, D1 and W1 indicators in H1 timeframe Chart. This is more helpful for you to find th

1. Why did I develop this series of indicators
I found that most traders need to use multiple time frame indicators. They usually switch time frame to see indicators. However, once the timeframe is switched, you cannot see the corresponding relationship between the price in the smaller timeframe and the indicator in the larger timeframe . For example: if your price chart is in H1 timeframe, you can see H4, D1 and W1 indicators in H1 timeframe Chart. This is more helpful for you to find th
MetaTrader Маркет позволяет максимально безопасно покупать программы для платформы MetaTrader. Вы можете скачать демо-версии понравившихся роботов и индикаторов прямо из терминала и проверить их в тестере стратегий.
Протестируйте программы в различных режимах перед покупкой для получения максимального представления о продукте и оплатите понравившийся продукт через платежную систему MQL5.community.
Платежная система MQL5.community обеспечивает оплату продавцам, а возможность тестирования программ в различных режимах позволяет покупателям получить максимальное представление о продукте.

Вы упускаете торговые возможности:
- Бесплатные приложения для трейдинга
- 8 000+ сигналов для копирования
- Экономические новости для анализа финансовых рынков
Регистрация
Вход
Вы принимаете политику сайта и условия использования
Если у вас нет учетной записи, зарегистрируйтесь