Смотри обучающее видео по маркету на YouTube
Как купить торгового робота или индикатор
Запусти робота на
виртуальном хостинге
виртуальном хостинге
Протестируй индикатор/робота перед покупкой
Хочешь зарабатывать в Маркете?
Как подать продукт, чтобы его покупали
Технические индикаторы для MetaTrader 5 - 22
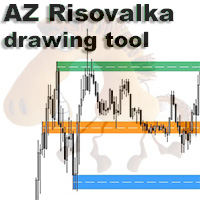
AZ Risovalka levels drawing tool An indicator for simplifying the drawing of levels. Select the indicator mode for the body, shadow, or the whole candle in the settings. Click the 'Draw' button on the drawing panel to create a level, then click on the body or shadow of the candle and select the level color in the color menu that appears. The 'Delete' button to delete level you select, 'Color' to select the color of an already created level. You can set your own colors in the indicator menu (6 co
FREE

Ritz Smart FIBOPIVOT Optimus Pro Advanced Multi-Timeframe Fibonacci Trading System SMART PREDICTION & ACCURATE FORECAST Revolutionary Fibonacci Pivot Technology combines traditional pivot points with advanced Fibonacci extensions, creating a powerful predictive tool for professional traders.
Our algorithm intelligently detects significant price levels across multiple timeframes, delivering laser-accurate support and resistance zones before the market moves . INTELLIGENT VOLUME-VALIDATED SIGNALS
FREE

El indicador técnico Trend Magic es una herramienta de análisis de tendencias que combina el Índice de Canal de Mercancía (CCI) y el Rango Verdadero Medio (ATR) para identificar la dirección de la tendencia del mercado. Aquí tienes un resumen de sus pros y contras, así como las mejores condiciones del mercado para su uso:
Pros: - Identificación clara de la tendencia: Cambia de color para indicar tendencias alcistas (azul) y bajistas (rojo), lo que facilita la visualización de la dirección del
FREE

Этот индикатор основан на стратегии, предложенной каналом YouTube "The Secret Mindset" в видео "Надежная стратегия скальпинга, которую я обнаружил после 1 месяца торговли ценовым действием". В видео представлено полное и подробное описание стратегии и условий фильтрации сигналов. * Создатель канала YouTube не имеет отношения к разработке этого индикатора Сигналы должны сочетаться с другими индикаторами и фильтроваться по мнению каждого трейдера
Индикатор
Бары, которые находятся внутри диапазон
FREE
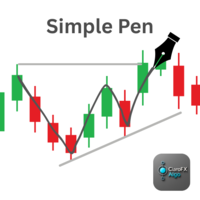
ClaroFxAlgo - Simple Pen v1.00 Free-Hand Drawing Tool for MetaTrader 5 Overview:
ClaroFxAlgo - Simple Pen is a lightweight and intuitive tool that allows traders to draw directly on the MT5 chart using just mouse movements. Designed to enhance visual analysis, this tool makes it easy to sketch trends, highlight zones, or mark chart behavior on-the-fly. Key Features: Draw on chart by simply holding Ctrl and moving the mouse — no clicks required Customizable drawing settings:
• Drawing col
FREE

YOU CAN NOW DOWNLOAD FREE VERSIONS OF OUR PAID INDICATORS . IT'S OUR WAY OF GIVING BACK TO THE COMMUNITY ! >>> GO HERE TO DOWNLOAD
The Volatility Ratio was developed by Jack D. Schwager to identify trading range and signal potential breakouts. The volatility ratio is defined as the current day's true range divided by the true range over a certain number of days N (i.e. N periods). The following formula is used to calculate the volatility ratio: Volatility Ratio (VR) = Today's True Range
FREE

Candle color RSI (Relative Strength Index) indicators change candlestick colors on the price chart to visually show RSI conditions like overbought/oversold levels or bullish/bearish momentum, using colors like red for overbought/bearish and green for oversold/bullish, helping traders spot reversals or strength at a glance without looking at the separate RSI pane. These custom indicators often color candles red above 70 (overbought), green below 30 (oversold), and keep default colors in between
FREE
1. Introduction The CM_Ultimate_RSI_MTF is a powerful and versatile custom indicator for MetaTrader 5, designed to enhance your Relative Strength Index (RSI) analysis. It provides multi-timeframe (MTF) capabilities, visual signals, and customizable alerts, making it an invaluable tool for traders seeking to identify overbought/oversold conditions, trend strength, and potential entry/exit points across various timeframes. 2. Key Features Multi-Timeframe (MTF) Analysis: Allows you to view RSI from
FREE

Automatic Trend Line Fit. This indicator automatically plots the straight line and parabolic (curved) trend to any symbol at any timeframe. The plotted straight line is a good indication of the current trend and the curved line is an indication of a change momentum or change in the current trend. Plotting the straight line over about 2/3 the number of candles as the curved line is usually a good way to determine entry and exit points as it shows the current trend and momentum of the market. This
FREE

ATR Plus is an enhanced version of the classic ATR that shows not just volatility itself, but the directional energy of the market .
The indicator converts ATR into a normalized oscillator (0–100), allowing you to clearly see: who dominates the market — buyers or sellers when a trend begins when a trend loses strength when the market shifts into a range where volatility reaches exhaustion zones ATR Plus is perfect for momentum, trend-following, breakout and volatility-based systems. How ATR Plus
FREE

Advanced Indicator Scanner is a multi-symbol multi-timeframe scanner that works with hundreds of custom indicators available across the web including mql5 website market and codebase indicators.
Advanced Indicator Scanner features:
Scans your indicator in 28 customizable instruments and 9 timeframes. Monitors up to 2 lines(buffers) of an indicator. Showing of indicator value on buttons. You can choose between 3 alert modes: Single symbol and timeframe Multiple timeframes of a symbol Multiple

Indicator Overview Latest Updates: Update 02-23-2025: This version includes further optimizations for improved signal accuracy. Update 01-13-2025: Now compatible with the upcoming Web Request App, which will replace the AutoSignal_Connection bot. Purpose
This MT5 indicator is designed for analyzing 3-minute Heiken Ashi candles, generating buy and sell signals based on moving average (MA) crossovers. It provides visual signals and alerts, making it a valuable tool for traders. Heiken Ashi Candl

FusionAlert StochRSI Master is an indicator available for MT4/MT5 platforms, it is a combination of RSI & Stochastic indicator which provide "alerts" when the market is inside "overbought and oversold" regions combined for both indicators, results in more precise and accurate signals to be used as a wonderful tool, in the form of "buy or sell" signals. This indicator comes with many customization options mentioned in the parameter section below, user can customise these parameters as needful. Jo
FREE
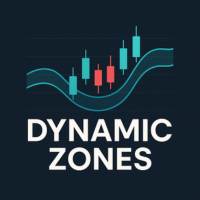
Dynamic Supply and Demand indicator automatically identifies and displays Supply and Demand Zones on your chart based on price action patterns and market structure. These zones represent areas where institutional buying or selling pressure has historically occurred, making them key levels for potential price reactions. This form of indicator takes inspiration from ICT as well as traditional Support & Resistance formation. **For the first 50 candles (number depends on LookBackCandles) when indic
FREE

The Stochastic Momentum Index (SMI), developed by William Blau and featured in the January 1993 edition of Technical Analysis of Stocks & Commodities magazine, introduces a unique perspective to trading analysis. Distinguished from the conventional Stochastic Oscillator, which evaluates the current close in relation to the recent x-period high/low range, the SMI assesses the close's position relative to the midpoint of this range. This innovation yields an oscillator with a range of +/- 100, re
FREE

My other indicators
https://www.mql5.com/en/market/product/156702 https://www.mql5.com/en/market/product/153968 (FREE) https://www.mql5.com/en/market/product/153960 (FREE)
️ Multi-Timeframe Supply & Demand Zones with Fair Value Gaps (FVG) MyFXRoom Supply & Demand Zones with FVG is a multi-timeframe indicator that automatically detects and draws Supply and Demand zones directly on your chart — complete with Fair Value Gap (FVG) validation, gap-aware zone sizing , and smart clean-up logic to
FREE

Индикатор Trading Exporter for AI Assistant для MetaTrader 5 создан для экспорта полных и структурированных торговых данных в формате JSON. Он позволяет любому бесплатному или платному ИИ-помощнику, такому как ChatGPT, Gemini, Copilot, Claude или DeepSeek, анализировать информацию и предоставлять персональные рекомендации, стратегии и объяснения. Особая рекомендация: DeepSeek Хотя этот экспортер работает с любым ИИ, особо рекомендуется использовать DeepSeek по нескольким причинам: Расширенный ко
FREE
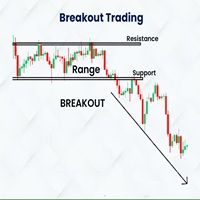
Indicador Basado en la estrategia de ruptura del rango de londres de Amaury Benedetti.
Este indicador dibuja automaticamente el rango, el maximo y minimo y sus correspondientes lineas de stoploss, entrada y takeprofit.
SE RECOMIENDA USAR EN M1 EN EL US30 (DE ACUERDO A LA ESTRATEGIA)
Los valores se pueden modificar de acuerdo a la necesidad del usuario, tambien se tienen mas configuraciones para dibujar cualquier rango en diversos horarios y con diferentes configuraciones de sl, tp, etc
Detal
FREE
The Vix_Fix indicator, or "Vix Fix," is a tool designed to identify potential market bottoms. It operates on the principle of measuring extreme fear or pessimism among the crowd, which are moments when the market often has a high probability of reversing to the upside. Main Purpose: To help traders find high-probability BUY (Long) entry points by identifying when the market is "oversold." How it Works In simple terms, the Vix Fix measures the distance between the current bar's Low and the Highes
FREE

Combining the best of Price Action , Directional Movement , and Divergence/Convergence analysis, Candle Color Trend is a easy and reliable way to identify trend direction. The indicator automatically paints the candles according to the assumption that an uptrend is defined by prices that form a series of higher highs and higher lows. In contrast, a downtrend is defined by prices that form a series of lower highs and lower lows. Additionally, ADX Wilder indicator is used to measure trend weakness
FREE

Like most things that work in trading, it's really simple. However, it's one of the most powerful tools I have that makes entries of many systems much more precise.
In its essence, it measures the recent volatility against the medium-term average. How does it work? Markets tend to be prone to strong trending movements when relative volatility is low and tend to be mean-reverting when relative volatility is high.
It can be used with both mean-reversion systems (like the Golden Pickaxe) and mo
FREE

RITZ Candle Kaufman’s AMA is a precision market-flow indicator built around Kaufman’s Adaptive Moving Average (KAMA / AMA) — a dynamic smoothing algorithm that automatically adjusts to changing volatility.
This enhanced version interprets AMA momentum directly into smart candle-color signals , giving traders a clean, noise-filtered view of trend strength and directional bias. Where most indicators repaint or react too slowly, RITZ Candle AMA delivers stable, non-repainting color shifts based on
FREE

MAD Bands (Moving Average Deviation Bands) MAD Bands — это индикатор полос, основанный на волатильности,
разработанный с целью расширения концепции полос Боллинджера. Классические полосы Боллинджера используют простую скользящую среднюю (SMA)
в качестве базовой линии.
В отличие от них, данный индикатор позволяет рассчитывать полосы стандартного отклонения
на основе различных типов скользящих средних,
таких как EMA, WMA, SMMA, ZLMA и другие. Отказ от привязки измерения волатильности исключительн
FREE

Previous Candle Levels MT5 shows the previous candle levels, it shows the previous candle Open High Low Close levels (OHLC Levels) in different time frame. It's designed to help the trader to analyse the market and pay attention to the previous candle levels in different time frame. We all know that the OHLC Levels in Monthly, Weekly and Daily are really strong and must of the time, the price strongly reacts at those levels. In the technical analysis, the user can use them as a support and res
FREE
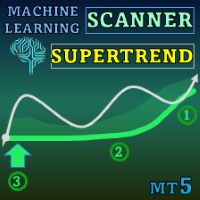
Special offer : ALL TOOLS , just $35 each! New tools will be $30 for the first week or the first 3 purchases ! Trading Tools Channel on MQL5 : Join my MQL5 channel to update the latest news from me Откройте возможности передового машинного обучения с Machine Learning Adaptive SuperTrend , инновационным индикатором, разработанным для плавной адаптации к изменяющимся рыночным условиям. Благодаря интеграции кластеризации методом k-средних с методологией SuperTrend, этот индикатор позв

Представляем мощный индикатор NRTR (Nick Rypock Trailing Reverse) - обязательный технический инструмент для трейдеров, стремящихся определить развороты тренда и установить эффективные уровни трейлинг-стопов. Разработанный Ником Райпоком, этот индикатор имеет уникальный алгоритм, который адаптируется к постоянно меняющимся рыночным условиям, что делает его ценным дополнением к арсеналу любого трейдера.
Вот два популярных способа использования этого индикатора трейдерами:
1. Развороты тренда: И
FREE

Импульсная система (Impulse System) была впервые описана в книге "Трейдинг с доктором Элдером. Энциклопедия биржевой игры" . Для определения импульса используются гистограмма MACD (MACD Histogram) и экспоненциальная скользящая средняя (EMA). Главным правилом является не торговать против направления импульса.
Сигналы отображаются цветом индикатора: Когда EMA и MACD-Histogram возрастают, цвет импульсной системы зеленый (продажи запрещены). Когда EMA и MACD-Histogram падают, цвет импульсной системы
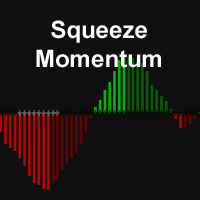
The Squeeze Momentum Indicator, identifies periods of low volatility ("squeeze") when Bollinger Bands are inside the Keltner Channel, marked by black crosses on the midline. This suggests the market is preparing for a significant move.
Gray crosses indicate a "squeeze release," signaling potential breakout. To use it, wait for the first gray cross after a black cross, then enter a trade in the direction of momentum (long if above zero, short if below). Exit when momentum shifts (color change i
FREE

Wyckoff fans, enjoy!
Ideally to be used with the Weis Waves indicator, but it can be easily used alone, the Waves Sizer puts the range (in resulting Price movement) done by the Price on its market swings. You can control how accurate or loose will be the swings. This tool is very helpful for visually know how much the Price has traveled in your Timeframe. This way you can confront this level of effort with the resulting Volume, etc... Weis Waves indicator:
https://www.mql5.com/en/market/produc
FREE

Вы когда-нибудь задумывались о наличии сканера, который анализирует все стратегии и показывает точки покупки и продажи для всех таймфреймов этого актива одновременно? Вот что именно делает этот сканер. Он предназначен для отображения сигналов покупки и продажи, которые вы создали в Rule Plotter: создатель стратегий без программирования , и их запуска внутри этого сканера на различных активах и различных таймфреймах. Стратегия Rule Plotter по умолчанию представляет собой только восходящие и нисхо
FREE

Description :
The "Market Structure HH HL LH LL" indicator is a powerful and at the same time simple tool for analyzing price dynamics in financial markets. This indicator helps traders and investors identify changes in trends and identify important points in price time series. Displays "BOS" and "CHoCH" lines.
Key components of the indicator:
HH (Higher High): The top at which the price closes above the previous high top. HH indicates a strengthening uptrend. HL (Higher Low): The minimum

Highly configurable Trader Dynamic Index (TDI) indicator.
Features: Highly customizable alert functions (at levels, crosses, direction changes via email, push, sound, popup) Multi timeframe ability (higher and lower timeframes also) Color customization (at levels, crosses, direction changes) Linear interpolation and histogram mode options Works on strategy tester in multi timeframe mode (at weekend without ticks also) Adjustable Levels Parameters:
TDI Timeframe: You can set the lower/higher ti
FREE
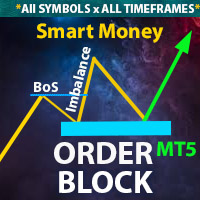
** All Symbols x All Time frames scan just by pressing scanner button ** Discount : Only 4 of 5 copy is 35$.
*** Contact me to send you instruction and add you in "Order Block group" for sharing or seeing experiences with other users. Introduction: The central banks and financial institutions mainly drive the market, Order block is considered a market behavior that indicates accumulation of orders from banks and institutions, then the market tends to make a sharp move(Imbala

ADR, AWR & AMR Indicator: Comprehensive Trading Guide Try "Average Daily Range Scalper":
https://www.mql5.com/en/market/product/154469 Core Concepts ADR (Average Daily Range) Definition : The average distance between daily high and low prices over a specified lookback period (typically 14-20 days) Purpose : Measures daily volatility expectations, identifies range-bound versus trending days, sets realistic intraday profit targets Key Insight : Markets tend to respect their average volatility - d
FREE

This indicators automatically draws the support and resistances levels (key levels) for you once you've dropped it on a chart. It reduces the hustle of drawing and redrawing these levels every time you analyse prices on a chart. With it, all you have to do is drop it on a chart, adjust the settings to your liking and let the indicator do the rest.
But wait, it gets better; the indicator is absolutely free! For more information: https://youtu.be/rTxbPOBu3nY For more free stuff visit: https:
FREE

RITZ – 8 Main Market Zones & Smart Candle Timer is an advanced market-timing and session-analysis indicator designed to enhance intraday trading precision. The indicator features an adaptive candle countdown timer with dynamic time format, color warnings, blinking effects, size scaling, and multi-level sound alerts to help traders anticipate candle close and critical market moments accurately. It includes a global market session panel covering 8 major trading zones worldwide , displaying real-t
FREE
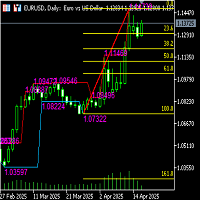
Functional description of automatic Fibonacci line indicator (including high and low channel lines) Indicator name Automatic Fibonacci retracement line + high and low channel auxiliary
Functional introduction This indicator combines the automatically identified high and low points of the band, automatically draws the Fibonacci retracement/extension line, and draws the highest and lowest price channel lines of the current analysis interval to provide traders with clearer support/resistance refe
FREE
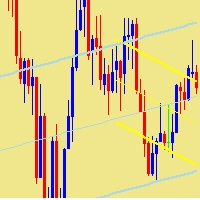
This indicator plots two linear regression channels on the chart for any currency pair or financial instrument, supporting the use of two different timeframes. The first channel uses a shorter period to identify local trends. The second channel uses a longer period to identify overall trends. Each channel displays a main regression line and two lines representing the deviation range. Users can adjust the period of each channel and select the desired timeframe. The indicator helps monitor price m
FREE

СПЕЦИАЛЬНОЕ ПРЕДЛОЖЕНИЕ НА ЗАПУСК – Бесплатно до 05.01.2026 или для первых 100 загрузок (что наступит раньше) Если вы видите эту страницу, значит вы всё ещё находитесь в рамках эксклюзивного периода запуска. После достижения лимита индикатор будет продаваться на Market MQL5 на стандартных условиях. Mikko Breakout Indicator – Интеллектуальное определение пробоев для MetaTrader 5 Профессиональный индикатор пробоев для MetaTrader 5, предназначенный для Forex, индексов и криптовалют. SqueezeMAX Pro
FREE
This indicator is a sophisticated MetaTrader 5 tool that calculates and displays Average Daily Range (ADR) levels on your chart. It draws horizontal lines representing expected price movement ranges based on historical daily volatility, helping traders identify potential daily high and low targets. ADR (Average Daily Range) = The average difference between the daily high and low over a specified period (default: 14 days). Unlike ATR which includes gaps between days, ADR focuses purely on int
FREE
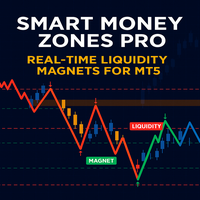
Индикатор SM Zones Pro, разработанный в соответствии с принципами стратегий умного управления капиталом, является очень удобным инструментом для трейдеров на платформе MetaTrader 5 (MT5). Он графически отображает на графике все значимые зоны, используемые в стратегии SM: рыночная структура, ценовые уровни повышенной ликвидности, зоны «магнита цены» — дисбалансы, блоки ордеров, FVG, брейкер блоки и митигейшн блоки. В сторону этих зон, как правило, движется цена инструмента. Зоны, влияющие на бы
Market Structure Shift with FVG Indicator for MT5 This MT5 indicator from the apexfintech.net suite identifies market structure shifts and fair value gaps (FVGs) to provide traders with potential trading opportunities. It alerts users on these events via mobile notifications, enabling them to react quickly to changing market conditions. Key Features: Market Structure Shift Detection: Identifies bullish and bearish market structure shifts based on swing high/low breaks and significant candl
FREE
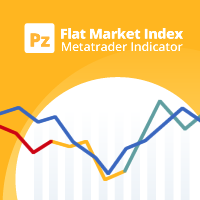
Этот индикатор вычисляет, насколько символ переместился в относительном выражении, чтобы найти трендовые или плоские рынки. Он показывает, какой процент последнего ценового диапазона является направленным. [ Руководство по установке | Руководство по обновлению | Устранение неполадок | FAQ | Все продукты ] Нулевое значение означает, что рынок абсолютно плоский Значение 100 означает, что рынок полностью в тренде Синяя линия означает, что ценовой диапазон здоров Красная линия означает, что диапазо
FREE
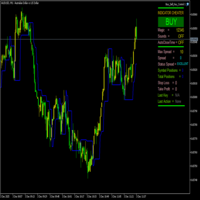
FractalBreakoutLevels — индикатор динамических уровней, построенных на основе анализа ценовых движений. Индикатор использует комбинацию исторических ценовых данных для определения ключевых уровней, которые могут служить ориентирами при торговле. Общее описание работы: Индикатор анализирует структуру рынка, выявляя значимые ценовые уровни на основе соотношения текущих и исторических ценовых данных. Он строит непрерывную линию, которая адаптируется к изменяющимся рыночным условиям, выполняя функ
FREE

Probability emerges to record higher prices when RVi breaks out oscillator historical resistance level. It's strongly encouraged to confirm price breakout with oscillator breakout since they have comparable effects to price breaking support and resistance levels; surely, short trades will have the same perception. As advantage, a lot of times oscillator breakout precedes price breakout as early alert to upcoming event as illustrated by last screenshot. Furthermore, divergence is confirmed in
FREE

This is the Stargogs Volatility Arrow V1 Yeahhh!!! This Arrow is based on trend, support and demand and based on EMA's. You can change the parameters or settings like you want to. Message Me for the System which works best with this Indicator for free (include: Template, and other indicators). This indicator works with all Currency Pairs, All Volatility indices, All Indices, Boom & Crash Indices, Gold and NASDAQ. Works on All Timeframes Add the following to your chart with Stargogs Volatility A
FREE
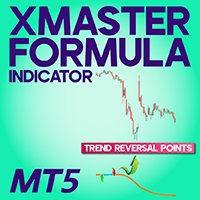
XMaster XHMaster Formula MT5 Indicator – No Repaint Strategy The XMaster / XHMaster Formula Indicator for MetaTrader 5 (MT5) is an upgraded version of the popular MT4 tool, designed to detect trend direction, momentum shifts, and high-probability reversal zones. With enhanced optimization for the MT5 engine, the indicator delivers stable No Repaint signals and performs efficiently on multiple asset classes including Forex, Gold, Cryptocurrencies, and Indices. The MT5 version integrates improved
FREE

VR System – это не просто индикатор, это целая, хорошо сбалансированная торговая система для торговли на финансовых рынках. Система построена на классических правилах трейдинга и комбинации индикаторов Moving Average и канал Дончана ( Donchian channel ). В системе VR System учтены правила входа в рынок, удержание позиции в рынке и правила выхода из позиции. Простые правила торговли, минимальные риски, четкие инструкции делают VR System привлекательной торговой стратегией для трейдеров на финансо
Стохастический RSI (StochRSI) — это технический индикатор, который сочетает в себе характеристики Индекса относительной силы (RSI) и Стохастического осциллятора. Он представляет собой более чувствительный инструмент, который генерирует большее количество торговых сигналов. Разработанный Тушаром Чанде и Стэнли Кроллом, индикатор был создан для устранения предполагаемого недостатка традиционного RSI: низкой частоты активации уровней перекупленности и перепроданности (обычно 80 и 20), особенно на м
FREE

Jackson trendline scanner it a powerful price action tool which draw accurate trendlines and alert a breakout signals . As we all know that trendlines it a most powerful tool in price action by providing us with different chart patterns. e.g. Bullish flag, Pennant, Wedges and more...It not easy to draw trend lines, Most successful traders use trendlines to predict the next move based on chart pattern and breakout. Drawing a wrong trendline it a common problem to everyone, wrong
FREE
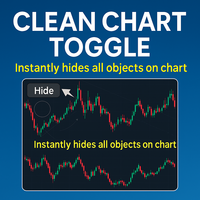
Переключатель чистого графика - Обзор продукта для MetaTrader 5 Обзор Переключатель чистого графика — это удобный индикатор, разработанный для улучшения работы с графиками в MetaTrader 5 (MT5). Он предоставляет простой способ управления видимостью индикаторов и объектов на графике. С помощью одной кнопки, расположенной в верхнем левом углу окна графика, пользователи могут мгновенно скрывать или показывать все индикаторы и графические объекты, уменьшая загруженность графика и помогая сосредоточит
FREE
Strifor Pivot ATR Target Индикатор пивот-уровней с ATR-целями и аналитической панелью
для MetaTrader 5 Strifor Pivot ATR Target — это инструмент для внутридневной и среднесрочной торговли, объединяющий классические пивот-уровни с динамическими целями по ATR и расширенной аналитической панелью. Индикатор помогает заранее оценивать торговый диапазон, вероятные зоны реакции цены и потенциал движения, исключая ручные расчёты и субъективные предположения. Основные возможности Автоматическое построени
FREE

The HammerStar indicator is designed to search for the Hammer and Shooting Star patterns on charts of any currency pairs.
Hammer Downward trend.
The lower shadow is not less than 2 and no more than 3 times larger than the body.
There is no upper shadow, or it is very short (no more than 10% of the candlestick range).
The color of the body in the long game is not important, with the short - white hammer is much stronger than the black one.
Confirmation is suggested.
Shooting Star Uptrend.
The u
FREE

Pivot Point Super trend it can be used to catch price turning points and can show arrows for buying and selling. calculations are based on price peaks . you can control the price turning points by increasing the Pivot point period input on the indicator the ATR factor is for how far apart do you want the bands to be spread apart price break outs are also spotted in their early stages which will make trading much better
FREE

DiverX - это мощный многофункциональный индикатор дивергенций, разработанный для платформы MetaTrader 5 . Он позволяет выявлять как регулярные, так и скрытые дивергенции на основе пяти популярных технических индикаторов: RSI (Relative Strength Index) , RVI (Relative Vigor Index) , Stochastic Oscillator , CCI (Commodity Channel Index) и MACD (Moving Average Convergence Divergence) . Индикатор отображает результаты непосредственно на основном графике, предоставляя визуальные линии, стрелки и метк
FREE
https://www.mql5.com/en/users/gedeegi/seller
The "RSI+ with 123 Fractals" logo is designed to provide a clear and professional visual representation of a complex technical indicator, focused on precise market analysis and reliable patterns. Each element in the design is crafted to reflect the philosophy and strengths of the indicator within the trading world. Design Elements: "RSI+" Text in Bold and White:
The main "RSI+" text is chosen to be the focal point, with a bold and clear font. The us
FREE
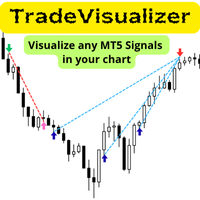
Индикатор Trade Visualizer оживляет ваши торговые данные, отображая полную историю сделок прямо на графиках MT5. Независимо от того, анализируете ли вы собственную производительность или исследуете сигналы трейдеров MQL5, этот инструмент превращает сырые торговые данные в наглядные визуальные элементы. Каждая сделка представлена стрелками входа и выхода, соединёнными линиями и подробными подсказками с ценами, прибылью, объёмом и пунктами — позволяя мгновенно понять логику и эффективность любой с
FREE

Данный индикатор сделан на основе индикатора Parabolic SAR. Он помогает пользователю определиться с направлением сделки. В утилиту также встроена функция звукового уведомления при появлении нового сигнала. Дополнительно доступна функция уведомления по email. Ваш e-mail адрес, а также параметры SMTP сервера должны быть указаны в настройках терминала MetaTrader 5 (вкладка "Почта"). Синяя стрелка вверх = Покупка. Красная стрелка вниз = Продажа. Line = Трейлинг стоп. Вы можете использовать один из м
FREE
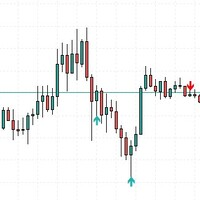
This indicator was creating a perfect structure to not re-paint or recalculate, all signals are accurate. I can create a robotic version of this indicator but I need more precision in the signals. So appreciate this work.
Tips to use when trading, do not buy at the top or sell at the bottom, always buy at the bottom and sell at the top. Risk 1 to 3.
In the settings you can adjust the size of the shadow or trail of the candle, you can change the colors and sizes of the arrows.
FREE

MT4 Version Most indicators draw lines.
This one draws the battlefield. If you ever bought an EA or indicator based on a perfect equity curve — and then watched it bleed out live — you’re not alone.
The problem? Static logic in a dynamic market. Fibonacci Bollinger Bands adapts.
It combines Bollinger structure with customizable Fibonacci levels to mark zones of control — where price reacts, pauses, or reverses. No magic. Just logic that follows volatility. Why this tool matters It
FREE

Этот вспомогательный постоянно обновляющийся индикатор отображает время, оставшееся до закрытия на текущем таймфрейме. Также он показывает цену последней сделки и отклонение от уровня закрытия предыдущего дня. Индикатор полезен дневным трейдерам и скальперам, которые пристально следят за открытием и закрытием свечей.
Настройки индикатора Show in shifted end - по умолчанию: False. Отображение времени и значения на экране. При значении True отображается только время до закрытия возле последней св
FREE
Индикатор сигналов для бинарных опционов, который также эффективно применяется на форексе и других рынках. Подходит для краткосрочной сеточной торговли на M1–M5 и включает сигналы поэтапного наращивания позиций. Бесплатная версия индикатора работает без ограничений на паре XAUUSD (gold). Полная версия доступна здесь https://www.mql5.com/en/market/product/156185 Индикатор использует двухуровневую адаптацию: базовый профиль скорости (настройка “быстрый/плавный” с самого старта) и автоадаптац
FREE
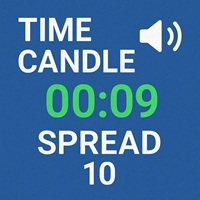
Time Candle with Sound Alert
This indicator will be display the time left candle Features : 1. Multi Time Frames, Multi Pairs 2. Time Left 2. Position dynamic with Bid Price or Edge of Chart Screen 3. Font Size and Color 4. Display Current Spread, Maximum Spread and Minimum Spread
Note: Maximum and Minimum Spread will be reset when you change TF Tested On MT5 Version 5 Build 5200
If you want the source code, just PM me
FREE

It is the very same classic Stochastic indicator, but with a little twist: we changed the Signal Line with a 2-color line, so we can use it with EAs as a filtering system. And that's it! I know it could seem stupid but I needed that, so I created it. The original formula is right from Metaquote's chest, no additions, no subtractions, it is Stochastics in its core.
So I will not publish here the Stochastics parameters as they are all the same as always... Enjoy!
If you like this indicator, all I
FREE

Introducing the South African Sniper Indicator
Created by a dedicated team of South African traders with years of profitable experience in the financial markets, the South African Sniper Indicator is designed to give traders a sharp edge — combining simplicity, precision, and power in one tool.
This is a plug-and-play indicator for MT5, built to deliver accurate BUY and SELL (Sniper Entry) signals — complete with target levels and automated trailing stops. Whether you trade forex, indice
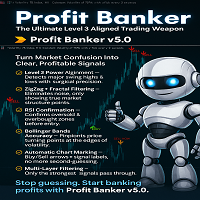
THE 4 GUARDIANS OF PROFIT BANKER
1. LEVEL 3 POWER INDICATOR (The General)
· Identifies MAJOR market turning points · Filters out noise and minor fluctuations · Only acts on significant high/low points
2. ZIGZAG FRACTALS (The Confirmer)
· Validates the Level 3 signals · Ensures swing point authenticity · Adds second-layer confirmation
3. BOLLINGER BANDS (The Boundaries)
· Identifies overextended price levels · Provides natural support/resistance zones · Ensures entries at op

## ONLY GOLD
## Тiльки Золото
## **Mercaria Professional Trading Zones - Complete Guide** ## **Mercaria Professional Trading Zones - Повний посібник**
### **How Mercaria Zones Work / Як працюють зони Mercaria**
**English:** Mercaria Zones is an advanced trading indicator that identifies high-probability support and resistance areas using ZigZag extremes combined with mathematical zone calculations. The indicator works on multiple timeframes simultaneously, providing a comprehensive view

"TPA Sessions" indicator is a very important tool to complement "TPA True Price Action" indicator . Did you ever wonder, why many times the price on your chart suddently turns on a position you can't explain? A position, where apparently no support or resistance level, or a pivot point, or a fibonacci level is to identify? Attention!!! The first run of the TPA Session indicator must be in the open market for the lines to be drawn correctly.
Please visit our blog to study actual trades with

VWAP для скальперов
Осведомленные об этапе линии VWAP для быстрых, точных скальпов. ️ Параметры (MT4/MT5) Enable_Hourly_VWAP: Включить почасовой VWAP. Enable_Asia_VWAP: Включить VWAP сеанса Азии. Enable_Europe_VWAP: Включить VWAP сеанса Европы. Enable_NA_VWAP: Включить VWAP сеанса Северной Америки. Enable_Extended_VWAP: Включить расширенный VWAP сеанса. Enable_Daily_VWAP: Включить дневной VWAP. Сеанс Азии (GMT) Session_Asia_Start_Hour: Время начала сеанса Азии. Session_Asia_End_Hour: Время око
FREE

Volume Horizon - это индикатор горизонтальных объёмов, предоставляющий возможность наблюдать за плотностью объёмов участников рынка в различных ценовых и временных интервалах. Гистограммы объёмов могут быть построены на основе восходящих или нисходящих волн рынка, а также по отдельным барам. Этот инструмент позволяет более точно определять моменты для открытия или закрытия позиций, опираясь на уровни максимальных объёмов или средневзвешенные цены по объёму.
Что делает Volume Horizon уникальным
MetaTrader Маркет предлагает каждому разработчику торговых программ простую и удобную площадку для их продажи.
Мы поможем вам с оформлением и подскажем, как подготовить описание продукта для Маркета. Все продаваемые через Маркет программы защищаются дополнительным шифрованием и могут запускаться только на компьютере покупателя. Незаконное копирование исключено.
Вы упускаете торговые возможности:
- Бесплатные приложения для трейдинга
- 8 000+ сигналов для копирования
- Экономические новости для анализа финансовых рынков
Регистрация
Вход
Если у вас нет учетной записи, зарегистрируйтесь
Для авторизации и пользования сайтом MQL5.com необходимо разрешить использование файлов Сookie.
Пожалуйста, включите в вашем браузере данную настройку, иначе вы не сможете авторизоваться.