Смотри обучающее видео по маркету на YouTube
Как купить торгового робота или индикатор
Запусти робота на
виртуальном хостинге
виртуальном хостинге
Протестируй индикатор/робота перед покупкой
Хочешь зарабатывать в Маркете?
Как подать продукт, чтобы его покупали
Технические индикаторы для MetaTrader 5 - 17

RSI Advanced - Повысьте Уровень Анализа и Высокопотенциальные Торговые Сигналы Обзор RSI Advanced - это мощный пользовательский индикатор для MetaTrader 5, разработанный для повышения уровня вашего технического анализа и предоставления надежных торговых сигналов. Этот индикатор интегрирует стандартный Индекс Относительной Силы (RSI) с сложной системой Скользящих Средних (MA) и Полос Боллинджера (BB), применяемых непосредственно к данным RSI. Более того, он включает возможности продвинутого обнар
FREE

Индикатор GomerAI REGIME — это индикатор классификации рыночных условий для MetaTrader 5, разработанный для того, чтобы помочь трейдерам понять, в каком типе рыночной среды они работают. Вместо генерации торговых сигналов или совершения сделок, REGIME анализирует поведение цены по трем параметрам — сила тренда, волатильность и поведение диапазона — для классификации текущего рынка в один из трех четко определенных режимов: QUIET – Низкая волатильность, условия ограниченного диапазона
TRENDING
FREE
Представляем индикатор Draw On Chart: раскройте свою креативность на графиках!
Устали бороться с проблемами аннотирования ваших торговых графиков, пытаясь понять свои анализы или эффективно передать свои идеи? Вам больше не придется искать решение! Мы рады представить индикатор Draw On Chart - революционное средство, позволяющее легко рисовать и аннотировать непосредственно на графиках всего лишь несколькими щелчками или движениями вашего пера.
Наш инновационный индикатор Draw On Chart разраб
FREE

Trend Dashboard / Trend Scanner – Smart Multi-Timeframe Tool Our Trend Dashboard is an advanced tool for trend analysis that allows you to monitor multiple symbols and timeframes in one place. It displays the current trend direction on popular intervals such as M1, M5, M15, M30, H1, H4, and D1, enabling traders to quickly assess market conditions without manually checking multiple charts. Features: Trend indicators for multiple timeframes in a single dashboard Color-coded trend display: bullish,
FREE
https://www.mql5.com/en/users/gedeegi/seller The GEN indicator is a multifunctional technical analysis tool for the MetaTrader 5 (MT5) platform. It is designed to automatically identify and display key Support and Resistance (S&R) levels and detect False Breakout signals, providing clear and visual trading cues directly on your chart. Its primary goal is to help traders identify potential price reversal points and avoid market traps when the price fails to decisively break through key levels
FREE

BEHOLD!!!
One of the best Breakout Indicator of all time is here. Multi Breakout Pattern looks at the preceding candles and timeframes to help you recognize the breakouts in real time.
The In-built function of supply and demand can help you evaluate your take profits and Stop losses
SEE THE SCREENSHOTS TO WITNESS SOME OF THE BEST BREAKOUTS
INPUTS
MaxBarsback: The max bars to look back
Slow length 1: Period lookback
Slow length 2: Period lookback
Slow length 3: Period lookback
Slow
FREE

Наш индикатор Basic Support and Resistance - это решение, необходимое для повышения технического анализа.Этот индикатор позволяет вам проектировать уровни поддержки и сопротивления на диаграмме/ версия MT4
Особенности
Интеграция уровней Fibonacci: с возможностью отображения уровней Fibonacci наряду с уровнями поддержки и сопротивления, наш показатель дает вам еще более глубокое представление о поведении рынка и возможных областях обращения.
Оптимизация производительности: При возможности о

The "Rejection Block" MetaTrader 5 Indicator offers traders a comprehensive tool for identifying and visualizing rejection candlestick patterns, commonly known as rejection blocks. These patterns are pivotal in discerning potential market reversals or continuations, making them invaluable for traders seeking to enhance their analysis. Key Features: Rejection Block Detection: The indicator diligently scans price data, pinpointing instances of rejection candlestick patterns. These patterns typical
FREE

Adaptive Moving Average (AMA) — трендовый индикатор, использующий скользящую среднюю и фильтр рыночного шума. Особенностью индикатора являются точки синего и красного цветов, показывающие силу тренда.
Рекомендации по торговле:
Вспомогательный индикатор Определение тренда Определение силы тренда Определение потенциальной точки разворота Главный индикатор Показывает точки входа свинг-торговли Выступает динамической поддержкой и сопротивлением Рекомендации по использованию: Любой инструмент Любой т
FREE

DaySpread MinMax — индикатор спреда с Min/Max за день
Что показывает: Текущий спред (Cur) Минимальный спред за текущий день (Min.day) Максимальный спред за текущий день (Max.day) Принцип работы: Раз в 1 секунду индикатор считывает цены Bid/Ask по текущему символу. Текущий спред считается как (Ask − Bid) / Point (в пунктах). Min.day и Max.day обновляются в течение дня и сбрасываются при смене торгового дня (по D1). Данные выводятся на график в виде компактной текстовой панели. Панель можно перета
FREE

Общее Описание Индикатор Fair Gap Value выявляет и подсвечивает «пробелы справедливой стоимости» на графике MetaTrader 5. Fair gap возникает, когда между минимумом одной свечи и максимумом другой свечи, разделённых одной промежуточной, образуется ценовой разрыв. Индикатор рисует цветные прямоугольники (бычьи и медвежьи), чтобы выделить эти зоны и обеспечить наглядную поддержку стратегий, основанных на ценовом действии. Ключевые Особенности Обнаружение бычьих gap : выделяет разрывы между минимумо
FREE

This indicator is designed to help traders to help them Synchronize objects across all charts that have the same pair/currency.
Applicable objects: -Rectangle
-Trendlines
-Trendlines by Angle
-Horizontal Lines
-Vertical Lines
-Arrow Lines
-Channels
- Text boxes
Known Issues : - Visualization is not copied to the other charts. - If indicator is only placed in one chart, other charts with the same pair/currency will have difficulty deleting the objects if there is no "Sync Objects In Charts" in
FREE
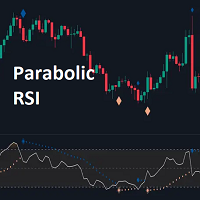
The Parabolic RSI indicator applies the Parabolic SAR directly to the Relative Strength Index (RSI) . This combination helps traders identify trend shifts and potential reversal points within the RSI framework. The indicator provides both regular and strong signals based on whether the Parabolic SAR crosses above or below key RSI thresholds.
KEY FEATURES
Parabolic SAR Applied to RSI – Tracks momentum shifts within the RSI indicator.
Dynamic SAR Dots – Plots SAR levels
** All Symbols x All Timeframes scan just by pressing scanner button ** ***Contact me to send you instruction and add you in "RSI scanner group" for sharing or seeing experiences with other users. Introduction RSI divergence is a main technique used to determine trend reversing when it’s time to sell or buy because prices are likely to drop or pick in the charts. The RSI Divergence indicator can help you locate the top and bottom of the market. This indicator finds Regular divergence for pullba

TILLSON MOVING AVERAGE Также известен как индикатор TMA или T3. Это скользящее среднее, которое использует EMA и DEMA в своей формуле и рассчитывается с биномиальным расширением 3-й степени . ... int handle1; //Handle of the Tillson TMA T3.EX5 custom indicator double euBuff1[]; int TMAperiod= 12 ; int TMSshift= 0 ; double VolumeFactor= 0.618 ; int OnInit () { ... handle1= iCustom ( NULL , PERIOD_CURRENT , "Market\\Tillson TMA T3.EX5" ,0,TMAperiod,0,0,T
FREE

Индикатор анализирует график и определяет японские свечи "Доджи". Показывает их появление и сигнализирует о появлении такой свечи (если разрешено в параметрах). Также, этот индикатор показывает силу разворота в виде столбиков разного цвета (чем больше зелёного цвета, тем вероятнее рост, чем больше красного - падение цены). Направление сигнала зависит от направления предыдущих свечей, так как "Доджи" сигнализирует о развороте или коррекции. В настройках индикатора можно изменять параметры свечи
FREE
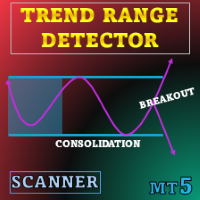
Специальное предложение : ALL TOOLS , всего по $35 за каждый! Этот инструмент будет БЕСПЛАТНЫМ 3 дня, не пропустите! Новые инструменты будут стоить $30 в течение первой недели или для первых 3 покупок ! Trading Tools Channel on MQL5 : Подпишитесь на мой канал MQL5, чтобы получать последние новости Trend Range Detector создан для пользователей, предпочитающих структурированный, основанный на данных взгляд на консолидацию цен. Вместо субъективного чтения графиков он применяет чёткие

Capital Vault System — это профессиональный инструмент технического анализа для MetaTrader 5, разработанный для идентификации рыночной структуры и адаптивной фильтрации ценового шума. В отличие от статических индикаторов, данная система интегрирует три математические модели — Спектральный анализ максимальной энтропии (MESA) , Фрактальную размерность и Гармоническую геометрию — для четкого разграничения направленных трендов и нелинейных зон консолидации. В состав входит встроенная панель риск-мен

Description of the Harmonic Patterns + Fib Indicator
The Harmonic Patterns + Fib indicator is a technical analysis tool designed for MetaTrader 5 (MT5). It automatically detects and visualizes harmonic price patterns on financial charts, leveraging Fibonacci ratios to identify potential reversal points in markets such as forex, stocks, cryptocurrencies, and commodities. The indicator scans for classic harmonic formations like Butterfly, Bat, Crab, Shark, Gartley, and ABCD, drawing them with lin
FREE

Overview Magic 7 Indicator is a comprehensive MetaTrader 5 (MQL5) indicator that identifies seven different trading scenarios based on candlestick patterns and technical analysis. The indicator combines traditional price action patterns with modern concepts like Fair Value Gaps (FVG) to provide trading signals with precise entry points and stop loss levels. Features 7 Trading Scenarios : Each scenario identifies specific market conditions and trading opportunities Visual Signals : Clear buy/sell
FREE

Finally a Metatrader version of the very popular (and expensive) Market Cipher B indicator, or the Vumanchu Cipher B + Divergences very popular on Tradingview platform.
This tool is very heavy on calculations, total are 31 plots using 97 buffers from several indicators. On my mid end computer, timeframes below M15 start getting a bit laggy, so it would require a powerful computer to run it properly at very low timeframes. It's still usable here, but somewhat sluggish response in Metatrader (lik
FREE

This indicator was created based on posts from forex factory thread titled There is no Magic Moving Average - You need only one - by @andose2 a.k.a Andrei Florin. If you want to know about how to use this trading strategy please go and read https://www.forexfactory.com/thread/691864-there-is-no-magic-moving-average-you.
Note: Below are extracts some of the posts .
Estabilish a trend, based on Market Cycles, then go only long in the Markup Phase and only short in the Decline phase , st
FREE

The fact that round number levels have a significant influence on the market cannot be denied and should not be overlooked. These psychological levels are used by both retail Forex traders and major banks that deal in Forex. Very simple and effective indicator and most importantly free. ////////////////////////////////////////////////////////////////////////////////////////////////////////////////////////////////////////////////////////////// The program does not work in the strategy tester.
FREE

This is one of the most popular and highly rated volatility index (VIX) indicators on the market. It provides the same readings as the VIX does for stock indexes. However, this indicator works across all asset classes. VIX Fix Finds Market Bottoms. This indicator is not for inexperienced traders. Use it for day and swing trading. MT4 Version - https://www.mql5.com/en/market/product/112238 Join To Learn Market Depth - https://www.mql5.com/en/channels/suvashishfx
Bernard Baruch summe
FREE

Это пользовательский индикатор, основанный на ценовом действии свечей. Он генерирует оповещения о сигналах покупки или продажи по любому торговому инструменту. Доступны пояснительные материалы по проверке сигналов, методам входа и выхода. Чтобы узнать больше, найдите пояснительные видеоролики по запросу Benjc Trade Advisor на YouTube.
Последняя версия включает фильтры трендов и осцилляторов для повышения точности сигналов. Цена продукта увеличена для неограниченного использования и аренды.
Бу
FREE

Engulfing Candle Detector
Detectable pattern Double Candlestick Patterns Bullish Engulfing
The first candle is black candle. The second candle opens with a gap below the real body of the black candle but rallies upwards to close above the real body of the black candle. In other words, the second candle's real body completely engulfs the first candle's real body Bearish Engulfing
The first candle is white candle. The second candle opens with a gap above the real body of the white candle but dec
FREE

Shadow System Candles - AI Trend Visualization
Concept "Stop trading in the dark. Equip your chart with Night Vision."
Shadow System Candles is the visual core of the "Shadow Operation" project. It eliminates market noise and visualizes the true direction of the trend using AI-based logic (ADX + MA integration).
Note: This tool does not generate buy/sell arrows. It is designed to train your eyes to recognize "Active Trends" and "Dangerous Ranges.
Key Features ・AI Logic Coloring[/b]: Automat
FREE

RSI ABCD Pattern Finder: Technical Strategy 1. How the Indicator Works Combines the classic RSI with automatic detection of ABCD harmonic patterns . Key Components Standard RSI (adjustable period) Peak and Trough Markers (arrows) ABCD Patterns (green/red lines) Overbought (70) and Oversold (30) Filters 2. MT5 Setup period = 14 ; // RSI period size = 4 ; // Maximum pattern size OverBought = 70 ; // Overbought level OverSold = 30 ; // Oversold level Filter = USE_FILTER_ YES ; // Confirmation filte
FREE

Description This technical indicator is designed to automate the analysis of market structure based on price action concepts. It identifies and labels key structural points, including Higher Highs (HH), Lower Lows (LL), Lower Highs (LH), and Higher Lows (HL), to assist traders in visualizing market trends. The indicator uses a configurable "Swing Strength" logic, checking a user-defined number of bars to the left and right of a pivot to confirm its validity. It also identifies Break of Structure
FREE
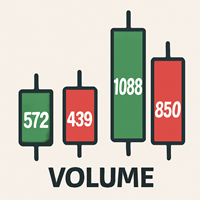
Volume Data on Candles Indicator for MetaTrader 5 Maximize your trading insights with the Volume Data on Candles indicator for MetaTrader 5. This powerful tool provides real-time volume data directly on each candle, allowing you to identify significant shifts in market activity. When the volume of a candle exceeds the average of the last 50 candles, it will be clearly highlighted , ensuring you don't miss out on potential high-volume movements. Key Features: Real-Time Volume Data : Displays volu
FREE

The Entry IQ Indicator is a technical analysis tool designed to assist traders in identifying potential entry points for long and short positions. It utilizes dynamic price boxes, equilibrium zones, and trend detection algorithms to analyze market trends and price movements. The indicator adapts to different broker price digit formats, provides customizable arrow signals, and plots real-time trendlines to refine signal accuracy. By assessing price action over a specific lookback period, Entry I
FREE
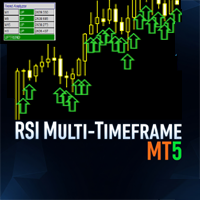
The MultiFrameRSIIndicator is a powerful MetaTrader 5 (MT5) indicator that leverages the Relative Strength Index (RSI) to analyze trends across multiple timeframes. This indicator synchronizes RSI-based trend signals from up to nine timeframes (M1, M5, M15, M30, H1, H4, D1, W1, MN1) and presents them with clear visual feedback, including a colored RSI line, signal arrows, and a customizable dashboard. Ideal for traders seeking momentum-based trend confirmation. Features Multi-Timeframe Analysis
FREE

Description (English): Trend Test by Subho – Advanced Trend & Step Channel System Trend Test by Subho is a powerful all-in-one trend trading system designed to filter noise and provide clear market direction. This indicator combines two sophisticated algorithms: the Trend Test () and the Subho Step Channel into a single chart overlay. It also features a stylish Live Dashboard that alerts you to the current trend status in real-time. Key Features: Trend Test () Logic: An advanced tr
FREE
ZIGZAG and FRACTAL CANDLE PRO ( Only candles, No RSI strength panel) " Suitable for QQE RITZ " > Check My Product is an advanced market structure visualization system built for precision trend detection, powered by dynamic fractal logic and adaptive swing validation.
It seamlessly identifies Higher Highs (HH), Lower Lows (LL), and key structural shifts — allowing traders to read the true rhythm of market transitions with institutional clarity. This system combines ZigZag precision , fractal
FREE

Sessions are very important in trading and often good area where to look for setup. In SMC, ICT we will look for Asian session to serve as liquidity
This indicator displays: High & Low of the Asia session Midnight New York time opening line
Congifuration Line Style, color Label position, size, color Start of the level (Start of the day, Start of the session, Highest or Lowest point in the session)
Any questions or comments, send me a direct message here https://www.mql5.com/en/users/mvonline
FREE

Draw and Sync Objects Multiple Charts 1. Draw objects by key press. ( You must: 1. Press Function key => 2. Click where you want to draw => 3. Draw it => 4. Press ESC to complete). (If you don't want to draw after pressing function key, you must press ESC to cancel). 2. Developing : Sync selected objects to multiple charts by button. 3. Developing: Hide objects that do not belong to the current symbol (Objects drawn with this indicator will belong to the symbol they are plotted on. When your c
FREE

The Donchian Channel Channels are among the most popular tools of technical analysis, as they visually convey to the analyst the limits within which most price movement tends to occur. Channel users know that valuable information can be obtained at any time, whether prices are in the central region of a band or close to one of the border lines.
One of the best known techniques to explore these concepts is Bollinger Bands. However, John Bollinger was not the only one to research the application
FREE

MomoPoints — индикатор, который показывает на графике точки входа/дополнения длинных и коротких позиций.
Основываясь на динамике и силе тренда, MomoPoints показывает входы/дополнения с хорошим соотношением риска и прибыли.
Настройки
----------------------------------
Дизайн: цвета, размер и крылья (графический символ) сигнала можно регулировать.
Настройки сигнала: можно установить период скользящей средней, силу тренда, расстояние от скользящей средней до цены и период RSI.
Значения сигнало
FREE

Advanced Dynamic RSI The **Advanced Dynamic RSI** indicator builds on the classic Relative Strength Index (RSI) developed by J. Welles Wilder. It incorporates volatility-adaptive overbought and oversold levels using moving averages and standard deviation calculations. This adaptation helps the levels adjust to current market conditions, offering a more responsive oscillator compared to fixed thresholds. The indicator is suitable for various instruments and timeframes, supporting analysis in diff
FREE
The Moving Average Ribbon is a technical indicator that overlays a series of moving averages (MAs) on a price chart to visualize trend direction, strength, and potential reversals or reentries. It supports both Exponential Moving Averages (EMA) and Simple Moving Averages (SMA), configurable via user input.
Key Features:
Ribbon Composition: Displays 18 moving averages with periods ranging from 5 to 90 in increments of 5 (e.g., MA5, MA10, ..., MA90), plus an internal MA100 for reference. The MA5
FREE

Hi-Lo - это индикатор, цель которого - более точно определять тенденции данного актива, указывая, таким образом, на возможное лучшее время для покупки или продажи.
Что такое хай-лоу?
Hi-Lo - это термин, полученный из английского языка, где Hi связано со словом High, а Lo - со словом Low. Это индикатор тренда, используемый для оценки торговли активами на финансовом рынке.
Следовательно, его использование дается для определения того, показывает ли конкретный актив восходящий или понижательный
FREE

Приветствую друзья, это обновленная версия для терминала MT5. Это новый мой продукт на основе моего первого индикатора, доработка без лишних настроек оптимизированная под золото. Индикатор поддерживает отправку уведомлений. Рекомендации по использованию:
Инструмент - XAUUSD (основной, оптимизирован под него) Инструмент - XAUEUR (дополнительный, не был оптимизирован под него но результаты мне нравятся) Интервал графика - H4. Установите индикатор на график и забудьте про него, не трогайте. Сигна
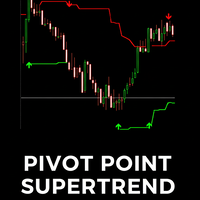
The Pivot Point Supertrend indicator is a technical analysis tool designed for the MetaTrader 5 (MT5) platform. It combines two popular analytical methods: Pivot Points: Uses significant historical price highs and lows to identify potential support and resistance zones. These points are objective and stable. Supertrend: A well-known trend-following indicator that helps identify the current market trend and provides dynamic stop-loss levels. Indicator's Goal: By using the stability of Pivot Point
FREE

If you love this indicator, please leave a positive rating and comment, it will be a source of motivation to help me create more products <3 Key Takeaways Provides both trend and momentum signals in a single view. Entry and exit signals are based on the crossover of the RSI and Signal Line. Market Base Line offers insight into the overall trend direction. Volatility Bands help identify overbought and oversold market conditions.
FREE

XAUUSD Heat Map Scalping Indicator Perfect for 1M, 3M, 5M, 15M Scalping on Gold (XAUUSD) Take your scalping to the next level with this exclusive Heat Map indicator , designed and optimized specifically for XAUUSD . This tool is a powerful visual assistant that helps you instantly identify market strength, pressure zones, and potential entry points in real time. Key Features: Optimized for Fast Scalping : Works best on 1-minute, 3-minute, 5-minute, and 15-minute timeframes Specializ

SETTINGS Make sure to select Chart shift option in the chart.
(Right click in the chart ---> Properties (dialog box) ----> Select Chart Shift)
Kindly rate and comment about the product for upgradation & Support
When using candlestick timers, keep in mind that the timing of candlestick patterns can play a crucial role in your trading strategy. For instance, different timeframes (such as 1-minute, 5-minute, hourly, ) can provide varying insights into price movements and trends. Make sure to i
FREE

Этот индикатор отображает только верхнюю и нижнюю полосы волатильностного канала в стиле Боллинджера, не отображая центральную скользящую среднюю. Его основная цель — предоставить чистый и гибкий волатильностный конверт, позволяя трейдерам сосредоточиться на поведении цены относительно границ канала, сохраняя при этом полный контроль над визуальным оформлением графика. В отличие от традиционных полос Боллинджера, где средняя скользящая всегда отображается, данный индикатор использует скользящую
FREE

This indicator calculates fibonacci levels via moving averages trend and draw these lines. You can change fast and slow Moving Averages settings for customization. Inputs:
Fast MA Time Period : 64 Fast MA Shift: 0 Fast MA Method: Smoothed Fast MA Apply To: Median Price Slow MA Time Period: 32 Slow MA Shift: 0 Slow MA Method: Smoothed Slow MA Apply To: Median Price ZigZag: False ZigZag Color: Red ZigZag Type: DashDot ZigZag Width: VeryThin Fibo Settings TrendFibonacci: True FiboTrendColor: Black
FREE
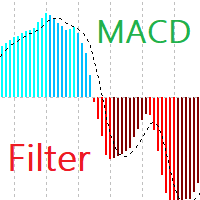
MACD Filter Представляю MACD Filter – новый взгляд на любимый индикатор MACD (Moving Average Convergence Divergence), разработанный специально для платформы MetaTrader 5. Применяя преобразование Фишера для фильтрации и уточнения данных, MACD Filter создает более гладкие линии, устраняя шум и обеспечивая более четкие сигналы. Фильтрация преобразованием Фишера : Нормализует и сглаживает данные MACD. Это приводит к плавным, менее хаотичным линиям по сравнению с традиционным MACD, снижая ложны
FREE

Meta Cipher A: Точный индикатор наложения для ценового действия Meta Cipher A переносит популярную концепцию Market Cipher A в MetaTrader 5 как точный индикатор наложения. Разработан для отображения предупредительных сигналов прямо на графике цены, сочетая 8 EMA ленту , анализ WaveTrend и восемь различных типов сигналов, чтобы помочь вам выявлять входы, выходы и зоны повышенного риска до их полного формирования. Хотя Meta Cipher A является мощным инструментом сам по себе, он разработан для естес
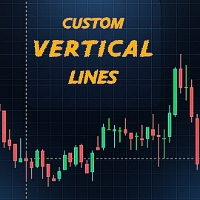
Этот индикатор автоматически рисует вертикальные линии в ваши выбранные моменты дня и при необходимости добавляет горизонтальную линию на основе цены открытия в это время. Он помогает трейдерам отмечать ключевые события, такие как торговые сессии, время для стратегий или индивидуальные уровни. Features: Рисует до двух настраиваемых вертикальных линий каждый день. Возможность добавить горизонтальную линию от цены открытия выбранного времени. Полностью настраиваемые цвет, стиль и толщину линии . Л
FREE

Norion Smart Levels is a professional support and resistance indicator developed to help traders identify the most relevant price levels where the market historically reacts. The indicator analyzes price structure and market behavior to automatically plot key support and resistance levels, eliminating subjectivity and reducing chart noise. The result is a clean, objective, and easy-to-read visualization that adapts to different market conditions. Key Features: Automatic detection of support and
FREE
Индикатор Flower — это инструмент технического анализа, который в основном используется для определения трендов и помощи в стратегиях скальпинга или внутридневной торговли.
Индикатор Flower — это индикатор сигнального тренда, основанный на техническом и ценовом анализе динамики. Он визуально сигнализирует о трендах с помощью цветных цветов: синие цветы указывают на восходящий тренд, а красные — на нисходящий
Каждый уровень может действовать как поддержка и сопротивление (следите за уровнями +
FREE

Gold TL MTF – это прекрасный биржевой технический индикатор. Алгоритм индикатора анализирует движение цены актива и отражает трендовые линии по фракталам заданного таймфрейма (ТФ).
Преимущества индикатора: И ндикатор выдает сигналы с высокой точностью. Подтвержденный сигнал индикатора не исчезает и не перерисовывается. Торговать можно на торговой платформе MetaTrader 5 любого брокера. Торговать можно любыми активами (валюты, металлы, крипто валюты, акции, индексы и т.д.). Торговать можно на л
FREE

An MT5 divergence scanner that automatically finds divergence / hidden divergence between price and a chosen oscillator , then draws the matching trendlines/channels in the indicator window and can alert you when the line is crossed. Key features (simple) Auto Divergence Detection Bullish divergence : price makes a lower low while oscillator makes a higher low (possible reversal up). Bearish divergence : price makes a higher high while oscillator makes a lower high (possible reversal down). Hidd
FREE
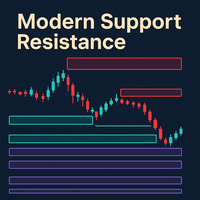
Dynamic S/R indicator that creates zones from fast/slow fractals, merges them if they overlap, classifies them (Possible, Untested, Verified, Turncoat, Weak), highlights the one closest to current price, and sends alerts when price enters the area. It supports testing mode, visual themes, zone extension/merge, global variables for EA integration, optional display of broken zones, and an adaptive ATR-based fuzz filter (with automatic fallback).
My indicators for free. I only ask that leave your
FREE
The AX Forex Indicator MT5 is a sophisticated trading tool designed to provide traders with a comprehensive analysis of multiple currency pairs. This powerful indicator simplifies the complex nature of the forex market, making it accessible for both novice and experienced traders. AX Forex Indicator uses advanced algorithms to detect trends, patterns and is an essential tool for traders aiming to enhance their forex trading performance. With its robust features, ease of use, and reliabl

AstroCycles: Advanced Financial Astronomy Indicator Overview AstroCycles is a sophisticated technical analysis tool developed for the MetaTrader 5 (MQL5) platform. It bridges the gap between orbital mechanics and financial market analysis by calculating precise astronomical cycles and visualizing them directly on your trading chart. Unlike standard indicators that rely on past price data, AstroMaster utilizes high-precision astronomical algorithms (Keplerian Elements and Brown’s Lunar Theory)
FREE

Во многих стратегиях довольно часто используется масштабированный ATR для определения стоп-лосса, и нередко его также используют для целей тейк-профита. Хотя можно использовать встроенный индикатор ATR и вручную рассчитать значение смещения, он не особенно интуитивен или эффективен и может привести к просчетам.
Функции Настраиваемое смещение ATR Верхняя и нижняя полоса. настраиваемый коэффициент масштабирования ATR альтернативный (неграфический) таймфрейм ATR явно определенные типы ввода для у
FREE

Schaff Trend Cycle (STC) "CON ALERTAS"
El Indicador Schaff Trend Cycle (STC) es una herramienta técnica utilizada en el trading e inversión para identificar tendencias y generar señales de compra o venta. ¿Qué es el Schaff Trend Cycle? El STC fue desarrollado por Doug Schaff para mejorar las medias móviles incorporando análisis de ciclos. Su objetivo es identificar tendencias y cambios de tendencia midiendo la fuerza y velocidad de los cambios de precio. Es un oscilador que mide la velocidad
FREE

Fibo Trend Smart MAXIMUS Ritz Fibo Trend Smart MAXIMUS 1 is an advanced trading indicator that integrates various technical analysis tools into one comprehensive display. This indicator is designed to help traders identify trading opportunities with high accuracy, utilizing a combination of Fibonacci, ZigZag, and price action confirmation. Key Features Smart Fibonacci Retracement 11 Customizable Fibonacci Levels (0%, 23.6%, 38.2%, 50%, 61.8%, 100%, 123.6%, 138.2%, 150%, 161.8%, 200%) Different
FREE

This Quarter Levels Indicator for MQL5 is a sophisticated technical analysis tool designed to capitalize on "Psychological Levels" or "Round Numbers" in financial markets. It operates on the principle that institutional order flow, stop-losses, and take-profit targets tend to cluster at specific mathematical intervals—specifically the whole numbers ( 00 ), midpoints ( 50 ), and quarter points ( 25 and 75 ). By dividing price action into these four distinct quadrants, the indicator provides a cle
FREE
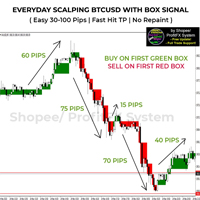
Always getting MARGIN CALLS again and again? Still haven’t found an indicator or technique that DELIVERS CONSISTENT DAILY PROFIT ? Tired of depositing funds and desperately wishing you could FINALLY WITHDRAWING ?
Don’t worry. I’m a REAL FULL TIME TRADER and I’ll share with you the very indicator I'VE BEEN USING MYSELF to successfully become a full-time trader.
STOP WASTING time with indicators that aren’t created by real traders and have no proven track record!
Start tod

With this easy to set up indicator you can display and set alerts for the following candlestick formations: Bull Breakout, Bear Breakout, Hammer, Pin, Bullish Engulfing, Bearish Engulfing. Input parameters: ShortArrowColor: The color of the Arrows, displaying a Bearish candle formation LongArrowColor: The color of the Arrows displaying a Bullish candle formation BullishEngulfing: Disabled/Enabled/EnabledwithAlert BearishEngulfing: Disabled/Enabled/EnabledwithAlert Pin: Disabled/Enabled/Enabledw
FREE

KT Candlestick Patterns находит и отмечает 24 самых надёжных японских свечных паттерна в реальном времени. Японские трейдеры используют свечные модели для прогнозирования направления цены с XVIII века. Конечно, не каждому свечному паттерну можно доверять одинаково. Однако в сочетании с другими методами технического анализа, такими как уровни поддержки и сопротивления, они дают более точное понимание рыночной ситуации.
Этот индикатор включает множество свечных моделей, подробно описанных в книг

Gann Hilo — Точность и ясность в тенденции Канал на YouTube: @BotPulseTrading
GannHilo — это технический индикатор, созданный для точного и наглядного определения изменений тренда на рынке. Объединяя структуру цены с теорией Ганна , система строит динамические линии, которые служат умными ориентирами направления и поддержки . Минималистичный дизайн и оптимизированный алгоритм обеспечивают чистое и эффективное отображение, показывая, когда импульс меняет направление без шума и задержек. Идеален
FREE

AllTF Trend Bias Indicator is a professional tool to visualize market bias, designed mainly for 1-minute charts. The colors are not trading signals by themselves, but a visual compass to guide your decision-making: HiddenEdge release model
All HiddenEdge tools follow the same structured release plan.
Each indicator is released initially for free to collect feedback.
After reaching a stable user base, it moves to a fixed paid tier.
Some utilities remain permanently free as part of the Hidde
FREE
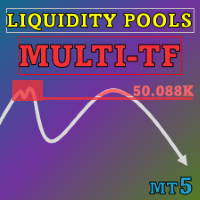
Special offer : ALL TOOLS , just $35 each! New tools will be $30 for the first week or the first 3 purchases ! Trading Tools Channel on MQL5 : Join my MQL5 channel to update the latest news from me Индикатор Liquidity Pools – это продвинутый инструмент, который определяет и отмечает потенциальные зоны ликвидности на графике, анализируя области с частыми касаниями и объемом торговли в каждой зоне. Этот инструмент дает трейдерам полное представление о рыночной динамике, помогая им пр

BEHOLD!!!
One of the best Breakout Indicator of all time is here. Multi Breakout Pattern looks at the preceding candles and timeframes to help you recognize the breakouts in real time.
The In-built function of supply and demand can help you evaluate your take profits and Stop losses
SEE THE SCREENSHOTS TO WITNESS SOME OF THE BEST BREAKOUTS
INPUTS
MaxBarsback: The max bars to look back
Slow length 1: Period lookback
Slow length 2: Period lookback
Slow length 3: Period lookback
Slow leng
FREE
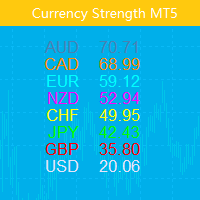
Этот индикатор показывает относительную силу 8 основных валют: USD, EUR, GBP, AUD, NZD, CAD, CHF и JPY. Значение прочности нормировано на диапазон 0-100: Значение выше 60 означает сильный. Значение ниже 40 означает слабость.
Входы Only Show Current Pair - если это правда, отображается только пара текущего графика, в противном случае отображаются все 8 кривых. Bars To Show – количество баров для отображения кривой силы. Ma Periods To Smooth Curves — периоды скользящей средней для сг
MetaTrader Маркет - уникальная площадка по продаже роботов и технических индикаторов, не имеющая аналогов.
Памятка пользователя MQL5.community расскажет вам и о других возможностях, доступных трейдерам только у нас: копирование торговых сигналов, заказ программ для фрилансеров, автоматические расчеты через платежную систему, аренда вычислительных мощностей в MQL5 Cloud Network.
Вы упускаете торговые возможности:
- Бесплатные приложения для трейдинга
- 8 000+ сигналов для копирования
- Экономические новости для анализа финансовых рынков
Регистрация
Вход
Если у вас нет учетной записи, зарегистрируйтесь
Для авторизации и пользования сайтом MQL5.com необходимо разрешить использование файлов Сookie.
Пожалуйста, включите в вашем браузере данную настройку, иначе вы не сможете авторизоваться.