Смотри обучающее видео по маркету на YouTube
Как купить торгового робота или индикатор
Запусти робота на
виртуальном хостинге
виртуальном хостинге
Протестируй индикатор/робота перед покупкой
Хочешь зарабатывать в Маркете?
Как подать продукт, чтобы его покупали
Технические индикаторы для MetaTrader 5 - 25
The Absorption & Exhaustion Detector Professional indicator is a sophisticated volume analysis tool designed to identify critical market turning points by analyzing the relationship between price movement and cumulative volume delta (CVD). This indicator helps traders spot when price movements lack volume confirmation, indicating potential absorption or exhaustion zones. KEY FEATURES Real-time Cumulative Volume Delta (CVD) calculation and normalization Price-volume divergence gap measurement dis

The Stochastic Oscillator is one of the main indicators used in the analysis of financial assets. It is one of the highlights in the study of price movements and can be an important indicator of changing trends in the capital market. Stochastic is an oscillator used to identify when an asset is overbought or oversold. It consists of two lines: %K, which is calculated from the highs and lows of a period, and %D, which is a moving average of %K. Our version contains color filling, which facilitate
FREE

«HiperCube USD INDEX (DXY /USDX) » — это финансовый бенчмарк, представляющий собой производительность определенной группы активов, таких как акции, облигации или сырьевые товары, стоимость которых выражена в долларах США. Эти индексы помогают инвесторам отслеживать и сравнивать производительность определенных секторов или рынков с течением времени. Выражаясь в долларах США, индекс обеспечивает последовательную меру оценки инвестиций независимо от национальной валюты активов или географического
FREE

Read This : Please provide comments and reviews for future improvements. WaveTrendPro_Indi v1.05
WaveTrend indicator with enhanced histogram visualization: WaveTrendPro_Indi v1.05
Indikator WaveTrend dengan tampilan histogram yang lebih jelas: Histogram otomatis lebih tinggi (bisa diatur dengan parameter HistScale ). Warna histogram berbeda untuk positif & negatif → tren naik lebih mudah dibaca. Tetap ringan & responsif di berbagai pair/timeframe. Cocok untuk scalper, swing trader,
FREE
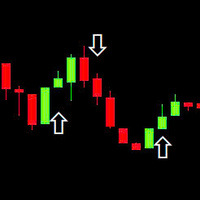
This indicator is based on the RSI (Relative Strength Index) to identify potential Breakout points and draw arrows on the chart to suggest buy/sell signals. Use RSI to find breakout signals. Draw Buy/Sell arrows on the chart. Send alerts when there is a trading signal. Buy (Orange Arrow - 0xFFAA00): When a buy signal appears. Sell (Blue Arrow - 0x0000FF): When a sell signal appears. DRAW_ARROW: Used to draw arrows on the chart.
FREE
MFI Divergence is a technical indicator that detects regular bullish and bearish divergences between price and the Money Flow Index (MFI) at swing highs and lows. It highlights potential reversal points by drawing clean green (bullish) and red (bearish) arrows directly on the chart. The indicator uses configurable swing detection, customizable MFI period, and an optional MFI threshold filter to show signals only in oversold/overbought zones. Alerts are triggered only once per bar on candle close
FREE

"Представляем вам NakaTrend: ваш идеальный индикатор тренда для MetaTrader 5!
Готовы к революции в вашем опыте торговли? Знакомьтесь с NakaTrend, вашим надежным индикатором для определения изменений тренда с точностью и легкостью.
С NakaTrend вы никогда не упустите возможность скапитализировать на изменениях рынка. Когда появляется бычий тренд, NakaTrend сигнализирует о нем зеленым знаком доллара, подталкивая вас к оформлению ордера на покупку. И когда наступает медвежий период, появляется кр
FREE

Индикатор Supply Demand RSJ PRO рассчитывает и строит на графике зоны «Предложение» и «Спрос», определяя тип Зоны (Слабая, Сильная, Проверенная, Проверенная) и в случае повторных проверок Зоны показывает, сколько раз она был повторно протестирован. Зоны "предложения" - это ценовые зоны, в которых предложение превышает спрос, что приводит к снижению цен. Зоны «спроса» - это ценовые зоны, в которых наблюдается больший спрос, чем предложение, что приводит к росту цен.
Обязательно попробуйте нашу

The initial balance (IB) is a range in which the price spent its first two OPT periods after the opening. In other words, the opening balance is a range of the first hour after the market opened. The opening balance arose from room trading, as room traders observed the various ranges after the market opened.
This indicator allows you to enter the starting and ending hours and minutes of a specific hourly time range so that the trader can set up different IBs according to the market.
Automatic
FREE
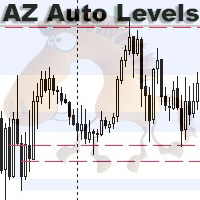
AZ Auto Levels builder ATR edition Indicator of automatic level drawing. For different instruments you need to play with the parameters to find the right ones. So, what is its idea - the indicator searches for levels of interest on the timeframe selected in the settings (by default H1). The search occurs only on candles that are 30% greater than the standard daily ATR of similar candles (you can change this in the settings). ATR is calculated for 20 days ago (also can be changed in the settings)
FREE

The RSI Divergence Indicator is a powerful tool designed to identify potential reversals in the market by spotting discrepancies between the Relative Strength Index (RSI) and price movement. Divergences can be a significant indication of an impending trend change, either from bullish to bearish or vice versa. This indicator is built for making the task of identifying potential trade opportunities more straightforward and efficient.
Features: Automatic Detection: The indicator scans the chart
FREE

В Clock GMT Live есть все, что вам нужно, чтобы узнать больше о нашем брокере, много раз вы задавались вопросом, на каком GMT я нахожусь или над каким GMT работает мой брокер, что ж, с помощью этого инструмента вы сможете узнать в режиме реального времени как GMT смещение времени брокера и вашего местного времени, вы также будете постоянно знать пинг брокера Просто поместив его на время суток, вы можете получить информацию
Цена увеличивается за каждое приобретение, с этим мы защитим, чтобы нем
FREE
WYSIWYG OPEN RANGE BREAKOUT - PRO EDITION
Ultra-precise ORB indicator with smart line-breaking, dynamic ATR-based targets, and multi-session adaptability. Perfect for day, swing, and algorithmic traders seeking clear visuals and actionable levels . Trade with confidence – see what you trade, trade what you see . "What You See Is What You Get" "What You See Is What You Get" – The ultimate ORB indicator delivering ultra-precise trading range visualization with a smart line-breaking system. Built
FREE

Это непараметрический зигзаг с несколькими режимами работы. Ребра идут вверх до тех пор, пока не встретится бар, максимум (high) которого ниже самого высокого минимума (low), а ребра вниз продолжаются до тех пор, пока не встретится бар, минимум (low) которого расположен выше самого низкого максимума (high); Развороты Ганна: ребро идет вверх пока high и low повышаются у каждого следующего бара; ребро идет вниз пока high и low понижаются у каждого следующего бара; внутренние бары (с более низким
FREE

Trading Dashboard Pro: Ваш профессиональный командный центр в MetaTrader 5 Полный контроль над счетом, рисками и историей торговли Trading Dashboard Pro — это не просто индикатор, это комплексная утилита для управления рисками и анализа счета, разработанная специально для профессиональных трейдеров, участников проп-трейдинговых фирм (Prop Firms) и серьезных скальперов. Объединяя критически важные рыночные данные, показатели здоровья счета и историческую эффективность в едином элегантном ин
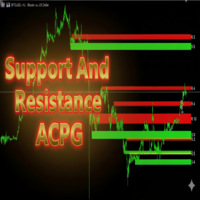
Support And Resistance ACPG Indicator
The Support And Resistance ACPG Indicator (developed by Grok by xAI) is an advanced tool for the MetaTrader 5 (MQL5) platform, designed to identify and visualize support and resistance zones on a price chart. Unlike traditional support and resistance indicators, the ACPG method combines a dynamic approach based on swing points, volatility analysis using the Average True Range (ATR), and an adaptive clustering system to detect high-relevance zones in the
FREE
FREE VERSION FOR GOLD (XAUUSD) AND BTCUSD Dont forget to rate after use this indicator, Thanks.
Features: Clear Buy/Sell labels with directional arrows. Automatic Take Profit (TP) & Stop Loss (SL) labels for better risk management. Easy-to-read chart signals (no messy lines). Works on any timeframe and any asset (Forex, Gold, Indices, Crypto, Stocks). Compatible with MetaTrader 5 (MT5 desktop & mobile sync) . Perfect for: Beginner traders who need straightforward sign
FREE

Fundamentação teórica A VWAP é uma média móvel ajustada pelo volume, ou seja o peso de cada preço corresponde ao volume de ações negociadas no período, dando mais importância ao período em que se tenha mais negociações. [1] VWAP = sum(price[i]*volume[i]) / sum(volume[i]) Metodologia É possível configurar o período que será utilizado para o calculo da VWAP, a cor, a espessura e o estilo da linha. A linha é desenhada desde a o começo da série disponível apenas uma vez para economizar recursos com
FREE
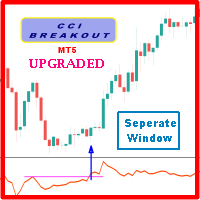
Probability emerges to record higher prices when Commodity Channel Index breaks out oscillator historical resistance level when exhibit overbought values. Since, oscillator breakout of support and resistance have similar effect as price breaks support and resistance levels, therefore, its highly advised to confirm price breakout with oscillator breakout; certainly, will have the same output in short trades. Concept is based on find swing levels which based on number of bars by each side of peak
FREE
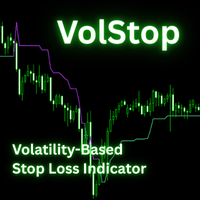
The VolStop Adaptive Volatility-Based Trailing Stop Indicator for MT5 VolStop is a precision volatility-stop indicator for MetaTrader 5, built for traders who want to stay in winning trades longer and exit with discipline. Instead of fixed pips or moving averages, VolStop dynamically tracks price action with ATR-based bands, automatically adapting to market turbulence. Key Features Adaptive Volatility Stops – Calculates a dynamic trailing stop using ATR and a user-set multiplier to match changi
FREE

Entry Point M5 — готовая торговая система. Entry Point M5 — это мощный индикатор, созданный как полноценная торговая система для работы на любых валютных парах. Он анализирует структуру движения цены, определяя ключевые моменты разворота и появления нового импульса. Индикатор способен адаптироваться к различным рыночным фазам — от сильных трендовых движений до боковых диапазонов — и выдавать визуально понятные сигналы без необходимости дополнительных фильтров или вспомогательных индикаторов. Тор

DiverX - это мощный многофункциональный индикатор дивергенций, разработанный для платформы MetaTrader 5 . Он позволяет выявлять как регулярные, так и скрытые дивергенции на основе пяти популярных технических индикаторов: RSI (Relative Strength Index) , RVI (Relative Vigor Index) , Stochastic Oscillator , CCI (Commodity Channel Index) и MACD (Moving Average Convergence Divergence) . Индикатор отображает результаты непосредственно на основном графике, предоставляя визуальные линии, стрелки и метк
FREE

This indicator is based on Bollinger Bands and moving averages, and uses ADX to get the turning point of the market trend and display a sign.
It is basically intended for use with currency pairs and futures with high volatility. In our tests we use it on XAUUSD, 5m and 15m. Win rate is more than 80% with 50 pips stop loss and 50 pips gain or more.
The indicator is also a simple indicator that allows you to enable or disable alerts and change the color of the arrows from the indicator settings
FREE

Lot Size Calculator - Smart Risk Management Tool
The Lot Size Calculator is a simple but powerful MetaTrader indicator that helps traders manage risk with precision. Instead of guessing your position size, this tool instantly calculates the exact lot size you need based on your account equity, chosen risk percentage, and reward ratio (1:1, 1:2, etc.).
Features:
Input your account equity and risk % per trade Supports both long (buy) and short (sell) trades Automatically adjusts for diffe
FREE
Advanced UT BOT ALERTS for MT5 Профессиональная система обнаружения тренда с многоуровневыми фильтрами | Улучшенный движок UT BOT Мы предоставляем только индикаторы высокого качества. Advanced UT BOT создан для профессионального использования и имеет устойчивую логику сигналов и безопасные расчёты, исключающие задержки или ложные обновления.
Он не перерисовывает, не удаляет и не изменяет прошлые сигналы.
Все сигналы BUY и SELL генерируются только после закрытия свечи и остаются зафиксированными.
Будьте на шаг впереди рыночного импульса с помощью Pip Movement Alert MT5 — универсального мультивалютного индикатора, предназначенного для отслеживания и оповещения трейдеров о точных движениях в пунктах по нескольким символам, идеально подходящего для торговли на рынках форекс, акций, криптовалют и сырьевых товаров. Высоко ценится в торговых сообществах, таких как Forex Factory и Reddit’s r/Forex, и отмечен в обсуждениях на Investopedia и TradingView за способность выявлять внезапные рыночные
FREE

Keltner-Enhanced улучшает точность и читаемость каналов Кельтнера, предоставляя множество опций для их настройки и более пяти расчетов цены, чем META по умолчанию.
Индикатор Keltner-E - это полосовой индикатор, подобный полосам Боллинджера и конвертам скользящих средних. Они состоят из верхнего конверта над средней линией и нижнего конверта под средней линией.
Основными событиями, на которые следует обратить внимание при использовании каналов Кельтнера, являются прорывы выше верхнего конверт
FREE
Simple Spread Indicator (SSI) is a simple and lightweight indicator that displays the current spread value directly on the main chart window.
It helps traders instantly recognize market liquidity conditions and trading costs without opening additional panels or tools. Features Real-time spread display on the main chart Customizable position and font size Minimal system load and no data buffering Useful for scalping and low-spread strategy monitoring How it works The indicator calculates the diff
FREE
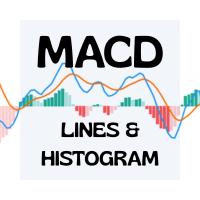
Advanced MACD Indicator with 6 Colors & Adjustable Line Thickness Elevate your trading charts with this fully customizable MACD indicator for MetaTrader 4/5. With six independent color slots and per-line thickness controls, you can tailor every element to your exact preferences. Key Features Six Separate Color Slots
Customize each component with its own color: MACD Line Signal Line Histogram Bars (Bullish) Histogram Bars (Bearish) Zero Line Adjustable Line Thickness
Choose any thickness—from e
FREE

Adaptive Session Trend Pro Easy Plug-and-Play Auto-Optimized Session Trend Indicator for MT5 Adaptive Session Trend Pro is a fully automatic, session-aware trend indicator for MetaTrader 5 that intelligently adapts to the symbol, instrument type, and broker trading session — with zero manual configuration required . Simply attach the indicator to any chart and it instantly: Detects the traded instrument (XAUUSD, US30, EURUSD, Forex pairs) Detects broker server time automatically Applies the cor
FREE

Currency Strength Chart is a powerful Forex indicator designed to track and visually represent the strength of individual currencies within a basket of the 8 major currencies: USD, EUR, GBP, JPY, AUD, NZD, CAD, and CHF. By calculating the relative strength of each currency, the indicator provides traders with a comprehensive overview of how each currency is performing against the others in real-time. This indicator helps traders identify potential trading opportunities by highlighting strong cur
FREE

The big figure is a crucial aspect of forex trading, serving as a reference point for trade execution, risk management, and technical analysis. By understanding the importance of the big figure and incorporating it into their trading strategies, forex traders can improve their decision-making process and increase the likelihood of successful trades. Why is the Big Figure Important? The big figure is important for several reasons: Simplification: Traders often refer to the big figure when discu
FREE

Divergence Hunter - Professional Multi-Oscillator Divergence Detection System Overview Divergence Hunter is a professional-grade technical indicator designed to automatically detect and visualize price-oscillator divergences across multiple timeframes. Built for serious traders who understand the power of divergence trading, this indicator combines precision detection algorithms with an intuitive visual interface. Key Features Multiple Oscillator Support: RSI (Relative Strength Index) MACD (Mo
FREE

Several assets in several markets have the behavior of using specific numbers as Force Numbers, where support, resistance and price thrust is created. Let this indicator draw those levels of support and resistance for you. You can also stack it to show different level of Prices! This technique is being used by Tape Readers and Order Flow traders all over the world for a long time. Give it a try. Challenge yourself to study new ways of Price Action!
SETTINGS
What Price reference to use in the c
FREE

Volume Gives Depth To Price Action! Volume Critical can accurately locate the cheapest areas to place trades. Enter reversals as early as possible to get the best Risk Reward setups!
Features Aggressive algorithm that anticipates reversals Volume Classifications Gray Histograms - Normal Volume, average market activity Orange Histogram - Trending Volume, increased market activity Pink Histograms - Overbought Volume, we can wait for further confirmation to sell Blue Histograms - Oversold Conditio
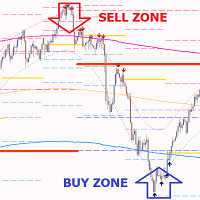
Gold PL MTF – это прекрасный биржевой технический индикатор. Алгоритм индикатора анализирует движение цены актива и автоматически отражает важные Pivot Levels заданного таймфрейма (ТФ) по методике Fibonacci (золотое сечение). Live Signal of manual trading >>> [ Click Here ] Индикатор прекрасно описывают траекторию цены выбранного таймфрейма (день, неделя, месяц, год), определяет начало тренда и начало коррекции, которая возможно перерастёт в противоположный тренд. Также индикатор показывает те

Excellent tracking performance and minimal noise! This trend detection indicator that avoids whipsaws and uncertain market noise and is also agile enough to react to changes in trend.
It is also designed to adapt to dynamic markets.
Functions mainly as a filter to help you trade in the direction of the trend.
Features.
Simple and easy to use. Low load and easy to try out The excellent tracking performance and smooth lines that make it ideal for market analysis Can be used as a trend filter for
FREE

A simple price action indicator to highlight inside and outside bars (candles) with colors. It is possible to choose what type of bar can be highlighted among: inside, ouside or both. It is can be possible to choose a first specific color for the shadow and the border of bars (candles), a second specific color for high/bull bar (candle) and a third specific color for down/bear bar (candle)
FREE

LogVar — это индикатор, который вычисляет и отображает логарифмическое изменение цены , более точный способ измерения процентных изменений между периодами. Он сравнивает текущую цену закрытия с ценой закрытия n периодов назад (параметр iPeriod ) и отображает результат на увеличенной логарифмической шкале, что упрощает визуализацию силы и направления движения. Цвет линии меняется автоматически в зависимости от знака изменения: Зелёный: цена выше логарифмического эталона (восходящий тренд). Красны
FREE

Автоматический профиль объема с фиксированным диапазоном с оповещениями для MT5
Этот индикатор показывает, где цена провела больше времени, выделяя важные уровни, которые можно использовать в торговле.
и может отображать плотность цен с течением времени, выделяя наиболее важные ценовые уровни, области значения и контрольное значение данной торговой сессии. Этот индикатор можно прикрепить к таймфреймам между M1 и D1, и он будет показывать профиль рынка для дневных, недельных, месячных или даже

An “inside bar” pattern is a two-bar price action trading strategy in which the inside bar is smaller and within the high to low range of the prior bar, i.e. the high is lower than the previous bar’s high, and the low is higher than the previous bar’s low. Its relative position can be at the top, the middle or the bottom of the prior bar.
The prior bar, the bar before the inside bar, is often referred to as the “mother bar”. You will sometimes see an inside bar referred to as an “ib” and its m
FREE

Certainly! Let me introduce you to a powerful tool for MetaTrader 5 (MT5) that can automatically identify and draw support and resistance (S&R) levels on your trading charts. This tool is called the “Support and Resistance Levels Guru” . Support Resistance Levels Guru The Support & Resistance Indicator automatically displays essential S&R levels on your chart. These levels are crucial for technical analysis and are used by many traders. Resistance levels (zones) are shown in R ed , while suppo
FREE
The Channel Sgnals ProfRoboTrading Indicator for MT5 is an effective Forex trading tool designed to track market movements. The MT5 signal point indicator effectively detects trend reversals after they have already occurred. This Indicator is a fully automated technical tool that includes a number of parameters to track market trends. It automatically examines the ever-changing price dynamics of the market, compares the information with earlier data and generates a trading signal. Because
FREE

King Smart Liquidity MT5 — это продвинутый аналитический индикатор, специально разработанный для отслеживания потоков институциональных денег и крупных банков на рынках форекс, золота, индексов, Биткойна и других. Этот индикатор был создан на основе методологии "Smart Money Concept" (Концепция Умных Денег), которая опирается на понимание поведения цены (price action), зон ликвидности и того, как ведут себя крупные финансовые институты на рынке. Индикатор не просто рисует линии или зоны, а предо
Rinse and Repeat indicator for 3 day/session/week setups. Check out our other products for fxer.net:
https://www.mql5.com/en/market/product/114888
https://www.mql5.com/en/market/product/114890
Indicator daily features: Daily close/high/low Weekly open/high/low/close Month open/high/low/close Daily breakouts Daily failed breakouts Asia/London/New York sessions Inside days Outside days Green days Red days
Indicator weekly features:
Weekly breakouts Week dividers Indicator other features: Das
FREE
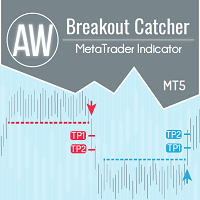
Пробои ценовых уровней, продвинутая статистика, расчет ТейкПрофита и 3 вида уведомлений. Преимущества: Не перерисовывает свои результаты Сигнал строго на закрытии свечи Алгоритм фильтрации ложных пробоев Отлично сочетается с любой трендовой стратегией Работает на всех инструментах и таймсериях Руководство пользователя и инструкция -> ЗДЕСЬ /Решение проблем -> ЗДЕСЬ / МТ4 версия -> ЗДЕСЬ Как торговать с индикатором: Торговля с AW Breakout Catcher всего в три простых шага: Шаг 1 - Открытие п

Market Structure Shift with FVG Indicator for MT5 This MT5 indicator from the apexfintech.net suite identifies market structure shifts and fair value gaps (FVGs) to provide traders with potential trading opportunities. It alerts users on these events via mobile notifications, enabling them to react quickly to changing market conditions. Key Features: Market Structure Shift Detection: Identifies bullish and bearish market structure shifts based on swing high/low breaks and significant candl
FREE

TickChartAskLine - это специализированный индикатор для MetaTrader 5, предназначенный для визуализации плавающего спреда на тиковых графиках, созданных с помощью TickChartService. Индикатор отображает две линии на графике: синюю Bid линию (основная цена) и красную Ask линию, позволяя трейдерам визуально отслеживать динамику спреда в режиме реального времени. Это критически важно для скальперов и высокочастотных трейдеров, которым необходимо контролировать стоимость входа в позицию на каждом
FREE
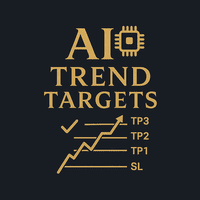
AI Trend Targets – Precision Entries, Targets & Risk in One Overlay AI Trend Targets is a premium smart overlay that turns raw price action into clear, rule-based trade plans: entry, dynamic guard (SL) and three projected targets (TP1–TP3).
It is designed for XAUUSD, major FX pairs and index CFDs, and works on intraday as well as higher timeframes. What it does Behind the scenes, AI Trend Targets combines: A volatility-adaptive “AI Baseline” to define trend direction Context-aware rejection logi
FREE

USD STRENGHT VERSUS MARKET USD (DXY) Versus Market Panel is a professional visual indicator designed to analyze US Dollar strength and pressure against major trading symbols in real time. The indicator compares USD performance (based on DXY logic or internal strength calculation) versus selected symbols, allowing traders to quickly identify dominant currency flow, relative strength, and market bias from a single panel view. Built with a clean, lightweight, and non-intrusive panel , this tool hel
FREE
Advanced ADX Pro: Поднимите анализ ADX на новый уровень Advanced ADX Pro — это продвинутый торговый инструмент, разработанный для того, чтобы изменить ваш опыт работы с традиционным индикатором Average Directional Index (ADX) . Созданный для обеспечения большего удобства, контроля и визуальной и звуковой ясности , этот индикатор выходит далеко за рамки возможностей встроенного ADX в MetaTrader 5 (MT5). Что такое ADX и почему он важен? ADX — это жизненно важный технический индикатор, который и

Highly configurable Macd indicator.
Features: Highly customizable alert functions (at levels, crosses, direction changes via email, push, sound, popup) Multi timeframe ability Color customization (at levels, crosses, direction changes) Linear interpolation and histogram mode options Works on strategy tester in multi timeframe mode (at weekend without ticks also) Adjustable Levels Parameters:
Macd Timeframe: You can set the lower/higher timeframes for Macd. Macd Bar Shift: you can set the o
FREE

Данный индикатор отображает график крестики-нолики (графики PnF) в окне индикатора. Такие графики показывают только те изменения цены, что больше указанной величины порога (размера клетки). Это позволяет скрыть шум и сконцентрироваться на основных трендах. Время здесь не берется в расчет. Учитывается только движение цены. Вот почему график крестики-нолики не синхронизируются с основным графиком, к которому он прикреплен. Более подробную информацию о графиках крестики-нолики можно узнать в Википе
FREE

Данный индикатор определяет паттерны Sandwich Bars по нескольким диапазонам, весьма надежные паттерны пробоя. Просто и эффективен в использовании Настраиваемые диапазоны баров Настраиваемый выбор цвета В индикаторе предусмотрены визуальные/почтовые/push/звуковые уведомления. Индикатор не перерисовывается и не рисует на истории Паттерн Sandwich состоит из одного бара, поглощающего несколько прошедших баров, пробивая и отклоняя весь ценовой диапазон. Синяя рамка - бычий пробой Красная рамка - медв
FREE
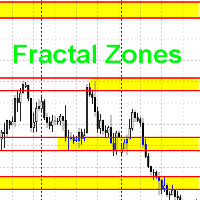
Данный индикатор рисует торговые зоны по фракталам со старших периодов, что упрощает торговлю по уровням.
На одном графике данный индикатор рисует два типа торговых зон. Например если текущий период - H1, то торговые зоны будут искаться по фракталам с H4 и с D1. В стандартных настройках фрактальные зоны с H4 будут рисоваться желтым цветом, а с D1 - зеленым. При наложении зон, происходит смешивание цветов в месте пересечения зон. Как данную вещь поправить, я не знаю в данный момент.
Принцип пои
FREE
https://www.mql5.com/en/users/gedeegi/seller
GEN FXTrendZones GEN FXTrendZones is a technical analysis indicator designed to identify key price zones using Fibonacci retracement and extension levels, while also detecting market structure changes such as Break of Structure (BoS) and Change of Character (CHoCH). The indicator helps traders visualize critical swing areas and potential trend continuation or reversal zones. It includes a visual info panel and optional price alert system.
FREE

Asia Range STDV I ndicator
This Indicator is designed not only to identify the Asia session trading range and Standard Deviation levels but also to assist traders in creating a systematic entry and exit strategy based on the higher timeframe daily trend . The indicator supports both bullish and bearish scenarios, allowing traders to focus on key moments when the Asia range's high or low is "swept" (broken) in line with the confirmed trend. Strategy Overview: 1. Confirming the Daily Trend (Bul
FREE
As the suggested, with this indicator you are able to switch from one symbol or timeframe to another in the same single chart. So forget about opening tons of chart on your screen! It's not designed for ICT or SMC trader, but if you are that kind of trader you still can use it. Imagine you have a strategy containing various indicators and settings, on a single chart you can screen the entry opportunity then move to the next symbol or timeframe.
FREE

Thermo MAP is a multicurrency and multitimeframe indicator that display a smart heat map based on proprietary calculations. Watch how Forex market moved and is currently moving with a single dashboard and have a consistent and good idea of what is happening!
It can be suitable for both scalping or medium/long term, just select options that better fit your trading style Symbols list are automatically sorted based on the preferred column. There is the possibility to click on: First row, timeframe
FREE

Highly configurable CCI indicator. Features: Highly customizable alert functions (at levels, crosses, direction changes via email, push, sound, popup) Multi timeframe ability Color customization (at levels, crosses, direction changes) Linear interpolation and histogram mode options Works on strategy tester in multi timeframe mode (at weekend without ticks also) Adjustable Levels Parameters:
CCI Timeframe: You can set the current or a higher timeframes for CCI . CCI Bar Shift: you can set t
FREE

Нужны тестировщики для нового эксперта, кому интересно пишите на почту 777basil@mail.ru https://backoffice.aurum.foundation/u/DHXP1U
Расчет индикатора основан на изменении цены в истории и рассчитывается математически, пересчитывается каждый раз с новым поступлением данных. Может использоваться на разных таймфреймах. От границ индикатора в 70% происходит изменение направления движения цены, либо консолидация. Таким образом можно торговать, как по тренду, так и в середину канала от его границ.
FREE

HiperCube Market Profile! Код скидки на 20% на Darwinex Zero: DWZ2328770MGM_20 Market Profile — это графическое представление, которое объединяет информацию о цене и времени в виде распределения. Он отображает информацию о цене на вертикальной шкале (ось Y) и информацию об объеме на горизонтальной шкале (ось X). Этот тип диаграммы дает представление о рыночной активности, позволяя трейдерам визуализировать и оценивать справедливую рыночную стоимость в режиме реального времени.
Функции: Пользов
FREE

The traditional Money Flow Index indicator, this time, EA friendly . There are 3 buffers exposed that can be used by EAs to automatically analyze the Overbought and Oversold conditions of the quote. Just use the traditional iCustom() function to get these signals. This Money Flow Index calculation is based on the traditional Metaquote's MFI indicator.
SETTINGS
MFI Period Volume type to analyze (Real Volume or Ticks) Starting Overbought region Starting Oversold region
USING WITH EAs
Buffer #0:
FREE

Индикатор отображает по-барно дельту и кумулятивную дельту на основании данных о сделках ленты "Time & Sales". В дополнение к стандартным таймфреймам индикатор отображает данные относительно секундных таймфреймов (S5, S10, S15, S20, S30) на выбор. С помощью прямоугольника выделяется произвольная область в подокне индикатора для просмотра соотношения объёмов сделок покупок и продаж внутри данной области.
Особенности работы индикатора:
Индикатор работает корректно только на тех торговых символах

Ai Trend Spotter (D Originals).
Падение Форекса.
Мы часто спрашиваем: " Как брокерские компании зарабатывают деньги? ", и отмечаем любые небольшие выигрышные сделки с нашей стороны.
Но после использования (D Originals) вы спросите себя: "Как я стал богатым в одночасье?" .
Настолько глубоко, действие говорит громче, чем голос.
С Ai Trend Spotter не бойтесь:
*Манипулирование рынком *Разворот рынка * Снайперский вход и существование *Прыжок со свечой
Индикатор предназначен для каждой па
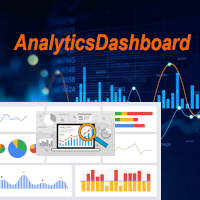
Analytics Dashboard — это индикатор, который анализирует ваши прошлые и текущие сделки и подготавливает аналитическую панель, которую можно просматривать с дополнительными круговыми диаграммами в качестве подробного представления.
В основном рассматриваются четыре категории анализа: 1) Метрики эффективности, 2) Метрики поведения сделок, 3) Метрики качества исполнения и 4) Метрики уровня позиции.
Четыре общие аналитические метрики были далее разбиты на более конкретные метрики, как показано ни
FREE

**Experience Smarter Trading with FVG Super Signal**
Unlock simpler, more decisive trading with **FVG Super Signal**, an advanced MT5 indicator from the WinWiFi Robot Series. This powerful tool uniquely combines the Fair Value Gap (FVG) technique with robust trend-following logic.
* **Clear Signals:** Delivers intuitive Buy/Sell alerts, simplifying your trading decisions. * **Universal Compatibility:** Works seamlessly across all assets and timeframes. * **Highly Versatile:** Ideal for all tr
FREE

Trendy Stock is a price following indicator that uses Stochastic to show when the price is out of the oversold or overbought areas. The algorithm allows you to stay longer in a trend where the bulls or bears are in control. The indicator changes color immediately the price exits oversold/overbought state. In short, the downtrend [red] bars start to paint when the buying pressure decreases while the uptrend [green] bars form as the buy pressure kicks in. For MT4 version, follow :: https://www
FREE
Mean Reversion Probability – Индикатор статистического разворота Краткое описание
Институциональный индикатор, рассчитывающий статистическую вероятность возврата к скользящей средней (МА200) на основе анализа исторических перерасширений. Определяет зоны усталости рынка с количественной точностью. Основные функции
Продвинутая статистика – База из 500+ исторических расширений для расчёта реальных вероятностей
Оценка вероятности (0–99%) – Точное измерение шанса возврата к среднему
Обнаружение уст
Classic ZigZag formula. But no lags and repaints. You can see on screenshots that it shows values between peaks and it is useful to test strategies based on indicator. Because sometimes people find a good idea about it but don't understand that repainting indicators have some things to keep in mind. The parameters are the same as original ZigZag indicator: Depth, Deviation and Backstep. Useful for visual analyze of the chart and cut strategies based on repainting peaks.
FREE
MetaTrader Маркет - уникальная площадка по продаже роботов и технических индикаторов, не имеющая аналогов.
Памятка пользователя MQL5.community расскажет вам и о других возможностях, доступных трейдерам только у нас: копирование торговых сигналов, заказ программ для фрилансеров, автоматические расчеты через платежную систему, аренда вычислительных мощностей в MQL5 Cloud Network.
Вы упускаете торговые возможности:
- Бесплатные приложения для трейдинга
- 8 000+ сигналов для копирования
- Экономические новости для анализа финансовых рынков
Регистрация
Вход
Если у вас нет учетной записи, зарегистрируйтесь
Для авторизации и пользования сайтом MQL5.com необходимо разрешить использование файлов Сookie.
Пожалуйста, включите в вашем браузере данную настройку, иначе вы не сможете авторизоваться.