Смотри обучающее видео по маркету на YouTube
Как купить торгового робота или индикатор
Запусти робота на
виртуальном хостинге
виртуальном хостинге
Протестируй индикатор/робота перед покупкой
Хочешь зарабатывать в Маркете?
Как подать продукт, чтобы его покупали
Технические индикаторы для MetaTrader 5 - 13

his is a custom indicator based on double-average crossing and arrow marking.
Make multiple lists when blue arrows appear up.
Make a blank list when the red arrow appears down.
When the pink line crosses the green line upwards, the pink line is above, the green line is below, the golden fork appears, and the blue arrow appears.
When the pink line crosses down through the green line, the pink line is below, the green line is above, a dead fork appears, and a red arrow appears.
This is a goo
FREE

CurvedSmoothChannel_Enhanced — улучшенный индикатор ценового канала
**CurvedSmoothChannel_Enhanced** — это мощный и визуально привлекательный индикатор ценового канала, разработанный для MetaTrader 5, который помогает вам точно определять тренды, потенциальные развороты и ключевые уровни цен. Эта улучшенная версия объединяет мощь скользящей средней Халла (HMA) и фильтра Super Smooth Джона Элерса, создавая динамичный, адаптивный канал, который подстраивается под рыночные условия на нескольких т
FREE

This indicator was created as an MT5 version inspired by a TMA RSI Divergence indicator found on TradingView.
This indicator detects both Regular and Hidden divergences using RSI pivot points, similar to TradingView's pivot-based divergence logic.
-------------------------------------------------- Features -------------------------------------------------- • Regular Bullish / Bearish divergence • Hidden Bullish / Bearish divergence • Pivot-based detection (Left / Right bars) • Optional RSI SM
FREE
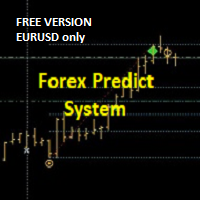
+++++++++++++++++++++++++++++
+++ FREE VERSION - EURUSD ONLY
+++++++++++++++++++++++++++++
Please add PREFIX and/or SUFFIX via settings if your Broker Chart Symbol is different (e.g. suffix = .r).
+++
This is forecast system.
On the moment of the breakout/forecast: the indicator draws retrace zone (yellow) and three targets. The levels act as support and resistance. It can be used on all pairs/indices/timeframes/periods. For the higher timeframes (H4, H1, M30) it's better to engage at Optima
FREE

Индикатор вычисляет профиль объёма и выставляет метки, соответствующие уровням VAL, VAH и POC, для каждой свечи индивидуально.
Особенности работы индикатора Индикатор работает на периодах от M3 до MN, но для вычислений использует исторические данные меньших периодов: M1 - для периодов от M3 до H1, M5 - для периодов от H2 до H12, M30 - для периода D1, H4 - для периода W1, D1 - для периода MN. Цвет и положение меток VAL, VAH и POC на текущей свече считаются корректными только по времени близкому
FREE
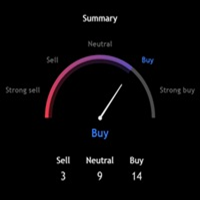
Technical Ratings for MT5 A multi-indicator analysis dashboard that displays aggregated technical signals directly on your MetaTrader 5 charts. This indicator calculates buy, sell, and neutral signals from 11 oscillators, 15 moving averages, and classic pivot points, presenting them in a single organized panel. What It Does Technical Ratings analyzes multiple technical indicators simultaneously and presents their consensus as clear trading signals. Instead of opening dozens of indicator windows

LIQUIDITY SWEEPS INDICATOR - MT5 Advanced Smart Money Concept Tool
OVERVIEW
The Liquidity Sweeps Indicator is a professional-grade MT5 tool designed to identify institutional liquidity grabs and stop-hunt patterns. Based on ICT (Inne
FREE
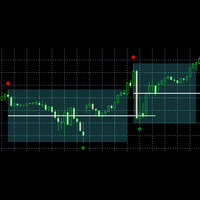
Based on concept of Zones from DTFX.
Video 2
Daves suggest using a length of 25 for optimal performance. But it's up to you to decide based on backtest/forwardtest results.
How this indicator draw zones
In bullish scenario, first it will find a swing high, then a swing low, then a break of with price closed above the swing high. But the way it find swing high and low heavily depends on structure length value. If you set structure length as 12: to find swing high it will check 13th candle high

One of the good and important features in MT4 is the availability of the iExposure indicator. With the iExposure indicator, traders can see a comparison of ongoing open positions and how much funds have been used, and more importantly what is the average value of these open positions.
Unfortunately this indicator is not available on MT5.
This indicator is iExposure MT4 which I rewrote using the MT5 programming language. This indicator can be used like iExposure on MT4 with the same functions.
FREE
Hull Moving Average (HMA) для MT5 – быстрый, плавный, безлаговый трендовый индикатор
Hull Moving Average (HMA) — это высокопроизводительный трендовый индикатор MT5, который обеспечивает сверхплавные и практически безлаговые сигналы. В отличие от SMA, EMA или WMA, HMA мгновенно реагирует на изменение направления рынка, отфильтровывая рыночный шум — идеален для скальперов и внутридневных трейдеров. Основанный на эффективном алгоритме взвешенного скользящего среднего, он использует истинную формул
FREE
ATR Volatility Histogram для MT5 – Технический анализ волатильности Этот индикатор рассчитывает и отображает разницу между быстрым ATR и медленным ATR в виде гистограммы, что позволяет в реальном времени визуализировать изменения рыночной волатильности. Расчёт
Разница волатильности = Быстрый ATR – Медленный ATR Интерпретация Положительные значения (зелёные бары) указывают на рост волатильности и могут подтверждать импульс пробоя. Отрицательные значения (красные бары) указывают на снижение вола
FREE

M & W Pattern Pro is an advanced scanner for M and W patters , it uses extra filters to ensure scanned patterns are profitable.
The indicator can be used with all symbols and time frames.
The indicator is a non repaint indicator with accurate statistics calculations.
To use , simply scan the most profitable pair using the statistics dashboard accuracy , then enter trades on signal arrow and exit at the TP and SL levels.
STATISTICS : Accuracy 1 : This is the percentage of the times price hits TP

The Indicator show Daily Pivot Points. It is possible to specify the number of days to display. For forex it doesn't consider the sunday session data. It is possibile to modify the color, style and width for every level. It is better to use this indicator with timeframe not higher than Н1. 4 Levels of support and resistance with also Intermediate Levels that is possible to hide.
FREE

FVG Smart Zones – Бесплатная версия
Индикатор обнаружения гэпов справедливой стоимости для MetaTrader 5 (MT5) Ищете настоящий торговый инструмент, а не просто очередной случайный индикатор?
FVG Smart Zones – Бесплатная версия дает вам профессиональное понимание рынка, автоматически обнаруживая гэпы справедливой стоимости (FVG) и выделяя зоны с высокой вероятностью торговли прямо на вашем графике. Создано для трейдеров, следующих:
Концепции умных денег (SMC)
Концепции торговли I
FREE
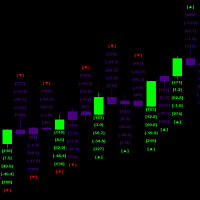
This indicator helps identify the start of significant market movements by analyzing candle patterns and their relative price action strength
the indicator runs multiple simultaneous calculation every millisecond and it also does a triple set verification historically in order to calculate future probabilities the historical processing has to be completed before new Candlestick can be processed as one total set out of the total available history from the starting date and time in order to
FREE

Особенности
Индикатор для проверки объема по цене. В основном работает для EURUSD, на других валютных парах может не работать или расчет займет много времени. Для плавного использования включите опцию "Сдвинуть правую границу графика от правой границы", как показано на скриншоте. При появлении новой бара данные сбрасываются.
Переменные COlOR: Настройка цвета индикатора WIDTH: Настройка ширины индикатора PERIOD: Определение периода времени для расчета данных
FREE

INTRODUCTION TO GPT SPIKES INDICATOR The GPT Spikes Indicator is a revolutionary trading tool specifically engineered for the Boom and Crash markets on the Deriv platform. It leverages cutting-edge algorithms to provide traders with precise market insights, helping them to detect market spikes and reversal points with unparalleled accuracy. Whether you're new to trading or an experienced professional, the GPT Spikes Indicator offers the precision and customization you need to succeed in the vola
FREE

DESCRIPTION:
-----------
KS Dynamic Trendlines is an advanced indicator that automatically detects swing points
and draws intelligent trendlines that adapt to market conditions in real-time.
KEY FEATURES:
------------
Automatic swing high/low detection
Dynamic trendline generation connecting swing points
Real-time break detection - broken trendlines disappear automatically
Next strongest trendline appears when current one breaks
Multi-timeframe support - detect on H4, display on M15
Parallel t
FREE

Индикатор Period separators производит разделение периодов по выбору пользователя.
Доступные периоды - все таймфреймы терминала, большие и кратные текущему таймфрейму. Если задан некорректный таймфрейм, индикатор исправит пользователя, подобрав корректный. Дополнительный бонус, нестандартные периоды лунных циклов MOON, MOON/2, MOON/4. Рисование разделителей производится индикаторными массивами. Индикатор использует один графический объект для рисования прогресса периода и бара. Графический объе
FREE

Necessary for traders: tools and indicators Waves automatically calculate indicators, channel trend trading Perfect trend-wave automatic calculation channel calculation , MT4 Perfect trend-wave automatic calculation channel calculation , MT5 Local Trading copying Easy And Fast Copy , MT4 Easy And Fast Copy , MT5 Local Trading copying For DEMO Easy And Fast Copy , MT4 DEMO Easy And Fast Copy , MT5 DEMO MACD называется скользящей средней конвергенции и расхождения, которая создается на основе дво
FREE

The Weis Waves RSJ Indicator sums up volumes in each wave. This is how we receive a bar chart of cumulative volumes of alternating waves. Namely the cumulative volume makes the Weis wave charts unique. It allows comparing the relation of the wave sequence characteristics, such as correspondence of the applied force (expressed in the volume) and received result (the price progress).
If you still have questions, please contact me by direct message: https://www.mql5.com/en/users/robsjunqueira/
FREE
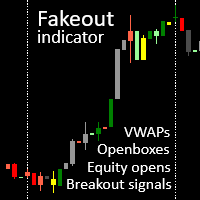
akeout candle indicator with session VWAPs, openboxes and openbox breakout signals. Check out our other products for fxer.net:
https://www.mql5.com/en/market/product/114888
https://www.mql5.com/en/market/product/114890 Main features 1. VWAPS for Tokyo, London and NY sessions 2. Openboxes for Tokyo, London and NY sessions 3. Colored candles for breakouts, fakeouts and inside candles 4. Equity open line 5. Openbox expansions 6. Unmitigated equity open prices for Tokyo, London and NY sessions 7
FREE

Breakout 4-in-1 Package Core Functionality The indicator serves as a "Trend Confirmation Engine." It identifies when the price breaks through a key structural level and then uses secondary oscillators to verify if the move has enough strength to continue. 1. The Breakout Engine (S&R) The foundation of the indicator is identifying Support and Resistance (S&R) . When price closes above resistance or below support, the indicator triggers an alert. Horizontal Levels: Breaks of previous highs/lows or
FREE

Swing Point Volume, the indicator that signals weakness and strength at the tops and bottoms. This indicador can be for used the Wyckoff Method.
Information provided; - Swing on customized ticks. - Volume and points in each balance sheet. - Percentage of Displacement. - Sound alert option on top and bottom breaks. - Volume in ticks and Real Volume. - Volume HL (extreme) or (opening and closing) - Customized volume shapes.

MQL4 has also been converted to MQL5 exposure info for friends using iexposure. It shows the total number of positions that have been opened, how many buy or sell positions there are, the net amount of position numbers and their order prices, the profit and loss status of all total positions. I didn't write their code, it's open source, but I wanted to share it with everyone because it's an indicator I like!
https://www.mql5.com/en/charts/14801856/usdjpy-fix-d1-idealfx-llc
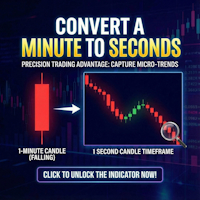
Second Timeframe Pro — Видьте рынок раньше других!
Разблокируйте скрытый уровень ценового действия
Пока другие трейдеры смотрят на минутные свечи — вы уже видите 60 свечей внутри каждой минуты!**
Что такое Second Timeframe Pro ?
Это революционный индикатор, который создаёт полноценные свечные графики с секундными таймфреймами прямо в MetaTrader 5.
Стандартный MT5 ограничивает вас минутным графиком. Но рынок не останавливается каждую минуту — он пульсирует каждую секунду. SecondCharts Pro

Identify Engulfing candle pattern with Arrows & Alert ( built-in RSI filter). This indicator helps you to identify Engulfing candle pattern or Outside bar (OB) on the chart with arrows, along with an alert when a new Engulfing candle appears. Engulfing candle pattern is one of the most important reversal Price Action signals. You can choose between standard Engulfing (Engulfing based on candle body) or non standard Engulfing (Engulfing based on candle high - low )
Alerts can be turned on

3 candel indicator in 1 !!! The 3 most important candel indicator in 1 packadge. Help trader in chart visualisation, prevent reversal !!! Doji : Gravestone Doji, Long Legged Doji, Dragonfly Doji. Engulfing : Bullish, Bearish. Hammer : red hammer, green hammer. Fully parametrable indicator icon color config and alarm. Free life time update !!! Just try our demo for free.

Adjustable Consecutive Fractals looks for 2 or more fractals in one direction and sends out a on screen alert, sound alert and push notification, for strong reversal points .
Adjustable Consecutive Fractals, shows the fractals on chart along with a color changing text for buy and sell signals when one or more fractals appear on one side of price.
Adjustable Consecutive Fractals is based Bill Williams Fractals . The standard Bill Williams fractals are set at a non adjustable 5 bars, BUT withe th

THE PERFECT ENTRY INDICATOR
Enter Trades Like a Pro With the Perfect Entry Indicator!
No More Guesswork. Just Precision. Double-ZigZag + Fractal Confirmation = Only the Strongest Buy & Sell Setups.
Are you tired of false signals, late entries, and endless chart confusion? The Perfect Entry Indicator was built to give traders crystal-clear entry points without hesitation.
SPECIAL BONUS (VALID TILL JUNE 2026)- OUR DAILY SCALPER EA for BTCUSD and VIX75 •···································

Сверхбыстрое распознание параболических каналов ( а также линейных, горизонтальных и волнообразных) на всей глубине истории, создавая иерархию каналов. Необходима настройка: Max bars in chart: Unlimited Данный индикатор предназначен в первую очередь для алгоритмического трейдинга, но можно использовать и для ручной торговли Данный индикатор будет иметь в ближайшем будущем очень активную эволюцию и подробные описания, как применять для создания роботов
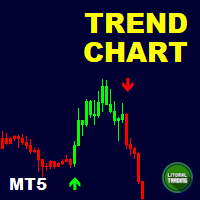
Are you the trend surfing type? Do you like to follow the big sharks? Nope? So you are the type that trades reversion? Awaiting the trend exhaustion and entering on trade?
So this indicator is for you ! With it is extremely easy to identify the trend and when it reverses because the chart is automatically colored according to a defined moving average. You can change it settings and make it your own (or hide it).
In addition it is possible to have indicative arrows on chart and also popup and p

Do you, like me, like to trade with the trend? Then this indicator will help you! Rainbow Trend is a trend indicator, which uses several Moving Averages on the chart.
It measures different trend strenght zones for different periods: very long term, long term, mid term, short term and very short term.
Each zone has its color, and it is possible to have sound alert when the prices leaves a zone and enters another.
Its configuration is very simple. If you find any bug or have any suggestions, conta

Includes almost all the concepts related to Volume Profile: POC , Value Area , Developing POC , Anchored VWAP , Volume Delta ; since the “Total” in its name. It is fast in its calculations and simple to work with.
Features:
1. Selectable calculation timeframe to find most traded levels.
2. Capable of calculating Volume Profile based on tick data
3. Adjustable histogram bars by their count.
4. Adjustable histogram bars by their height (price range).
5. Showing Value Area (VA
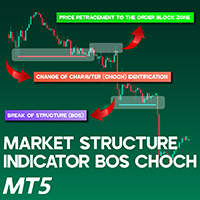
Market Structure Indicator BOS CHOCH MT5 The Market Structure Indicator (BOS-CHOCH) is an ICT-style tool built for MetaTrader 5 (MT5). It identifies both primary and secondary Change of Character (CHOCH) events and Breaks of Structure (BOS) across multiple levels, making it highly valuable for ICT and Smart Money traders. By simplifying the analysis of price behavior, this indicator enhances market structure interpretation and helps traders identify more accurate trading opportunities. Market

Используйте этот индикатор, чтобы получать оповещения о тенденциях, развивающихся на рынке.
Используя этот индикатор, вы сможете получать оповещения о тенденциях, которые развиваются на рынке по мере их развития. Этот индикатор может быть использован для определения входов или выходов в рамках тренда. Индикатор объединяет информацию с более высоких таймфреймов с ценовыми движениями текущего таймфрейма для вывода сигнала на покупку или продажу. Индикатор может определять изменения тренда или пр
FREE
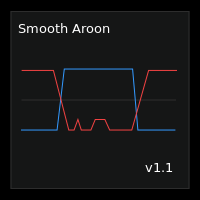
Smooth Aroon is a version of the Aroon Up and Down with smoothing and filtering.
Features :
Smoothing : You have smoothing from 0 to 99 . To smooth a signal, find the maximum value of the points in question then set the smoothing level above the maximum value. For example : If you want to smooth all signals below 30, then you should set the smoothing level above 30 This also smooths all signals above 70, since the Aroon Up and Down Oscillates between 0 and 100. Filtering : If you only w

The GGP SuperTrend MT5 Indicator is a technical analysis tool that can assist investors in identifying market trends. The indicator is based on ATR and is very useful for capturing the direction of an asset’s momentum and is widely employed when looking at stocks, currencies, and commodities. It plots a line on the price chart, which acts as a dynamic level of support or resistance, helping traders and investors make informed decisions about entry and exit points. This indicator is MT5 conversi

TREND HARMONY MT5 – Multi Timeframe Trend and Phase and Pullback Level Visualizer indicator for Metatrader5 The TREND HARMONY indicator automates deep trend analysis and generates visualizations for you. Take control of your trades by eliminating uncertainty! Revolutionize your trading experience with precision and insight through the TREND HARMONY Multi Timeframe indicator – your ultimate MT5 trend visualization indicator. [ Features and Manual | MT4 version | All Products ]
Are you tir

Smart Drawing Assist PRO MT5. Buttons will appears next to the selected object. The buttons are straightforward and amazingly easy to use. Features are as follow: Draw zigzag . Enabling you to draw patterns, draw zigzag, and draw shapes. All you have to do is click the button and start clicking point to point and it will draw automatically. Change object color . Rectangle/Trendline/HLine/Vline/Text/Price Arrow/Arrowed Line/ and your suggestion please. Flatten trendline . make a perfect flat line

Royal Wave is a Trend-Power oscillator which has been programmed to locate and signal low-risk entry and exit zones. Its core algorithm statistically analyzes the market and generates trading signals for overbought, oversold and low volatile areas. By using a well-designed alerting system, this indicator makes it easier to make proper decisions regarding where to enter and where to exit trades. Features Trend-Power Algorithm Low risk Entry Zones and Exit Zones Predictions for Overbought and Over

Индикатор Two Period RSI + Alerts состоит из долгосрочных и краткосрочных линий RSI, между которыми индикатор добавляет заливку для лучшей визуализации. Цвет заливки зависит от того, является ли тренд восходящим (RSI с коротким периодом выше длинной RSI) или нисходящим (RSI с коротким периодом ниже RSI с длинным). Пересечение RSI с коротким периодом длинной RSI дает более сильный сигнал подтверждения тренда по сравнению с использованием RSI с одним периодом. Это инструмент помогает визуализирова

KT Risk Reward shows the risk-reward ratio by comparing the distance between the stop-loss/take-profit level to the entry-level. The risk-reward ratio, also known as the R/R ratio, is a measure that compares the potential trade profit with loss and depicts as a ratio. It assesses the reward (take-profit) of a trade by comparing the risk (stop loss) involved in it. The relationship between the risk-reward values yields another value that determines if it is worth taking a trade or not.
Features

Description The indicator uses market profile theory to show the most relevant trading zones, on a daily basis. The zones to be shown are LVN (low volume nodes) and POC (point of control). An LVN zone is one which represents price areas with the least time or volume throughout the day. Typically, these areas indicate a supply or demand initiative, and in the future, they can turn into important breakout or retracement zones. A POC zone is one which represents price areas with the most time or vo

Setup 9.1 strategy created by the North American trader Larry Williams . SIMPLE setup, effective, with a good level of accuracy and excellent return. Attention : The Demo version only works on the tester, if you are interested in running it in real time, please contact me and I will provide another version. Buy Signal:
Exponential moving average of 9 (MME9) is falling, wait it to TURN UP (in closed candle). Place a buy stop order 1 tick above the HIGH of the candle that caused the turn to occur.
Category: Oscillator Indicator
Platform: MetaTrader 5
Type: Entry Indicator
Timeframes: All
Trader Styles: Scalping, Day Trading, Swing Trading, Binary Options
Markets: All Description The Two-Pole Oscillator is an analytical tool based on deviation calculations and a two-pole smoothing filter. It is designed to highlight momentum conditions and potential trading signals while filtering out short-term noise. Main features: Two-Pole Filtering – Reduces chart noise for smoother oscillator curves.

Auto Order Block with break of structure based on ICT and Smart Money Concepts (SMC)
Futures Break of Structure ( BoS )
Order block ( OB )
Higher time frame Order block / Point of Interest ( POI ) shown on current chart
Fair value Gap ( FVG ) / Imbalance - MTF ( Multi Time Frame )
HH/LL/HL/LH - MTF ( Multi Time Frame )
Choch MTF ( Multi Time Frame )
Volume Imbalance , MTF vIMB
Gap’s Power of 3
Equal High / Low’s

The Volume Weighted Moving Average (VWMA) is calculated based on Prices and their related Volumes giving importance to those candles with more Volume. During periods of almost equal volume distributed along the observed period (commonly, in low volume periods) the VWMA will be graphically similar to a Simple Moving Average. Used along other moving averages a VWMA could be used as an alert, filter or whatever your imagination could think of...
HOW TO "READ" THIS INDICATOR As any Moving Average.
FREE
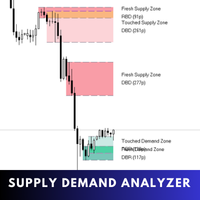
Supply Demand Analyzer is an advanced trading indicator meticulously designed for the precise identification, analysis, and management of supply and demand zones. By integrating real-time data and advanced algorithms, this tool enables traders to recognize market phases, price movements, and structural patterns with unparalleled accuracy. It simplifies complex market dynamics into actionable insights, empowering traders to anticipate market behavior, identify trading opportunities, and make in
VWMA Signal Pro – Многофреймовая панель объемно-взвешенного тренда VWMA Signal Pro — аналитический индикатор, объединяющий объемно-взвешенное скользящее среднее (VWMA) с фильтрами подтверждения тренда и компактной панелью нескольких таймфреймов.
Он помогает трейдерам определять направление тренда и силу импульса, используя объем и волатильность. Индикатор рассчитывает VWMA на разных таймфреймах и показывает сигналы покупки/продажи, подтвержденные фильтрами ADX, ATR и VWAP. Каждый сигнал оценива

Версия MT4 | FAQ Индикатор Owl Smart Levels – это полноценная торговая система внутри одного индикатора, которая включает в себя такие популярные инструменты анализа рынка как усовершенствованные фракталы Билла Вильямса , Valable ZigZag, который строит правильную волновую структуру рынка, а также уровни Фибоначчи, которые отмечают точные уровни входа в рынок и места взятия прибыли. Подробное описание стратегии Инструкция по работе с индикатором Советник-помошник в торговле Owl Helper При

Информационная панель ADR Alert показывает вам, где в настоящее время торгуется цена по отношению к ее нормальному среднему дневному диапазону. Вы будете получать мгновенные оповещения через всплывающие окна, электронную почту или push-уведомления, когда цена превышает свой средний диапазон и уровни выше него по вашему выбору, чтобы вы могли быстро переходить к откатам и разворотам. Черта предназначена для размещения на пустом графике и просто находится в фоновом режиме и предупреждает вас о до
OmniSignal Navigator – Умный скальпинг на ключевых уровнях Торгуйте как профессионал с этим дневным/еженедельным индикатором High-Low-Close, разработанным для скальпинга и точной торговли на пробой.
Почему это работает Идеально подходит для скальпинга: Ориентируется на ключевые зоны (PDH/PDL/PDC и PWH/PWL/PWC) на таймфреймах M2, M3, M5 и M15. (Меньшие таймфреймы = больше сигналов, большие таймфреймы = меньше сигналов) Не требуется анализ графика: просто ждите push-уведомлений (телефо
FREE

Потому что стиль имеет значение
Я знаю, как надоедает каждый раз нажимать свойства, чтобы изменить цвет свечи, фон на светлый или темный, поставить или убрать сетку. Вот решение, которое можно найти одним щелчком мыши: Три настраиваемые кнопки для выбора нужного трейдерам стиля свечи. Одна кнопка для переключения между дневным и ночным режимом. Одна кнопка, чтобы показать или скрыть сетку на графиках. *****В настройках вы можете выбрать, где кнопки должны отображаться на экране*****. Пожалуйс
FREE

Better Period Separators For MetaTrader 5 The built-in period separators feature doesn’t allow users to specify the time period, so you can use this indicator to create more customizable period separators. On intraday charts, you could place period separators at a specific time, you could also place extra period separators at a specific time on Monday to mark the start of a week. On higher timeframe charts, this indicator works the same as the built-in period separators, On the daily chart, per
FREE

Weis Wave Volume Indicator for MetaTrader 5 (MT5) Check all of our products here: All Products Specifications Platform: MetaTrader 5 (MT5)
Type: Custom Technical Trading Indicator
Level: Intermediate
Timeframes: All Timeframes (Multi-Timeframe Support)
Trading Styles: Scalping, Day Trading, Swing Trading, Position Trading
Markets: Forex, Stocks, Commodities, Indices, and Cryptocurrencies What Does This Indicator Do? The Weis Wave Volume Indicator for MT5 is a powerful Price Action + V
High-precision Buy/Sell flip signal indicator designed for FlipX Markets on Weltrade and Volatility pairs on Deriv. FlipToxin was coded specifically for the 5-minute (M5) chart, but also works on higher timeframes with caution. On Boom, Crash, PainX, and GainX, the 15-minute chart is suggested, especially in trending markets. Scalping Mindset Reminder
This indicator is designed for quick, precise entries and exits — perfect for traders who aim for fast, smaller profits that add up over time t

"Разве все мы не хотели бы достоверно знать, когда начинается тренд, а когда на рынке флэт? Не хотели бы получить индикатор, который смог бы подсказать, какие движения нужно игнорировать, чтобы мы смогли сосредоточиться на действительно значимом движении?" Choppiness Index — ненаправленный индикатор, предназначенный для определения состояния рынка - является ли он изменчивым (движущимся в боковом направлении) или не изменчивым (движущимся в тренде в определенном направлении). Это индикатор со зн

# SamuraiFX Combined Pro V14 **Master Market Turns with Real-Time Volume & Structure**
Stop guessing where the market will turn. The **SamuraiFX Combined Pro** is a comprehensive trading system that combines **Daily Structure**, **Volume Flow**, and **Price Action** into a single, non-repainting dashboard. It helps you identify high-probability Reversals and powerful Breakouts without the lag of traditional indicators.
### **Key Advantages**
* **No Lag, No Repaint:** Signals are generated in

If you heard about The Wyckoff Method, Volume Spread Analysis, etc... You are probably searching for the candlestick indicator that shows you the Volume spread all over the current bar, signaling every types of market status... You can control the several Market Levels with custom colors...
It is up to you to decide how to use it. Our job is provide you with the indicator...
If you like this indicator, all I am asking is a little Review (not a Comment, but a REVIEW! )... This will mean A LO
FREE

Trend Regularity Adaptive Moving Average Indicator for MT5
TRAMA Indicator for MT5 Overview
The Trend Regularity Adaptive Moving Average (TRAMA) is an intelligent adaptive moving average that dynamically adjusts its sensitivity based on market structure and trend consistency. Unlike standard moving averages, TRAMA reacts to how frequently new highs or lows are formed within a defined period, providing an adaptive balance between trend-following precision and range stability. How It Works
TRAM
The Higher timeframe candle tracker is used to get a glimpse of what the selected higher time frame candle is like. It plot the candle after the current price. It can come in handy for day traders and short term traders that often worry about how the current higher timeframe candle may look like. You can select the higher time frame or lower time frame from the options provided: By default the color for bears is red and for bulls is green. You are able to change the width of the candle, its wick
FREE
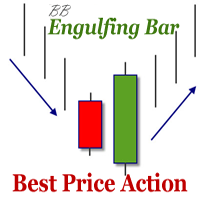
The indicator defines the Bullish and Bearish Engulfing Bar. The pattern has greater reliability when the open price of the engulfing candle is well above the close of the first candle, and when the close of the engulfing candle is well below the open of the first candle. For an engulfing bar to be valid it must fully engulf at least one previous bar or candle - includes all the body and the wick. The engulfing bar can engulf more than one bar as long as it completely engulfs the previous bar.
FREE
If you love this indicator, please leave a positive rating and comment, it will be a source of motivation to help me create more products <3 How to use Gann High-Low Activator? The Gann HiLo Activator helps the trader identify the current trend of the market. When the indicator is below the closing price, it can indicate that an uptrend is taking place. Conversely, when the indicator is above the closing price, it can indicate a downtrend. The Gann HiLo Activator also generates buy and sell sig
FREE

Deep Momentum Analyzer - это индикатор определения тренда на основе искусственного интеллекта, который визуализирует рыночный импульс через интуитивное гистограммное отображение, помогая трейдерам точно и четко определять бычьи и медвежьи рыночные условия. Обзор Deep Momentum Analyzer преобразует сложные рыночные данные в четкие, практичные торговые сигналы с использованием передовых аналитических алгоритмов. Этот профессиональный индикатор дает трейдерам мгновенную визуальную обратную связь о и
FREE

Amiguinho's Bar Counter is a price action indicator to display the bar count (candles) with some interesting options.
About the "Period of analysis" parameter: if the current timeframe is in minutes, then the analysis period will be considered in days; if the current timeframe is in days, then the analysis period will be considered in months; or if the period of analysis will be considered in years.
FREE

This indicator visually highlights the Asian, London, and New York trading sessions on your chart using colored rectangles. It automatically calculates and displays the high, low, and price range (in pips) of each session for the most recent day. The session ranges are drawn for a configurable lookback period, allowing you to review session price action over multiple previous days. Key features include: Customizable session start and end times for Asian, London, and New York sessions. Colored se
FREE

Moving Average Trend Alert is a triple MA indicator that helps traders to identify potential market trends based on 3 MAs alignment and crossover.
Moving Average Trend Alert features: Customizable short-term, medium-term, and long-term MAs. Option to filter signals based on a minimum distance between moving averages to avoid premature MAs alignment. Optional Filter of signals with RSI indicator overbought/oversold levels. Optional Filter of signals with ADX indicator. Popup, email, and phone no
FREE

About:
The Nadaraya-Watson Envelope is a sophisticated yet practical technical indicator that helps traders identify overbought and oversold conditions using advanced kernel regression methods. This is the MT5 only Version.
For MT4 Version go here: https://www.mql5.com/en/market/product/158640/
Key Features ATR-Based Bands: Three upper and three lower bands provide graduated overbought/oversold zones Logarithmic Scale Calculation Center Line - bullish (teal) or bearish (red)
What is the Nad
FREE

OrderFlow Vision – Institutional Market Structure Visualizer OrderFlow Vision is a Smart Money Concepts (SMC) indicator designed to automatically detect and display institutional price structure directly on the chart.
It identifies and marks Order Blocks , Fair Value Gaps (FVGs) , Break of Structure (BOS) , and Change of Character (CHOCH) in real time, helping traders understand how price moves in relation to liquidity, imbalances, and structural shifts.The indicator works across all symbols and
FREE
MetaTrader Маркет предлагает каждому разработчику торговых программ простую и удобную площадку для их продажи.
Мы поможем вам с оформлением и подскажем, как подготовить описание продукта для Маркета. Все продаваемые через Маркет программы защищаются дополнительным шифрованием и могут запускаться только на компьютере покупателя. Незаконное копирование исключено.
Вы упускаете торговые возможности:
- Бесплатные приложения для трейдинга
- 8 000+ сигналов для копирования
- Экономические новости для анализа финансовых рынков
Регистрация
Вход
Если у вас нет учетной записи, зарегистрируйтесь
Для авторизации и пользования сайтом MQL5.com необходимо разрешить использование файлов Сookie.
Пожалуйста, включите в вашем браузере данную настройку, иначе вы не сможете авторизоваться.