Смотри обучающее видео по маркету на YouTube
Как купить торгового робота или индикатор
Запусти робота на
виртуальном хостинге
виртуальном хостинге
Протестируй индикатор/робота перед покупкой
Хочешь зарабатывать в Маркете?
Как подать продукт, чтобы его покупали
Технические индикаторы для MetaTrader 5 - 19
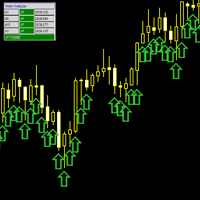
The MultiFrameTrendAnalyzer is a versatile MetaTrader 5 (MT5) indicator designed to provide multi-timeframe trend analysis using Moving Average (MA) crossovers. This indicator synchronizes trend signals across multiple timeframes (M1, M5, M15, M30, H1, H4, D1, W1, MN1) and displays them with intuitive visual cues, including a colored trend line, signal arrows, and a customizable dashboard. Features Multi-Timeframe Analysis : Evaluates trends across up to nine timeframes, allowing traders to conf
FREE
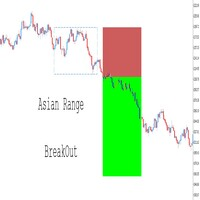
Полностью настраиваемый – Адаптируйте индикатор под свой стиль торговли, изменяя параметры, такие как время диапазона, цвета, стили линий и настройки риск-доходности. Визуализация торговых уровней – Автоматически отображает цену входа, стоп-лосс (SL) и тейк-профит (TP) на основе условий пробоя. Бесшовная интеграция с советниками (EAs) – Возьмите полный контроль над своими автоматическими стратегиями, добавляя дополнительные подтверждения, такие как RSI, скользящие средние, пробой структуры
FREE

MomoPoints — индикатор, который показывает на графике точки входа/дополнения длинных и коротких позиций.
Основываясь на динамике и силе тренда, MomoPoints показывает входы/дополнения с хорошим соотношением риска и прибыли.
Настройки
----------------------------------
Дизайн: цвета, размер и крылья (графический символ) сигнала можно регулировать.
Настройки сигнала: можно установить период скользящей средней, силу тренда, расстояние от скользящей средней до цены и период RSI.
Значения сигнало
FREE

VORTEX OSCILLATOR: Master the Volume Flow VORTEX OSCILLATOR is a high-performance trading tool that reimagines the classic Vortex indicator as an ultra-responsive precision oscillator. Designed for traders who demand absolute clarity, it fuses price action with Tick Volume to reveal the true momentum behind every market move. Why VORTEX OSCILLATOR is a Game Changer Most indicators only track price, often reacting too late. VORTEX OSCILLATOR uses a sophisticated Volume-Weighted Flow algorit

Volumized Breaker Blocks MTF Supreme Volumized Breaker Blocks MTF Supreme is a powerful and user-friendly multi-timeframe (MTF) indicator that automatically detects and visualizes Order Blocks (OB) and Breaker Blocks (BB) on your chart. This advanced tool is designed for both beginners and professional traders who want a clean, fast, and insightful way to identify key market levels with volume context. Key Features Multi-Timeframe Support : Instantly plot OB/BB zones from up to three customizab
FREE

KDJ Indicator for MT5 The KDJ Indicator for MT5 is a professional-grade momentum and trend analysis tool designed to help traders identify trend reversals , overbought/oversold conditions , and entry or exit opportunities with high accuracy. Originally developed as an enhancement of the Stochastic Oscillator , the KDJ adds a powerful J-line that reacts faster to price movement, giving traders earlier warnings of potential reversals. Key Features Three-Line System (K, D, J):
The K and D lines r
FREE

DaySpread MinMax — индикатор спреда с Min/Max за день
Что показывает: Текущий спред (Cur) Минимальный спред за текущий день (Min.day) Максимальный спред за текущий день (Max.day) Принцип работы: Раз в 1 секунду индикатор считывает цены Bid/Ask по текущему символу. Текущий спред считается как (Ask − Bid) / Point (в пунктах). Min.day и Max.day обновляются в течение дня и сбрасываются при смене торгового дня (по D1). Данные выводятся на график в виде компактной текстовой панели. Панель можно перета
FREE
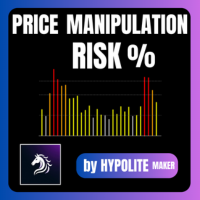
Price Manipulation Risk Indicator Advanced Tool for Market Risk Evaluation & Manipulation Detection Price Manipulation Risk Indicator is a professional tool designed to measure the current risk level in the market.
It evaluates price behavior, market activity, and candle dynamics to detect unstable or potentially manipulated environments. This indicator helps traders avoid traps , filter false signals , and improve timing in both entries and exits. Product Purpose Provide an immediate a

Stochastic RSI производит расчет стохастика на индикаторе RSI. Индекс относительной силы (RSI), разработанный Дж. Уэллсом Уайлдером, является известным импульсным осциллятором, измеряющим скорость и изменение ценового движения.
Особенности Находит ситуации перекупленности и перепроданности. Звуковое оповещение при достижении уровня перекупленности/перепроданности. Получайте уведомления по электронной почте и/или на мобильное устройство при обнаружении сигнала. Индикатор не перерисовывается. Воз
FREE

Нам часто нужно знать внезапное изменение тренда, которое происходит на графике, и это можно подтвердить с помощью индикаторов.
Индикатор показывает моменты разворота тренда и то, как смещается цена.
Пользовательский фон, не нужно настраивать цвета на графике, просто перетащите индикатор!
Индикация стрелками.
- Синяя стрелка: восходящий тренд.
- Розовая стрелка: нисходящий тренд.
ПРИМЕЧАНИЕ. Индикатор бесплатен, ответ службы поддержки может занять некоторое время.
FREE
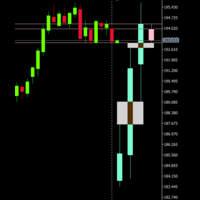
If you like this product, please give it a 5 star rating as a token of appreciation. This indicator projects Higher-Timeframe (HTF) candles onto the current chart and optionally shows their OHLC lines and Fair Value Gaps (FVGs) using ICT 3-candle logic.
Projects multiple higher timeframe candles.
Accurately preserves HTF OHLC on any lower timeframe.
Allows spacing adjustment between projected candles.
Optionally displays OHLC horizontal reference lines.
Automatically detects and draws HTF Fair
FREE

Break Even Line by MMD
The Break Even line is a useful indicator for people using strategies that allow simultaneous trades in both directions, such as the MMD methodology. This indicator is useful when playing statistical models and averaging positions in accumulation and distribution zones. The indicator draws levels by summing positions in three groups: positions included in BUY, positions included in SELL and all positions included.
Functionality description:
Show BUY BELine - shows or
FREE
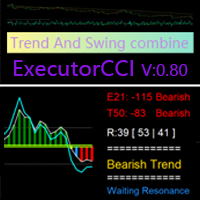
Based on the CCI Trend-Following Principle, Improved to Identify Trend Reversals
This indicator is designed to confirm trends after identifying them using the ( Executor Trend Indicator ) indicator, making it a tool for both trend confirmation and reversal detection. Features Green and Red Histogram: Represents the development of bullish (green) or bearish (red) trends in the current timeframe. Blue Line and Green Histogram (Bullish Confirmation): When the blue line rises above +10
FREE

Данный индикатор определяет внутренние бары нескольких диапазонов, тем самым упрощая обнаружение и принятие мер по пробою внутреннего бара трейдерам, торгующим по ценовому действию. Прост в понимании и использовании Настраиваемый выбор цвета В индикаторе предусмотрены визуальные/почтовые/push/звуковые уведомления. Индикатор не перерисовывается и не рисует на истории Внутренним называется бар (или серия баров), который полностью находится в пределах диапазона предыдущего бара. Синяя рамка - это б
FREE

Индикатор разработан для использования на FORTS, но может работать и на других рынках, у брокеров, транслирующих необходимые данные. Особенность этих данных такова, что они не могут быть запрошены с сервера брокера как участок истории, а могут быть получены только по состоянию на текущий момент. Индикатор периодически запрашивает у брокера, накапливает в файл, и отображает из файла уже исторически следующие данные: Средневзвешенная цена. Объём отложенных ордеров на покупку. Объём отложенных орде
FREE

Developed by Jack Hutson in the 80's, the Triple Exponential Moving Average (a.k.a. TRIX ) is a Momentum technical indicator that shows the percentage of change in a moving average that has been smoothed exponentially 3 times. The smoothing process was put in place in order to filter out price movements that are considered insignificant for the analysis period chosen. We at Minions Labs found hard to follow the smoothness of the original TRIX line, so we colored the TRIX line with BUY and SELL t
FREE

This MT5 indicator provides real-time updates of classic Renko charts. Renko charts focus on price movement, filtering out noise and highlighting trends. What are Renko candles? Renko charts display price movement using "bricks" of equal size, ignoring time. A new brick is drawn only when the price moves by a specified amount. They help visualize trends by removing time-based noise.
Parameters - BrickSizePoints (20): Renko brick size in points - HistoryDepthSec (3600): Historical data to ini
FREE

Harmonic Pattern Suite Pro Introduction Harmonic Pattern Suite Pro is an indicator designed to identify and display harmonic structures on the chart based on X-A-B-C-D sequences. Its purpose is to present pattern formations that meet geometric and proportional criteria, providing a clear visual representation directly on the chart. The indicator automates the detection process, removing the need for manual measurement of ratios and allowing the user to review the structural configuration withou
FREE

This indicator was developed to support multiple timeframe analysis. In the indicator settings, the user can set the color, width, and style of the horizontal lines for each timeframe. This way, when the horizontal lines are inserted into the chart, they will be plotted with the timeframe settings.
MTF Lines also allows visibility control of another objets like rectangles, trend lines and texts.
This is a product developed by Renato Fiche Junior and available to all MetaTrader 4 and 5 users!
FREE

TransitX1 indicator is very useful, with unlimited signals and works on all the timeframes and all the piers. TransitX1 draws two trend lines very short trendlines (+/-20 bars) which can be considered as support and resistance. The support is in red trendline and the resistance is in green trendline. TransitX1 gives buying and selling signals, with only 3 being previous signals and the 4th one being the current signal. Buying signals are in green arrows and are always on the support trendline an
FREE

A very simple indicator, but one that cannot be missed when carrying out your operations.
Fast and accurate Spreed information before entering a trade as well as the time to start another candlestick.
Spread refers to the difference between the buy (purchase) and sell (offer) price of a stock, bond or currency transaction.
Come and see our mql5 signals too. https://www.mql5.com/pt/signals/899841?source=Site +Signals+From+Author
FREE
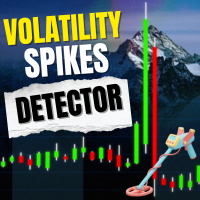
Russian – Полное описание Volatility Monitor – Индикатор Определения Волатильности в Реальном Времени Обзор Volatility Monitor – это лёгкий и профессиональный индикатор MT5, разработанный для отслеживания резких движений цены и оповещения трейдеров в реальном времени. Независимо от того, торгуете ли вы Forex, золотом, парами JPY или криптовалютами, инструмент даёт чёткие сигналы волатильности рынка, используя автоматический режим на основе ATR или ручные пороги в пунктах. Помечая свечи прям
FREE
The Round Level Indicator automatically draws psychologically significant price levels directly on your chart.
These round numbers often act as key support and resistance zones across all markets and timeframes.
Round Levels are used in my automated EA: Opal This indicator works best when combined with other tools and strategies, e.g.: Price Action Strategies
Round levels often align with key support/resistance. Use it with candlestick patterns (like pin bars or engulfing bars) to confirm high
FREE
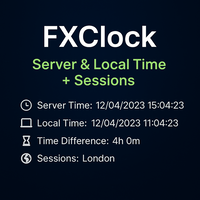
FXClock – Professional Clock Indicator for Traders Important Reminder:
If you find this tool helpful, please support the work by leaving a comment or rating.
Your feedback motivates further development!
The FXClock indicator is a practical and simple tool that displays time directly on your trading platform, allowing you to track multiple key pieces of information at the same time. It is specially designed to help traders synchronize their trading with market hours and global sessions. Key F
FREE
Free Until 1st Jan 2026
VWAR 2.2 (Volume Weighted Average Roadmap) is an advanced institutional-grade MT5 indicator that brings you the most powerful multi-timeframe VWAP (Volume Weighted Average Price) analysis—plus filtered trade signals using robust trend and momentum confirmations. Key Features: Multi-Timeframe VWAP Lines:
Plots Daily, Weekly, and Monthly VWAP levels for instant market structure insight. Dynamic Buy/Sell Signals: Big, bold colored arrows indicate confirmed buy or sell opp
FREE

This indicator calculates fibonacci levels via moving averages trend and draw these lines. You can change fast and slow Moving Averages settings for customization. Inputs:
Fast MA Time Period : 64 Fast MA Shift: 0 Fast MA Method: Smoothed Fast MA Apply To: Median Price Slow MA Time Period: 32 Slow MA Shift: 0 Slow MA Method: Smoothed Slow MA Apply To: Median Price ZigZag: False ZigZag Color: Red ZigZag Type: DashDot ZigZag Width: VeryThin Fibo Settings TrendFibonacci: True FiboTrendColor: Black
FREE

Эта система поможет найти сделки с высокой вероятностью прибыли в направлении сильных трендов. Возможность заработать прибыль появляется с помощью поиска завершения движения в одну сторону.
Важная информация Для максимального использования потенциала сканера прочитайте полное описание (на английском языке): www.mql5.com/en/blogs/post/718109 Информацию об использовании индикатора вы можете прочитать в следующем блоге (на английском языке): Professional Trading With Strong Momentum .
В системе е

INDICATOR: Trend Line GEN INDICATOR: Trend Line GEN Developer: gedeegi General Description Trend Line GEN adalah indikator yang secara otomatis menggambar trendline berdasarkan titik-titik swing penting (highs dan lows) pada chart. Garis-garis ini berfungsi sebagai support dan resistance dinamis untuk membantu pengambilan keputusan trading. Key Features Automatic Swing Detection: Mengidentifikasi pivot high dan pivot low secara otomatis. Flexible Slope Calculation: Pilihan metode perhitungan ke
FREE

super trend version is to help you to have real time view of market move it will help you to get a live view of current market buy signal line and arrow to help you understand batter the direction sell signal line and arrow to help you understand batter the direction trade what you see not what you think this is an simple and best trading tool for our traders of any market crypto gold
FREE

- What does this do?
This indicator draws the standard session boxes used in Steve Mauro's BTMM (Beat the Market Maker) method:
• Asian session boxes
• Brinks boxes: London and New York session changeover boxes
• New York session boxes
• Stop-hunt boxes
- Is this for me?
If you use the BTMM trading system and you are on MetaTrader5, this is for you.
• The one provided by Steve Mauro was for MetaTrader4. This is its first MetaTrader5 adaptation. You cannot find this anyw

FourAverage - новое слово в обнаружении тренда. С развитием информационных технологий и большого количества участников финансовые рынки всё менее поддаются анализу устаревшими индикаторами. Обычные технические средства анализа, такие как Скользящая средняя или Стохастик, в чистом виде не способны определять направления тренда или его разворот. Может ли один индикатор указывать правильное направление будущей цены, не меняя своих параметров, на истории 14 лет? При этом не терять адекватность при б

KT Volume Profile отображает данные о накоплении объема в виде гистограммы по оси Y, позволяя определить торговую активность в определённые периоды времени и на разных ценовых уровнях.
Point of Control (POC) в Volume Profile
POC обозначает ценовой уровень с наибольшим объёмом торгов в пределах всей гистограммы профиля объема. Он часто используется как уровень поддержки/сопротивления или ключевая область, где цена повторно тестируется перед движением в определённом направлении.
Особенности Очен

1. Introduction Smart Volume S/R Pro is a powerful technical analysis tool designed for the MetaTrader 5 platform. Unlike traditional Support & Resistance (S/R) indicators that rely on price peaks and troughs, this indicator automatically identifies critical S/R zones based on a core factor: Trading Volume . Core Principle: Price levels that witnessed exceptionally high trading volume in the past will often become significant psychological zones, where the price is likely to react strongly (eith
FREE
Candle Close Timer Matrix – MT5 Candle Countdown Indicator Candle Close Timer Matrix is a lightweight and powerful MetaTrader 5 (MT5) candle countdown indicator that shows exactly how many minutes and seconds are left before the current candle closes on any symbol and any timeframe. Live Signals & Products Whether you are a scalper , intraday trader or swing trader , knowing the exact candle close time helps you: Time your entries on candle close Avoid impulsive mid-candle decisions Sync your tr
FREE

Ищете мощный индикатор для торговли на рынке Форекс, который поможет вам с легкостью определить прибыльные торговые возможности? Не ищите ничего, кроме Beast Super Signal. Этот простой в использовании индикатор, основанный на тренде, постоянно отслеживает рыночные условия, ищет новые развивающиеся тренды или отслеживает уже существующие. Beast Super Signal дает сигнал на покупку или продажу, когда все внутренние стратегии совпадают и на 100% совпадают друг с другом, что устраняет необходимость

Индикатор синхронизирует восемь видов разметки на нескольких графиках одного торгового инструмента.
Этот индикатор удобно использовать вместе с "Multichart Dashboard" или другим похожим помощником, который позволяет работать сразу с несколькими графиками одновременно.
"Multichart Dashboard" можно найти по ссылке на моём youtube-канале.
Настройки:
включение синхронизации Vertical Line
включение синхронизации Horizontal Line
включение синхронизации Trend Line
включение синхронизации Fi
FREE

Spike Detector Rider – Intelligent Trading in Volatile Markets Introduction
The Spike Detector Rider is an advanced system for MetaTrader 5 designed to detect explosive price movements in high-volatility assets such as synthetic indices and commodities.
It combines volatility filters, trend analysis, and automated risk management to provide intelligent trade confirmations. After purchase, please send me a private message via MQL5 to receive the installation manual and setup instructions. Asset

Индикатор MA Color Candles MA Color Candles — это индикатор для визуального отображения рыночного тренда путем окрашивания свечей на графике. Он не добавляет объектов и не искажает котировки, а изменяет цвет реальных свечей в зависимости от состояния двух скользящих средних. Это позволяет быстро оценить направление цены и использовать индикатор как фильтр в стратегиях. Принцип работы Бычий тренд: быстрая MA выше медленной, медленная MA растёт (зелёные свечи). Медвежий тренд: быстрая MA ниже мед
FREE
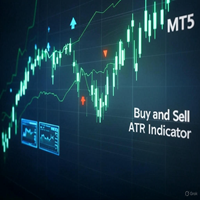
Buy and Sell ATR Indicator The Buy and Sell ATR Indicator is a powerful trend-following tool for MT5, combining ATR-based trend detection with RSI confirmation. It plots a dynamic trend line and generates clear buy (blue arrows) and sell (red arrows) signals when price action confirms a trend over a user-defined number of candles. A unique flat market filter, based on average ATR, prevents signals in low-volatility conditions. Customize ATR periods, RSI levels, signal thresholds, and arrow styl
FREE

This is a simple Orderblock alert indicator. it alerts you once it spots a bullish or bearish OB. what you choose to do with the alert, is left to you. Feel free to test on demo before use. (I'll be working on a combo i.e this and an EA working side by side, anticipate) Bullish OB has a light blue color and bearish has a light red color (rectangle box drawn on chart). Please trade wisely and don't forget to leave a positive review. thanks More blues to you, and Happy Trading!
FREE

Индикатор Alert Arrows RVI — это усовершенствованная версия индикатора относительного индекса силы (RVI), дополненная функциональностью стрелок оповещения. Он способен определять потенциальные уровни поддержки и сопротивления, предоставляя трейдерам ценные знания о динамике рынка. Основные особенности: Стрелки оповещения: Интегрированные стрелки оповещения предлагают визуальные подсказки для потенциальных торговых возможностей. Дополнительные фильтры: Два дополнительных фильтра внедрены для улу
FREE

Nadaraya-Watson Envelope – это индикатор, основанный на непараметрической регрессии, который помогает трейдерам выявлять тренды, уровни поддержки и сопротивления с помощью плавных адаптивных полос. В отличие от традиционных скользящих средних или стандартных отклонений, этот индикатор использует ядерную регрессию Nadaraya-Watson , динамически подстраиваясь к движениям цены, уменьшая запаздывание и сохраняя отзывчивость.
Основные функции: • Адаптивное определение тренда – сглаживает цен
FREE

# DAILY SUPPORT AND RESISTANCE LEVELS - SEO OPTIMIZED DESCRIPTION
## SHORT DESCRIPTION (160 characters max)
```
Free pivot points indicator with daily support resistance levels for MT5. Perfect for intraday forex day trading and scalping strategies.
```
**Character count:** 159
**Keywords included:** pivot points, support, resistance, MT5, forex, day trading, scalping, free
---
## FULL DESCRIPTION (HTML Formatted for MQL5)
### Main Title
**Daily Support and Resistance Levels - Free Pivot
FREE

Индикатор пузырей — Замедление цены + всплеск объёма Простой визуальный инструмент, который показывает цветные квадраты на графике, когда цена внезапно замедляется при всплеске объёма.
(функция заполнения с добавлением концентрических пузырей) Что делает индикатор: Находит моменты, когда рынок «колеблется» перед движением Показывает, где появляется крупный объём без значительного изменения цены Помогает предугадывать возможные пробои Как это работает: Анализирует более мелкие таймфреймы, чем в
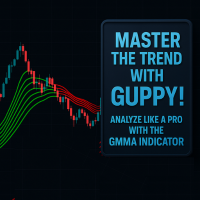
This is a custom Guppy-style Moving Average indicator built for MetaTrader 5 (MT5), designed to replicate the appearance and logic of the popular TradingView version. Unlike the built-in tools in MT5, this indicator offers a simplified yet powerful approach by using only 6 Exponential Moving Averages (EMAs). It provides clean visualization and accurate market layering to help traders make better decisions. Features
TradingView-Style Guppy Logic – Displays 6 EMAs for combined short- and medium-
FREE

TCM Breakeven Calculator Ultra is a professional utility designed to instantly visualize your True Weighted Average Entry Price with the Total Lot Size . Unlike simple averages, this tool mathematically accounts for Lot Sizes , giving you the exact price where your net position reaches zero loss. It automatically scans your terminal and isolates trades based on the chart you are viewing. If you are trading multiple pairs (e.g., EURUSD and Gold) simultaneously, this indicator will onl
FREE

Descripción corta Consensus MTF es un indicador gratuito de alineación multi-timeframe diseñado para mostrar el contexto real del mercado .
No genera señales de entrada ni salida. Su objetivo es ayudar a evitar operar cuando el mercado no está alineado . Descripción completa Consensus MTF analiza la dirección del mercado en varios timeframes simultáneamente, evaluando la posición del precio respecto a su nivel de equilibrio en cada marco temporal. Cada timeframe se clasifica de forma indep
FREE
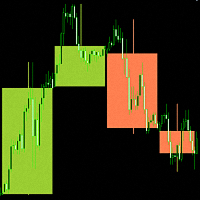
"Candlesticks MTF 5" информационный индикатор, который отображает "Японские свечи" . Индикатор анализирует и определяет время открытия и закрытия свечей из более старших таймфреймов.
Для индикатора "Candlesticks MTF 5" разработан алгоритм, корректирующий несоответствие времени открытия и закрытия свечи с большего таймфрейма. Например, если время открытия свечa на недельном таймфрейме приходится на 1-е число месяца, а на меньшем таймфрейме эта дата приходится на Субботу, то без данного алгоритма
FREE
Range Identifier v3 User Guide 1. Overview The Range Identifier v3 is a technical analysis tool designed to automatically detect and visualize periods of market consolidation, commonly known as ranges. this MQL5 version brings the same powerful logic to the MetaTrader 5 platform. The primary function of this indicator is to draw a channel around recent highs and lows during periods of low volatility. When the price breaks out of this channel, the indicator provides an alert, helping traders iden
FREE

Relative Volume or RVOL is an indicator that averages the volume of X amount of days, making it easy to compare sessions volumes.
The histogram only has 3 colors:
Green - Above average volume
Yellow - Average volume
Red - Below average volume
The default setting is 20 days, which corresponds more or less to a month of trading.
In this version is possible to choose between tick and real volumes (if you are using a broker which offers future contracts)
With the data obtained from this in
FREE
A Smart Price Imbalance Tool with Arrows, Labels, and FVG Zones The Fair Value Gap (FVG) Indicator is designed to automatically detect price imbalance zones on the chart – a widely used concept in Smart Money Concepts (SMC) and Institutional Trading Models (ICT) . These gaps, also known as imbalances or inefficiencies , often highlight areas where price may return to "rebalance" liquidity. Many professional traders consider these levels as high-probability zones for potential reversals, retrace

Fibomathe Indicator: Support and Resistance Tool for MT5 The Fibomathe Indicator is a technical analysis tool designed for MetaTrader 5 (MT5) that assists traders in identifying support and resistance levels, take-profit zones, and additional price projection areas. It is suitable for traders who use structured approaches to analyze price action and manage trades. Key Features Support and Resistance Levels:
Allows users to define and adjust support and resistance levels directly on the chart.
FREE

Индикатор разворота ADR сразу показывает, где в настоящее время торгуется цена относительно своего нормального среднего дневного диапазона. Вы будете получать мгновенные оповещения через всплывающие окна, электронную почту или push-уведомления, когда цена превышает свой средний диапазон и уровни выше него по вашему выбору, чтобы вы могли быстро переходить к откатам и разворотам. Индикатор рисует на графике горизонтальные линии на экстремумах среднего дневного диапазона, а также расширения выше
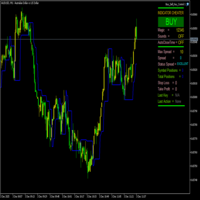
FractalBreakoutLevels — индикатор динамических уровней, построенных на основе анализа ценовых движений. Индикатор использует комбинацию исторических ценовых данных для определения ключевых уровней, которые могут служить ориентирами при торговле. Общее описание работы: Индикатор анализирует структуру рынка, выявляя значимые ценовые уровни на основе соотношения текущих и исторических ценовых данных. Он строит непрерывную линию, которая адаптируется к изменяющимся рыночным условиям, выполняя функ
FREE

https://www.mql5.com/en/users/gedeegi/seller GEN (Trend Line) automatically detects swing highs and lows, plots dynamic upper & lower trendlines with adaptive slope (ATR, Standard Deviation, or Linear Regression approximation), and marks breakout points visually when the price crosses the trend boundaries. Perfect for price action, breakout, and trend confirmation strategies across multiple timeframes.
FREE

Индикатор паттернов Ганна Advanced Gann Pattern - навсегда изменит вашу торговлю Откройте для себя секретную торговую систему с вероятностью выигрыша 70-95%, о которой профессиональные трейдеры не хотят, чтобы вы знали! Устали от индикаторов, которые перерисовываются, дают ложные сигналы или сбивают с толку относительно того, когда входить и выходить из сделки? Индикатор Advanced Gann Pattern изменит все. Созданный на основе легендарной теории паттерна Pattern-123 У. Д. Ганна — той же систем

AstroCycles: Advanced Financial Astronomy Indicator Overview AstroCycles is a sophisticated technical analysis tool developed for the MetaTrader 5 (MQL5) platform. It bridges the gap between orbital mechanics and financial market analysis by calculating precise astronomical cycles and visualizing them directly on your trading chart. Unlike standard indicators that rely on past price data, AstroMaster utilizes high-precision astronomical algorithms (Keplerian Elements and Brown’s Lunar Theory)
FREE

Rainbow Volume Profile A simple, lightweight volume profile indicator that visualizes price-range volume with color-coded POCs (Points of Control). Overview RainbowVolumeProfile04Simple.mq5 calculates and displays a price–by–volume (Volume Profile) over a user-specified number of bars. The indicator automatically detects the top 5 volume concentration levels (POCs) and draws a colorful horizontal histogram at the right side of the chart. The computation is lightweight and updates in real time. K
FREE

Volume Weighted Average Price (VWAP) is a trading benchmark commonly used by Big Players that gives the average price a Symbol has traded throughout the day. It is based on both Volume and price. Additionally we put in this indicator the MVWAP (Moving Volume Weighted Average Price). For those who do not know the usage and the importance od this indicator I recommend a great article about this subject at Investopedia ( https://www.investopedia.com/articles/trading/11/trading-with-vwap-mvwap.asp
FREE

Introduction
The PF Maximizer is a game-changing non-repainting technical tool engineered to help traders distinguish genuine trend signals from erratic market fluctuations. By employing sophisticated algorithms and cutting-edge data analysis, this indicator efficiently filters out unwanted noise, empowering traders to identify the precise starting and ending points of substantial market moves.
Signal
Potential buy signal is generated when moving average is going up and the blue line cross a
FREE

A pin bar pattern consists of one price bar, typically a candlestick price bar, which represents a sharp reversal and rejection of price. The pin bar reversal as it is sometimes called, is defined by a long tail, the tail is also referred to as a “shadow” or “wick”. The area between the open and close of the pin bar is called its “real body”, and pin bars generally have small real bodies in comparison to their long tails.
The tail of the pin bar shows the area of price that was rejected, and t
FREE

Зоны поддержки и сопротивления на основе объема Volume-based Support and Resistance Zones — это мощный и гибкий индикатор для MetaTrader 5, который помогает трейдерам определять ключевые уровни рынка, формирующиеся из объемных всплесков на фрактальных максимумах и минимумах. Инструмент автоматически строит зоны поддержки и сопротивления в местах, где цена с высокой вероятностью отреагирует, помогая вам торговать с большей уверенностью и ясностью.
Основные особенности Логика на основе объема : з
FREE

BUY INDICATOR AND GET EA FOR FREE AS A BONUS + SOME OTHER GIFTS! ITALO TRIANGLE INDICATOR is the best triangle indicator ever created, and why is that? Using Geometry and Fibonacci the Indicator works on all time-frames and assets, indicator built after 7 years of experience on forex and many other markets. You know many triangle indicators around the internet are not complete, does not help, and it's difficult to trade, but the Italo Triangle Indicator is different , the Italo Triangle Indi

Этот индикатор основан на знаменитом фрактальном индикаторе, но с большим количеством настроек и гибкости.
это мощный инструмент для выявления разворотов тренда и максимизации потенциальной прибыли.
Благодаря расширенным функциям и удобному интерфейсу это идеальный выбор для трейдеров всех уровней. Версия MT4: Ultimate Fractals MT4 Функции :
Настраиваемое количество фрактальных свечей. Разворотные линии. Настраиваемые настройки. Удобный интерфейс. Основные параметры: Candles On Left - коли
FREE
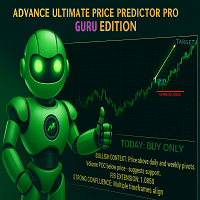
THE ADVANCE PRICE PREDICTOR - GURU EDITION Tired of Guesswork?
Meet the AI-Powered "Almighty Predictor" – Pinpoints High-Probability Targets Before the Move, With Surgical Precision
Stop chasing pips. Start attracting them. Our proprietary algorithm fuses Multi-Timeframe Analysis + Smart Money Concepts + Real-Time Confluence Scoring to give you a clear, calculated edge on every trade.
Are You Constantly Wondering…
"Is this the top, or will it keep going?"
"Where should I real
FREE

Setup Tabajara was created by a Brazilian trader known as "The OGRO of Wall Street" .
The idea of this setup is to indicate to the trader the current trend of prices and the type of operation should be looked for in the graph.
Operation
It does this through the relation of the closing price position and the of 20 periods, by painting the candles in 4 possible colors : Green -> Price rising in upward trend (Search entry points for PURCHASE) Black -> Price correcting in Bullish Trend (Sear
FREE

Session Range Lite — это бесплатный индикатор для MetaTrader 5 (MT5) , предназначенный для автоматического построения диапазона Азиатской торговой сессии (Asian Session High / Low) . Индикатор отображает максимум и минимум азиатской сессии непосредственно на графике, помогая трейдеру быстро определить ключевые уровни дня , которые часто используются для торговли пробоев, ретестов и внутридневного анализа. Основные функции: Автоматическое определение High и Low азиатской сессии Визуальное выделен
FREE

Market Heartbeat is in your hand! *** Contact me to send you " Trend Finder indicator " free and add you in "Market Heartbeats group" for sharing or seeing experiences with other users. Introduction The Market Heartbeat indicator with a special enhanced algorithm (volume, money flow, cycle of market and a secret value) is a very repetitive trend finder with a high success rate . Interestingly, this Winner indicator indicates that the trend has changed its direction or the end of a tre

Профессиональный мульти-таймфреймовый скальпинг-индикатор с мобильными уведомлениями в реальном времени, умными зонами покупки/продажи и ежедневной статистикой сигналов. Разработан для дейтрейдеров и скальперов, которым нужна точность. Обзор Этот индикатор создан для дейтрейдеров и скальперов , ценящих точность, скорость и ясность. Он объединяет мульти-таймфреймовый анализ с интеллектуальной фильтрацией сигналов, предоставляя торговые возможности с высокой вероятностью успеха. С уведомлениями в

Volumatic Fair Value Gaps is a precision-engineered indicator for identifying, analyzing, and visualizing Fair Value Gaps (FVGs) backed by volume intelligence. This tool goes beyond standard FVG plotting by dissecting volume dynamics inside each gap using lower-timeframe sampling , offering clear insight into whether bulls or bears dominate the imbalance. Designed for technical traders, this indicator overlays high-probability gaps only, visualizes bullish vs. bearish volume composition , and pr
MetaTrader Маркет - лучшее место для продажи торговых роботов и технических индикаторов.
Вам необходимо только написать востребованную программу для платформы MetaTrader, красиво оформить и добавить хорошее описание. Мы поможем вам опубликовать продукт в сервисе Маркет, где его могут купить миллионы пользователей MetaTrader. Так что занимайтесь только непосредственно своим делом - пишите программы для автотрейдинга.
Вы упускаете торговые возможности:
- Бесплатные приложения для трейдинга
- 8 000+ сигналов для копирования
- Экономические новости для анализа финансовых рынков
Регистрация
Вход
Если у вас нет учетной записи, зарегистрируйтесь
Для авторизации и пользования сайтом MQL5.com необходимо разрешить использование файлов Сookie.
Пожалуйста, включите в вашем браузере данную настройку, иначе вы не сможете авторизоваться.