Смотри обучающее видео по маркету на YouTube
Как купить торгового робота или индикатор
Запусти робота на
виртуальном хостинге
виртуальном хостинге
Протестируй индикатор/робота перед покупкой
Хочешь зарабатывать в Маркете?
Как подать продукт, чтобы его покупали
Технические индикаторы для MetaTrader 5 - 16

The Entry IQ Indicator is a technical analysis tool designed to assist traders in identifying potential entry points for long and short positions. It utilizes dynamic price boxes, equilibrium zones, and trend detection algorithms to analyze market trends and price movements. The indicator adapts to different broker price digit formats, provides customizable arrow signals, and plots real-time trendlines to refine signal accuracy. By assessing price action over a specific lookback period, Entry I
FREE

Используя вдохновение от Приватного Курса Менторства ICT 2016 года (месяц 05), размещенного на YouTube, наш инновационный инструмент дает трейдерам возможность навигации по рынкам с точностью. Помечая периоды в 60, 40 и 20 дней, он помогает выявлять значимые движения на рынке, опираясь на мудрость, внушенную ICT. То, что действительно отличает этот индикатор, - его способность к прогнозированию, функция, предлагающая бесценные идеи о поведении будущего рынка на основе тщательного анализа историч
FREE

This is the famous Sunflower indicator for Metatrader5. This indicator marks possible tops and bottoms on price charts. The indicator identifies tops and bottoms in the asset's price history, keep in mind that the current sunflower of the last candle repaints, as it is not possible to identify a top until the market reverses and it is also not possible to identify a bottom without the market stop falling and start rising. If you are looking for a professional programmer for Metatrader5, please
FREE

Добро пожаловать в RSI Colored Candles, инновационный индикатор, разработанный для улучшения вашего опыта торговли путем интеграции индекса относительной силы (RSI) непосредственно на вашем графике цен. В отличие от традиционных индикаторов RSI, RSI Colored Candles использует четырехцветную схему, чтобы представить уровни RSI непосредственно на ваших свечах, обеспечивая вам ценные инсайты на первый взгляд. Особенности и преимущества: Экономия места: Попрощайтесь с перегруженными окнами индикатор
FREE

Show Pip Value and Spread on Chart as Object or Comment. User can select to display Pip Value and/or Spread by object on main Chart, or show both only as Comment lines on chart. Object Color, Font face and Size and also which corner to show, may change by user. Pip Value calculated in accordance of input Lot size , Default is 1 lot . Can use at all currency pairs , Gold , Silver and most other charts.
FREE

Индикатор анализирует график и определяет японские свечи "Доджи". Показывает их появление и сигнализирует о появлении такой свечи (если разрешено в параметрах). Также, этот индикатор показывает силу разворота в виде столбиков разного цвета (чем больше зелёного цвета, тем вероятнее рост, чем больше красного - падение цены). Направление сигнала зависит от направления предыдущих свечей, так как "Доджи" сигнализирует о развороте или коррекции. В настройках индикатора можно изменять параметры свечи
FREE

Индикатор дивергенции 10 разных индикаторов. Поиск и отображение классических и скрытых дивергенций. Индикаторы, в которых производится поиск дивергенций: MACD; MACD Histogram; RSI; Stochastic; CCI; Momentum; OBV; VWmacd; Chaikin Money Flow; Money Flow Index. Это реплика индикатора с ресурса tradingview , адаптированная под терминал MT5. MT4-версия доступна здесь: https://www.mql5.com/en/market/product/87846 Настройки: Bars in history for analysis - количество баров для анализа; Divergence Ty

This MT5 indicator provides real-time updates of classic Renko charts. Renko charts focus on price movement, filtering out noise and highlighting trends. What are Renko candles? Renko charts display price movement using "bricks" of equal size, ignoring time. A new brick is drawn only when the price moves by a specified amount. They help visualize trends by removing time-based noise.
Parameters - BrickSizePoints (20): Renko brick size in points - HistoryDepthSec (3600): Historical data to ini
FREE

Anchored VWAP (AVWAP) для MT5 Легко добавляйте несколько линий Anchored VWAP на один график с точными датами и временем привязки. Разработан для трейдеров, которым нужен быстрый, ясный и гибкий анализ ключевых уровней цен. Основные возможности: Привязывайте несколько VWAP к одному графику Устанавливайте индивидуальную дату и время начала для каждой линии Интуитивно понятный и удобный интерфейс Идеально для внутридневной и среднесрочной торговли Анализируйте тренды, выявляйте динамическую поддерж
FREE

A heatmap is a graphical representation of data in two dimensions, using colors to display different factors. Heatmaps are a helpful visual aid for viewers, enabling the quick dissemination of statistical or data-driven information. The MP Heatmap indicator provides a graphical representation of the relative strengths of major currencies compared to others, organizing data from pairs into color-coded results and producing a clear overview of the entire Forex market. The MP Heatmap indicator dis
FREE

Multi Currency Strength Dashboard Mini (БЕСПЛАТНО) – Индикатор силы валют для MetaTrader 5 Multi Currency Strength Dashboard Mini — это бесплатный индикатор для MetaTrader 5 , который в реальном времени показывает относительную силу 8 основных валют (USD, EUR, GBP, JPY, CHF, CAD, AUD, NZD) в виде понятной панели (dashboard). Цель: за секунды находить сильные и слабые валюты, чтобы проще формировать список наблюдения и выбирать пары по логике сильная против слабой . Основные возможности (версия M
FREE

Stop Loss Pro – Precision Risk Management for Every Trader
Stop Loss Pro is a powerful, free MetaTrader indicator designed to take the guesswork out of risk management. Built on advanced market structure analysis, it automatically identifies and displays the most reliable stop‑loss levels directly on your chart. With this tool, traders can protect their trades with confidence, knowing that each suggested level is backed by a blend of technical logic, volume dynamics, and volatility filters. Ho
FREE

Осциллятор Эллиотта - Инструмент анализа импульса, который обнаруживает разворот тренда через паттерны схождения скользящих средних. Индикатор отображает синие гистограммы для бычьего импульса и красные гистограммы для медвежьих условий, автоматически строя линии тренда между значимыми пиками и впадинами. Система Оповещений : Выберите между двумя режимами - Оповещения Текущего Бара (alertsOnCurrent = true) срабатывают немедленно на развивающихся барах, но могут перерисовываться, в то время как П
FREE
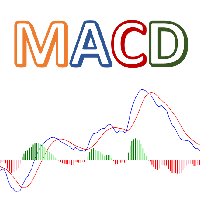
Colorful MACD is MT5 version of TradingView default MACD. This indicator has 4 different colors for MACD histogram, so it's so easy to detect fluctuations in histogram. Features: Colorful Histogram Bars Show/Hide Signal Line Show/Hide MACD Line Flexible price control Please call me if you need more input parameters or modified version of this indicator.
FREE

Линия Koala Trend обновлена до версии 1.2
Улучшение последнего обновления: добавлен новый параметр, который позволяет пользователю подключать линию тренда ко 2-й, 3-й или X-й самой высокой или самой низкой точке.
Мой запрос :
** Уважаемые клиенты, пожалуйста, опубликуйте свой отзыв о Koala Trend Line, и позвольте мне улучшить ваши отзывы.
ПОЧЕМУ KOALA TREND LINE ЯВЛЯЕТСЯ БЕСПЛАТНЫМ ИНДИКАТОРОМ?
Я считаю, что бесплатный индикатор должен быть квалифицированным инструментом.
А что насчет ДРУГИ
FREE

Triangle Pattern Gann v3.1 - Complete Feature Documentation Core Functionality OverviewTriangle Pattern Gann v3.1 is a sophisticated MetaTrader 5 indicator that combines W.D. Gann's geometric trading principles with advanced triangle pattern recognition to deliver actionable trading signals. Primary Features1. Triangle Pattern Detection SystemAscending Triangle Recognition
Function: Automatically identifies bullish continuation patterns Detection Criteria:
Flat horizontal resistance line
FREE

The idea of a Value Chart indicator was presented in the very good book I read back in 2020 , " Dynamic Trading Indicators: Winning with Value Charts and Price Action Profile ", from the authors Mark Helweg and David Stendahl. The idea is simple and the result is pure genius: Present candlestick Price analysis in a detrended way!
HOW TO READ THIS INDICATOR
Look for Overbought and Oversold levels. Of course, you will need to test the settings a lot to find the "correct" one for your approach. It
FREE

Volatility Trend System - торговая система дающая сигналы для входов.
Система волатильности дает линейные и точечные сигналы в направлении тренда, а также сигналы выхода из него, без перерисовки и запаздываний.
Трендовый индикатор следит за направлением среднесрочной тенденции, показывает направление и ее изменение.
Сигнальный индикатор основан на изменении волатильности, показывает входы в рынок.
Индикатор снабжен несколькими типами оповещений.
Может применяться к различным торговым инструмен

Market Structure Highs and Lows Overview:
Market Structure Highs and Lows is a professional indicator that automatically detects and visualizes key price structure points — Higher Highs (HH), Higher Lows (HL), Lower Highs (LH), and Lower Lows (LL). It helps traders clearly see trend direction, reversals, and market flow through a clean ZigZag structure. How it works:
The indicator analyzes swing points using a ZigZag algorithm to define structural highs and lows. Uptrend: Sequence of HH and H
FREE

Necessary for traders: tools and indicators Waves automatically calculate indicators, channel trend trading Perfect trend-wave automatic calculation channel calculation , MT4 Perfect trend-wave automatic calculation channel calculation , MT5 Local Trading copying Easy And Fast Copy , MT4 Easy And Fast Copy , MT5 Local Trading copying For DEMO Easy And Fast Copy , MT4 DEMO Easy And Fast Copy , MT5 DEMO «Кооператив QQ: 556024» "Сотрудничество WeChat: 556024" «Совместная электронная почта: 55602
FREE

Multi-period Parallel Random Oscillator 1. Main chart cycle main line and signal line 2. 15M 30M 1H fixed cycle signal line Mainly used to observe the overbought and oversold conditions of other cycles in the same chart。 Its main function is to identify moments of multi-cycle resonance, enabling you to better grasp opportunities for buying and selling points.
FREE

Simple ATR (Average True Range) Channel to find your Stop Loss and/or Take Profit. Indicator allows to draw a second multiplier if you need different values for SL and TP. Leave the second multiplier to 0 if not used.
Settings + Length
+ Smoothing
+ Multiplier #1 (default 1.5)
+ Multiplier #2 (set to 0 if not used)
+ High price
+ Low price
+ show price line
+ colors can be changed
Please leave wishes in the comments. Reviews are also welcome.
FREE

Using the Stochastic Oscillator with a Moving Average is a simple but very efficient strategy to predict a trend reversal or continuation.
The indicator automatically merges both indicators into one. It also gives you visual and sound alerts.
It is ready to be used with our programmable EA, Sandbox, which you can find below: Our programmable EA: https://www.mql5.com/en/market/product/76714 Enjoy the indicator!
This is a free indicator, but it took hours to develop. If you want to pay me a coff
FREE

After working during many months, with the help of Neural Networks, we have perfected the ultimate tool you are going to need for identifying key price levels (Supports and Resistances) and Supply and Demand zones. Perfectly suitable to trigger your trades, set up your future actions, decide your Take Profit and Stop Loss levels, and confirm the market direction. Price will always move between those levels, bouncing or breaking; from one zone to another, all the remaining movements are just mark

VolumeBasedColorsBars — Free Powerful Volume Analysis for All Traders
Unlock the hidden story behind every price bar! VolumeBasedColorsBars is a professional-grade, 100% FREE indicator that colorizes your chart candles based on real, adaptive volume analysis. Instantly spot surges in market activity, identify exhaustion, and catch the moves that matter.
This indicator gives you: • Dynamic color-coded bars for instant volume context • Adaptive thresholds based on historical, session-awar
FREE
ATR Volatility Histogram для MT5 – Технический анализ волатильности Этот индикатор рассчитывает и отображает разницу между быстрым ATR и медленным ATR в виде гистограммы, что позволяет в реальном времени визуализировать изменения рыночной волатильности. Расчёт
Разница волатильности = Быстрый ATR – Медленный ATR Интерпретация Положительные значения (зелёные бары) указывают на рост волатильности и могут подтверждать импульс пробоя. Отрицательные значения (красные бары) указывают на снижение вола
FREE

This is the Volume Avarage Weighted Price (VWAP) it's a indicator that shows where is the avarage of the current volumes and the levels at which the price is considered premium, above the second upper band, or discount, under the second lower band, it's also very usefull to use the VWAP level as a target for operations since it's a very liquid level so the price it's attracted to it. feel free to leave a feedback either positive or negative based on your expereince with this indicator, enjoy the
FREE

Product Name: Harmonic Confluence Indicator (Basic Edition) !!!—-Leave a 5-star review and receive a free indicator version with trade levels (limited to the first 20 people only)——!!! Headline: Automated Harmonic Pattern Scanner with Supply & Demand Confluence. Description: Unlock the power of geometric market structure with the Harmonic Confluence Indicator (Basic Edition) . This powerful tool is designed to automatically scan your charts for high-probability reversal zones based on validated
FREE

RSI Advanced - Повысьте Уровень Анализа и Высокопотенциальные Торговые Сигналы Обзор RSI Advanced - это мощный пользовательский индикатор для MetaTrader 5, разработанный для повышения уровня вашего технического анализа и предоставления надежных торговых сигналов. Этот индикатор интегрирует стандартный Индекс Относительной Силы (RSI) с сложной системой Скользящих Средних (MA) и Полос Боллинджера (BB), применяемых непосредственно к данным RSI. Более того, он включает возможности продвинутого обнар
FREE

Aggression Volume Indicator is the kind of indicator that is rarely found in the MQL5 community because it is not based on the standard Volume data provided by the Metatrader 5 platform. It requires the scrutiny of all traffic Ticks requested on the platform... That said, Aggression Volume indicator requests all Tick Data from your Broker and processes it to build a very special version of a Volume Indicator, where Buyers and Sellers aggressions are plotted in a form of Histogram. Additionally,
FREE

Introduction This indicator detects volume spread patterns for buy and sell opportunity. The patterns include demand and supply patterns. You might use each pattern for trading. However, these patterns are best used to detect the demand zone (=accumulation area) and supply zone (=distribution area). Demand pattern indicates generally potential buying opportunity. Supply pattern indicates generally potential selling opportunity. These are the underlying patterns rather than direct price action. T
FREE
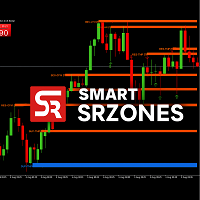
SmartSRZones is an MT5 indicator designed to automatically detect, display, and manage support and resistance zones directly on the chart.
It combines market structure recognition with candlestick pattern detection to help traders view important price levels without manual marking. The indicator is suitable for different trading approaches, including short-term and long-term analysis. Key Features Automatic Zone Detection Identifies support and resistance areas based on swing points, volume, an
FREE

This indicator is designed to help traders to help them Synchronize objects across all charts that have the same pair/currency.
Applicable objects: -Rectangle
-Trendlines
-Trendlines by Angle
-Horizontal Lines
-Vertical Lines
-Arrow Lines
-Channels
- Text boxes
Known Issues : - Visualization is not copied to the other charts. - If indicator is only placed in one chart, other charts with the same pair/currency will have difficulty deleting the objects if there is no "Sync Objects In Charts" in
FREE

This indicator finds Three Drives patterns. The Three Drives pattern is a 6-point reversal pattern characterised by a series of higher highs or lower lows that complete at a 127% or 161.8% Fibonacci extension. It signals that the market is exhausted and a reversal can happen. [ Installation Guide | Update Guide | Troubleshooting | FAQ | All Products ] Customizable pattern sizes
Customizable colors and sizes
Customizable breakout periods Customizable 1-2-3 and 0-A-B ratios
It implements visual/s
FREE

This indicator shows colored candles when price are strongly distorted in relation to their averages.
A good time for buy can be seen after the closing of a silver candle. The pattern becomes more reliable if the purchase is opened when the price of the candle after the silver candle is above the maximum price of the silver candle.
A good time for sell can be seen after the closing of a pink candle. The pattern becomes more reliable if the sale is opened when the price of the candle after
FREE

Индикатор является мультитаймфреймовой версией индикатора Supply and Demand . Он позволяет анализировать график, используя закон спроса и предложения на трех разных таймфреймах одновременно. Вы сможете увидеть, в каких ценовых зонах происходили покупки и продажи, и определить наиболее выгодные места для открытия позиций. В качестве основы индикатора используется принцип фрактальности рынка. Зоны на графике отображают места, где наличие сильного покупателя либо продавца заставило цену развернут
FREE
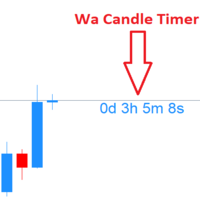
Wa Candle Timer MT5 показывает живой обратный отсчёт до закрытия текущей свечи прямо на основном графике. По мере приближения конца бара таймер меняет цвет (по умолчанию — когда прошло ~95% длительности свечи, т.е. осталось ~5% времени).
Индикатор лёгкий, наглядный и подходит трейдерам, синхронизирующим входы/выходы по закрытию свечи. Ключевые возможности Реальный обратный отсчёт до закрытия бара для любого инструмента и тайм-фрейма. Смена цвета, когда свеча почти завершилась (порог по умолчанию
FREE

Trend Fuzzy Analyzer Назначение и концепция
Индикатор Trend Fuzzy Analyzer оценивает силу и направление текущего рыночного тренда. В его основе лежит принцип нечёткой логики (Fuzzy Logic) , который позволяет переводить количественные показатели нескольких технических индикаторов в качественную оценку силы тренда. В отличие от бинарных сигналов, индикатор выводит итоговое значение в виде уровня уверенности (от 0 до 100%). Основной принцип работы Индикатор параллельно анализирует входные данн
FREE

Professioneller Indikator für Prozentuale Niveaus
Präzisionsgefertigte prozentuale Niveaus auf Basis der Perioden-Eröffnungspreise Dieses professionelle Trading-Tool zeichnet automatisch symmetrische prozentuale Niveaus ab dem Eröffnungspreis von Tages-, Wochen- oder Monatsperioden und bietet Tradern klare Referenzzonen für Intraday- und Swing-Trading-Strategien . Hinweis: Im Rahmen unserer Erstveröffentlichung wird dieser Indikator für die ersten 100 Nutzer kostenlos zur Verfügung gestellt ode
FREE

IQ FX Gann Levels a precision trading indicator based on W.D. Gann’s square root methods . It plots real-time, non-repainting support and resistance levels to help traders confidently spot intraday and scalping opportunities with high accuracy. William Delbert Gann (W.D. Gann) was an exceptional market analyst, whose trading technique was based on a complex blend of mathematics, geometry, astrology, and ancient mathematics which proved to be extremely accurate. Setup & Guide:
Download MT4 Ver

Product Name: Adaptive Session Trend MT5 Adaptive Session Trend MT5 is a session-based trend identification indicator for MetaTrader 5. It incorporates internal logic to detect the trading instrument and automatically synchronize with the broker's server time to filter signals based on the London and New York trading sessions. The indicator is designed to provide trend direction data during periods of peak market liquidity. It automatically adjusts its internal calculation parameters based on w
FREE

[ZhiBiDW Trend] - это простой, интуитивно понятный и эффективный индикатор трендов и шоков. Он подходит для периодов графика более 15 минут и менее 4 часов, подходит для всех разновидностей рынка.
Сигнал на покупку: появляется синяя стрелка вверх, появляется стрелка с предустановленной ценой для Stop Loss и Take Profit.
Сигнал на продажу: появляется красная стрелка вниз, появляется стрелка с предустановленной ценой для Stop Loss и Take Profit.
Описание настройки параметров:
[Send_Alert]: это
FREE
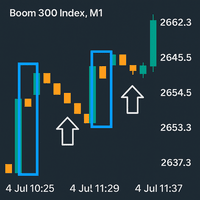
boom Spike Mitigation Zone Pro
A professional spike pattern indicator built for synthetic traders who scalp and swing Boom 500/300/1000/600/900with precision.
This indicator: Detects powerful 3-candle spike formations (Spike → Pullback → Spike) Automatically draws a clean box around the pattern Marks the entry price from the middle candle Extends a horizontal mitigation line to guide perfect sniper entries Automatically deletes & redraws the line once price touches it (mitiga
FREE

About:
The Nadaraya-Watson Envelope is a sophisticated yet practical technical indicator that helps traders identify overbought and oversold conditions using advanced kernel regression methods. This is the MT5 only Version.
For MT4 Version go here: https://www.mql5.com/en/market/product/158640/
Key Features ATR-Based Bands: Three upper and three lower bands provide graduated overbought/oversold zones Logarithmic Scale Calculation Center Line - bullish (teal) or bearish (red)
What is the Nad
FREE

Это пользовательский индикатор, основанный на ценовом действии свечей. Он генерирует оповещения о сигналах покупки или продажи по любому торговому инструменту. Доступны пояснительные материалы по проверке сигналов, методам входа и выхода. Чтобы узнать больше, найдите пояснительные видеоролики по запросу Benjc Trade Advisor на YouTube.
Последняя версия включает фильтры трендов и осцилляторов для повышения точности сигналов. Цена продукта увеличена для неограниченного использования и аренды.
Бу
FREE

Повысьте точность своей торговли с индикатором WH Trading Sessions MT5 для MetaTrader 5! Этот мощный инструмент поможет вам визуализировать и управлять ключевыми рыночными сессиями без особых усилий. Основанный на на: Индикатор WH SMC MT5
Версия MT4: WH Trading Sessions MT4
Основные характеристики: Интерактивная панель графического интерфейса пользователя — легкий выбор и переключение между торговыми сессиями Азии, Лондона и Нью-Йорка .
Настраиваемые оповещения и настройки
FREE

Этот индикатор может отправлять предупреждения, когда происходит изменение цвета Heiken Ashi Smoothed. В сочетании с вашими собственными правилами и методами этот индикатор позволит вам создать (или улучшить) вашу собственную мощную систему. Функции Может отправлять все типы предупреждений. Возможность отложить оповещение на один или несколько баров, чтобы подтвердить изменение цвета (тренда). Входные параметры Сдвиг свечи для предупреждения: по умолчанию 1. Установка значения 0 будет предупрежд
FREE

The " YK Find Support And Resistance " indicator is a technical analysis tool used to identify key support and resistance levels on a price chart. Its features and functions are as follows:
1. Displays support and resistance levels using arrow lines and colored bands, with resistance in red and support in green.
2. Can be adjusted to calculate and display results from a specified timeframe using the forced_tf variable. If set to 0, it will use the current timeframe of the chart.
3. Uses th
FREE

VOLUMIZED ORDER BLOCKS [Riz] - MT5 Indicator Smart Money Order Block Detection with Volume Analysis
Volumized Order Blocks is an advanced Smart Money Concepts (SMC) indicator that automatically detects institutional order blocks with integrated volume analysis. It identifies high-probability supply and demand zones where banks and institutions
FREE

Adaptive Hull MA Pro – Trend & Momentum Filter
We value your feedback and believe that your experience with the Hull Moving Average (HMA) is essential to us and other traders. Help us continue to improve and refine our product by sharing your thoughts and insights through a review!
The Hull Moving Average (HMA) Indicator – Your Key to Smoother Trends and Profitable Trades! Are you tired of lagging and choppy moving averages that hinder your ability to spot profitable trading opportunities? Loo
FREE
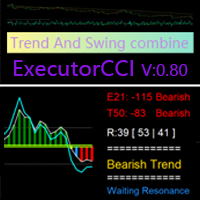
Based on the CCI Trend-Following Principle, Improved to Identify Trend Reversals
This indicator is designed to confirm trends after identifying them using the ( Executor Trend Indicator ) indicator, making it a tool for both trend confirmation and reversal detection. Features Green and Red Histogram: Represents the development of bullish (green) or bearish (red) trends in the current timeframe. Blue Line and Green Histogram (Bullish Confirmation): When the blue line rises above +10
FREE

GEN Sessions Volume Profile Developer: Gede Egi GEN Sessions Volume Profile is an MT5 indicator designed to display the volume distribution for each trading session (daily) in the form of a Volume Profile . With this tool, traders can easily see at which price levels the highest trading activity has occurred during a session, making it easier to identify key market areas. The indicator automatically plots Session Boxes, Point of Control (POC), Value Area High (VAH), Value Area Low (VAL), and Va
FREE

Utazima 001 Indicator AI Professional Market Structure & Opening Range System STOP GUESSING. START TRADING WITH STRUCTURE. Utazima 001 Indicator AI is a next-generation Market Structure & Opening Range Intelligence System , built for traders who want clarity, precision, and consistency . This is not a repainting signal tool.
This is institutional-grade logic , simplified and automated for retail traders. Designed by Utazima MentorCreate , this indicator reveals the most important price zo
FREE

This is one of the most popular and highly rated volatility index (VIX) indicators on the market. It provides the same readings as the VIX does for stock indexes. However, this indicator works across all asset classes. VIX Fix Finds Market Bottoms. This indicator is not for inexperienced traders. Use it for day and swing trading. MT4 Version - https://www.mql5.com/en/market/product/112238 Join To Learn Market Depth - https://www.mql5.com/en/channels/suvashishfx
Bernard Baruch summe
FREE

Hello
I Want to introduce The Forex Buy Sell Arrow Premium MT5
i recently release this premium indicator!
its 1000% Non Repaint Indicator,
It Work Perfectly Well,, i tested it day by day, Just mind blowing Result,
Including Powerful trend Algorithm!
How It Work?
well, it work market trend formula, when trend Bullish Or when trend Bearish,
Recommend Timeframe M30, H1 it work all timeframe, and all currency pair,
100% non repaint,
How to take signal From Forex Buy Sell Arrow Premium Ind

1. Overview The Scalping PullBack Signal indicator is a powerful technical analysis tool designed to help traders identify scalping opportunities based on potential pullback and reversal signals. This tool is particularly useful on lower timeframes (below 15 minutes) but can also be applied on higher timeframes for longer-term trades. This indicator integrates several key analytical components, providing a comprehensive view of trends and potential entry/exit points, helping you make quick and e
FREE

The SMC ICT Indicator integrates the key concepts of Smart Money Concepts and Inner Circle Trader into a practical and precise tool.
It displays essential levels and patterns on the chart for clear analysis according to the ICT approach.
Optimized for agile processing, it allows smooth backtesting with no repainting, freezes, or delays—ensuring precision and efficiency in your trading.
Included Concepts It includes Fair Value Gap (FVG), Order Blocks, Imbalance, Gap, Equal High and Equal Low, a

Premium Trend Entry Pro
TZ Trade Logics, представляет вам улучшенную версию входа в тренд Premium
Этот выпуск принесет вам гораздо более расслабленное состояние торговли с расширенными функциями для фильтрации тренда и временем входа премиального сигнала.
Для нас важно не создание продукта! но продолжали обслуживание и обучение пользователей. Благодаря нашим специальным средствам связи с нами вы получите подробное руководство по использованию продукта и другие соответствующие тренинги, связа
FREE

The Top and Bottom Identifier Pro is the essential tool for traders who use technical analysis and price action as the basis for their decisions. In MetaTrader 5, understanding market structure—whether the price is making higher or lower highs and lower lows—is the first step to success. This indicator automates this process, eliminating subjectivity and allowing you to visualize price inflection points with immediate clarity.
FREE

Представляем VFI (Volume Flow Indicator) – индикатор для торговли, который анализирует соотношение объема и движения цены для выявления ключевых торговых возможностей. Индикатор отображает силу и направление потока объемов, предоставляя четкие сигналы о потенциальных точках входа и выхода. Сигналы формируются на основе пересечения нулевой линии, пересечения линии VFI и ее экспоненциальной скользящей средней (EMA), а также при выходе индикатора из зон перекупленности и перепроданности.
Внимание!
FREE
OmniSignal Navigator – Умный скальпинг на ключевых уровнях Торгуйте как профессионал с этим дневным/еженедельным индикатором High-Low-Close, разработанным для скальпинга и точной торговли на пробой.
Почему это работает Идеально подходит для скальпинга: Ориентируется на ключевые зоны (PDH/PDL/PDC и PWH/PWL/PWC) на таймфреймах M2, M3, M5 и M15. (Меньшие таймфреймы = больше сигналов, большие таймфреймы = меньше сигналов) Не требуется анализ графика: просто ждите push-уведомлений (телефо
FREE

тренд, откат, трендовый индикатор, волатильность, atr, скользящая средняя, ema, импульс, осциллятор, поток ордеров, дельта, торговля по тренду, скальпинг, дейтрейдинг
Что делает
Определяет основной тренд с помощью скользящих средних.
Строит динамические зоны отката на основе волатильности.
Показывает направленный поток цены (покупательское или продавцовское давление).
Помогает читать рыночный контекст для более точных сделок.
Как я использую этот индикатор на практике:
Когда цена торгуе

Индикатор Ichimoku Kinko Hyo, предназначенный для торговли по тренду, успешно используется практически на всех рынках. Данный индикатор уникален во многих отношениях, однако его главное преимущество заключается в предоставлении трейдерам множества ориентиров, позволяющих составить более глубокое и полное представление о движении цены. Эта глубина анализа и исключительная наглядность индикатора позволяет трейдерам быстро увидеть торговые возможности и выделить среди них наиболее перспективные. Пр
FREE
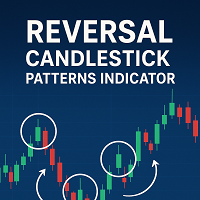
Reversal Candlestick Patterns Indicator — Free Version This MT5 indicator identifies common bullish and bearish candlestick reversal patterns and displays them directly on the chart.
It can be used on any market and timeframe, providing traders with clear visual references for potential reversal points. Main Features Automatic detection of well-known candlestick reversal patterns Works on all available MT5 timeframes Can be applied to Forex, Stocks, Commodities, Indices, and Cryptocurrency char
FREE

Этот индикатор отображает только верхнюю и нижнюю полосы волатильностного канала в стиле Боллинджера, не отображая центральную скользящую среднюю. Его основная цель — предоставить чистый и гибкий волатильностный конверт, позволяя трейдерам сосредоточиться на поведении цены относительно границ канала, сохраняя при этом полный контроль над визуальным оформлением графика. В отличие от традиционных полос Боллинджера, где средняя скользящая всегда отображается, данный индикатор использует скользящую
FREE

Imagine VWAP, MVWAP and MIDAS in one place... Well, you found it! Now you can track the movement of Big Players in various ways, as they in general pursue the benchmarks related to this measuring, gauging if they had good execution or poor execution on their orders. Traders and analysts use the VWAP to eliminate the noise that occurs throughout the day, so they can measure what prices buyers and sellers are really trading. VWAP gives traders insight into how a stock trades for that day and deter
FREE

Данный индикатор формирует канал на основе показаний индикатора ADX (Average Directional Movement Index), отображает и сообщает трейдеру разворот цены на границах этого канала, а также, может сообщать, когда цена касается границ канала. Рисует и дополнительные пунктирные линии, которые зависят от показаний +DI и -DI индикатора ADX. Имеет также опцию для фильтрации сигналов в зависимости от показаний стохастика. Канал, рисуемый данным индикатором, получается немного похож на Envelopes или Bollin
FREE
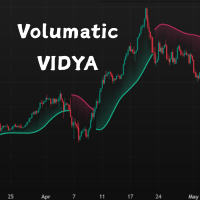
This is a custom VIDYA-based trend-following indicator for MetaTrader 5 (MT5), enhanced with ATR-band logic to adapt to market volatility. It provides dynamic trend zones and intelligent direction switching to support better trading decisions.
Unlike traditional moving averages, this indicator uses a momentum-adjusted VIDYA (Variable Index Dynamic Average) and combines it with ATR-based bands to detect trend shifts with greater precision. Features
Volatility-Adaptive Trend Logic – Uses ATR ban
FREE

Overview: The US Dollar Index (DXY) is a key financial indicator that measures the strength of the US Dollar against a basket of six major world currencies. This index is crucial for traders and investors as it provides a comprehensive view of the overall market sentiment towards the US Dollar and its relative performance. All Products | Contact Composition: The DXY's composition is as follows: Euro (EUR): 57.6% Japanese Yen (JPY): 13.6% British Pound (GBP): 11.9% Canadian Dollar (CAD): 9.1%
FREE
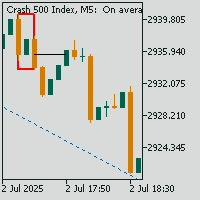
Crash Spike Mitigation Zone Pro
A professional spike pattern indicator built for synthetic traders who scalp and swing Crash 500/300/1000 with precision.
This indicator: Detects powerful 3-candle spike formations (Spike → Pullback → Spike) Automatically draws a clean box around the pattern Marks the entry price from the middle candle Extends a horizontal mitigation line to guide perfect sniper entries Automatically deletes & redraws the line once price touches it (mitigation)
FREE
MetaTrader Маркет - лучшее место для продажи торговых роботов и технических индикаторов.
Вам необходимо только написать востребованную программу для платформы MetaTrader, красиво оформить и добавить хорошее описание. Мы поможем вам опубликовать продукт в сервисе Маркет, где его могут купить миллионы пользователей MetaTrader. Так что занимайтесь только непосредственно своим делом - пишите программы для автотрейдинга.
Вы упускаете торговые возможности:
- Бесплатные приложения для трейдинга
- 8 000+ сигналов для копирования
- Экономические новости для анализа финансовых рынков
Регистрация
Вход
Если у вас нет учетной записи, зарегистрируйтесь
Для авторизации и пользования сайтом MQL5.com необходимо разрешить использование файлов Сookie.
Пожалуйста, включите в вашем браузере данную настройку, иначе вы не сможете авторизоваться.