Смотри обучающее видео по маркету на YouTube
Как купить торгового робота или индикатор
Запусти робота на
виртуальном хостинге
виртуальном хостинге
Протестируй индикатор/робота перед покупкой
Хочешь зарабатывать в Маркете?
Как подать продукт, чтобы его покупали
Технические индикаторы для MetaTrader 5 - 24

Индикатор VR ATR Pro – это мощный профессиональный инструмент для определения целевых уровней на финансовом инструменте. Эффективность индикатора доказана тысячами тестов на реальных и демонстрационных счетах. VR ATR Pro индикатор, работающий на реальных данных с использованием живой настоящей статистики. Статистика вещь упрямая, использование реальных статистических данных в математических подсчетах позволяет рассчитать точные целевые уровни для финансового инструмента. Больше профессиональных

AP VWAP Bands Pro (MT5) Volume-weighted average price with ±σ bands for clear intraday bias, mean-reversion zones, and dynamic support/resistance. Works on crypto (incl. BTC) , FX , indices , and metals . Uses tick-volume when real volume isn’t available. What it shows VWAP line (volume-weighted mean price). Two envelopes around VWAP (default ±1σ and ±2σ) to highlight balance vs. extension. Reset modes : Day , Week , or Anchor Time (HH:MM) to start VWAP where you need it (e.g., exchange open).
FREE

Основными функциями индикатора являются определение и маркировка на гистограмме индикатора Accelerator Oscillator торговых сигналов, описанных Биллом Вильямсом в книге "Новые измерения в биржевой торговле". А именно: Сигнал на покупку при расположении гистограммы индикатора ниже линии нуля. Сигнал на продажу при расположении гистограммы индикатора ниже линии нуля. Сигнал на продажу при расположении гистограммы индикатора выше линии нуля. Сигнал на покупку при расположении гистограммы индикатора
FREE

Megatron Shark Indicator – MT5 Harmonic Pattern Detection Tool The Megatron Shark Indicator is a MetaTrader 5 tool for detecting and displaying Shark harmonic patterns directly on the chart. It automatically identifies bullish and bearish Shark formations, calculates entry, stop-loss, and take-profit levels, and provides real-time alerts. This allows traders to quickly integrate harmonic pattern analysis into their trading process without manual drawing. Advantages * Automatic Pattern Detection
FREE
Будьте на шаг впереди рыночного импульса с помощью Pip Movement Alert MT5 — универсального мультивалютного индикатора, предназначенного для отслеживания и оповещения трейдеров о точных движениях в пунктах по нескольким символам, идеально подходящего для торговли на рынках форекс, акций, криптовалют и сырьевых товаров. Высоко ценится в торговых сообществах, таких как Forex Factory и Reddit’s r/Forex, и отмечен в обсуждениях на Investopedia и TradingView за способность выявлять внезапные рыночные
FREE
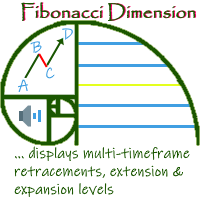
'Fibonacci Dimension' indicator allows display of preset or user-defined multi-timeframe Fibonacci levels. It automatically takes the previous high and low for two user-defined timeframes and calculates their Fibonacci retracement levels. It also considers the retraced level to draw the expansions on every change of price. A complete visual dimension in multiple timeframes allows deriving profitable strategies for execution. Enhanced functionality to view and customize the default Fibonacci Rang
FREE

HiperCube Market Profile! Код скидки на 20% на Darwinex Zero: DWZ2328770MGM_20 Market Profile — это графическое представление, которое объединяет информацию о цене и времени в виде распределения. Он отображает информацию о цене на вертикальной шкале (ось Y) и информацию об объеме на горизонтальной шкале (ось X). Этот тип диаграммы дает представление о рыночной активности, позволяя трейдерам визуализировать и оценивать справедливую рыночную стоимость в режиме реального времени.
Функции: Пользов
FREE

VR Sync Charts это утилита для синхронизации разметки между окнами. ИНДИКАТОР НЕ РАБОТАЕТ В ТЕСТЕРЕ СТРАТЕГИЙ!!! Как получить триал версию с тестовым периодом, инструкции, обучение читайте в блоге https://www.mql5.com/ru/blogs/post/726504 . С помощью VR Sync Charts Ваши трендовые урони, горизонтальные уровни, разметка Фибоначчи будут синхронизированы со всеми графиками. Утилита позволяет синхронизировать все стандартные графические объекты в терминале MetaTrader, все Ваши тренды, линии Ганна, и

Do you find it difficult to track and manage your open positions across multiple different symbols in MetaTrader 5? Do you need a quick and comprehensive overview of your current market exposure and the performance of each symbol individually? The "Dynamic Exposure Table" indicator is your ideal tool! This indicator displays a clear and detailed table in a separate window below the chart, summarizing all your open positions and intelligently grouping them by symbol, giving you a complete view of
FREE

VWAP для скальперов
Осведомленные об этапе линии VWAP для быстрых, точных скальпов. ️ Параметры (MT4/MT5) Enable_Hourly_VWAP: Включить почасовой VWAP. Enable_Asia_VWAP: Включить VWAP сеанса Азии. Enable_Europe_VWAP: Включить VWAP сеанса Европы. Enable_NA_VWAP: Включить VWAP сеанса Северной Америки. Enable_Extended_VWAP: Включить расширенный VWAP сеанса. Enable_Daily_VWAP: Включить дневной VWAP. Сеанс Азии (GMT) Session_Asia_Start_Hour: Время начала сеанса Азии. Session_Asia_End_Hour: Время око
FREE

Keltner-Enhanced улучшает точность и читаемость каналов Кельтнера, предоставляя множество опций для их настройки и более пяти расчетов цены, чем META по умолчанию.
Индикатор Keltner-E - это полосовой индикатор, подобный полосам Боллинджера и конвертам скользящих средних. Они состоят из верхнего конверта над средней линией и нижнего конверта под средней линией.
Основными событиями, на которые следует обратить внимание при использовании каналов Кельтнера, являются прорывы выше верхнего конверт
FREE

MSX Hybrid Heiken Scalper v1.00 Elevate Your Scalping Precision with a Next-Generation Non-Repaint Heiken Ashi Indicator The MSX Hybrid Heiken Scalper is a scientifically designed, non-repainting Heiken Ashi indicator optimized for M5 to H1 scalping on MetaTrader 5. It introduces a robust closed-bar smoothing method that preserves trend clarity while filtering minor price noise — all without using traditional EMA/WMA/HMA smoothing that causes repainting. Reliable Closed Candle Logic
Each can
FREE

Highly configurable Macd indicator.
Features: Highly customizable alert functions (at levels, crosses, direction changes via email, push, sound, popup) Multi timeframe ability Color customization (at levels, crosses, direction changes) Linear interpolation and histogram mode options Works on strategy tester in multi timeframe mode (at weekend without ticks also) Adjustable Levels Parameters:
Macd Timeframe: You can set the lower/higher timeframes for Macd. Macd Bar Shift: you can set the o
FREE

Когда вы работаете с несколькими активами и имеете несколько открытых позиций по активам, немного сложно визуализировать, когда прибыль или прибыль дает каждая активная проблема, поэтому с учетом этого мы разрабатываем этот индикатор, где он облегчает визуализацию операций с активами. , где вы сможете открыть несколько разных ресурсов и сможете визуализировать индивидуальный результат каждого актива и ускорить принятие решений в своем бизнесе.
FREE

It is the very same classic Stochastic indicator, but with a little twist: we changed the Signal Line with a 2-color line, so we can use it with EAs as a filtering system. And that's it! I know it could seem stupid but I needed that, so I created it. The original formula is right from Metaquote's chest, no additions, no subtractions, it is Stochastics in its core.
So I will not publish here the Stochastics parameters as they are all the same as always... Enjoy!
If you like this indicator, all I
FREE

Вы когда-нибудь задумывались о наличии сканера, который анализирует все стратегии и показывает точки покупки и продажи для всех таймфреймов этого актива одновременно? Вот что именно делает этот сканер. Он предназначен для отображения сигналов покупки и продажи, которые вы создали в Rule Plotter: создатель стратегий без программирования , и их запуска внутри этого сканера на различных активах и различных таймфреймах. Стратегия Rule Plotter по умолчанию представляет собой только восходящие и нисхо
FREE

Добро пожаловать в новую эпоху торговли с индикатором AI Moving Average, передовым индикатором MetaTrader 5, разработанным для предоставления трейдерам предсказательной информации о движениях рынка. Этот инструмент сочетает в себе мощь ИИ с надежностью экспоненциального скользящего среднего без запаздывания для точных и своевременных прогнозов будущих ценовых тенденций. Инновационная модель линейной регрессии Индикатор AI Moving Average использует модель машинного обучения линейной регрессии для
FREE

This is a simple RSI indicator, but unlike the original one, it sends alerts when volume falls below the upper level or rises above the lower level, so you never miss a trading opportunity. Combined with support and resistance levels, it can provide strong entry opportunities into the market. I recommend keeping the levels as they are, i.e. 75 above and 25 below Check out my signal " PipStorm Invest ", save it to your favorites and come back from time to time to check it again :)
FREE

AP Day-Week-Month High-Low overlay that draws the prior Day, Week, and Month highs/lows on any chart. Great for session planning, confluence, and alerting when price comes back to important swing levels. What it does Plots 6 lines: Day High/Low , Week High/Low , Month High/Low (from the previous completed sessions). Touch/near alerts when price reaches a selected line (with a user-set tolerance). Works on any symbol and timeframe. Zero external libraries. How to use Drop it on the chart you trad
FREE

Личная реализация известного принципа торговли по тренду, известного как более высокий максимум (Higher High), более высокая цена закрытия (Higher Close), более низкий минимум (Lower Low), более низкая цена закрытия (Higher Close) (HHHC - HHHL). Для определения направление тренда, изменения тренда и зоны отката он использует только ценовое действие. Настраиваемый период прорыва Настраиваемые цвета и размеры Не перерисовывается Доступны все типы алертов Индикатор определяет три ценовые зоны: Зоны
FREE

The indicator allows you to simplify the interpretation of signals produced by the classical ADX indicator.
The position of the hight bars of the histogram relative to zero and the histogram coloring indicate the direction of price movement determined by the intersection of DI+ / DI-.
The position of the hight bars of the histogram relative to zero and the color indicate the strength of the price movement.
The indicator is a logical continuation of the series of indicators using this classica
FREE
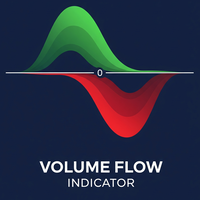
Volume Flow Indicator (VFI) - User Manual 1. General Introduction The Volume Flow Indicator (VFI) is an advanced technical oscillator designed to measure the strength and sustainability of a price trend by incorporating both price and volume data. Developed based on the concepts of On-Balance Volume (OBV) but with significant improvements, the VFI provides deeper insight into money flow and the conviction behind price movements. This indicator is not an automated trading system but a powerful an
FREE

This is a buyer and seller aggression indicator that analyzes the shape of each candle and project this data in a histogram form. There are 4 histograms in one. On the front we have two: Upper - Buyer force. Lower - Seller force. At the background we also have two histogram, both with same color. They measure the combined strenght of buyers and sellers. This histograms can be turned off in Input Parameters. It is also possible to have the real or tick volume to help on this force measurement. IN
FREE

Like most things that work in trading, it's really simple. However, it's one of the most powerful tools I have that makes entries of many systems much more precise.
In its essence, it measures the recent volatility against the medium-term average. How does it work? Markets tend to be prone to strong trending movements when relative volatility is low and tend to be mean-reverting when relative volatility is high.
It can be used with both mean-reversion systems (like the Golden Pickaxe) and mo
FREE

Santa Trend Indicator is an efficient way to forecast and detect the trend in any market. Advantages Generates instant buy and sell signals. Provides an alternate exit strategy to your existing trading system. Never repaints, never backpaints, never recalculates. Works in all symbols and all timeframes. Perfect trend filter for any strategy or expert advisor. Fully compatible with Expert Advisor (EA) development. Does not lag.
FREE
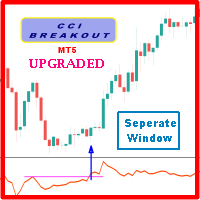
Probability emerges to record higher prices when Commodity Channel Index breaks out oscillator historical resistance level when exhibit overbought values. Since, oscillator breakout of support and resistance have similar effect as price breaks support and resistance levels, therefore, its highly advised to confirm price breakout with oscillator breakout; certainly, will have the same output in short trades. Concept is based on find swing levels which based on number of bars by each side of peak
FREE

This Supertrend strategy will allow you to enter a long or short from a supertrend trend change. Both ATR period and ATR multiplier are adjustable. If you check off "Change ATR Calculation Method" it will base the calculation off the S MA and give you slightly different results, which may work better depending on the asset. Be sure to enter slippage and commission into the properties to give you realistic results. If you want automatic trade with Supertrend indicator, please buy following pr
FREE

Линия Koala Trend обновлена до версии 1.2
Улучшение последнего обновления: добавлен новый параметр, который позволяет пользователю подключать линию тренда ко 2-й, 3-й или X-й самой высокой или самой низкой точке.
Мой запрос :
** Уважаемые клиенты, пожалуйста, опубликуйте свой отзыв о Koala Trend Line, и позвольте мне улучшить ваши отзывы.
ПОЧЕМУ KOALA TREND LINE ЯВЛЯЕТСЯ БЕСПЛАТНЫМ ИНДИКАТОРОМ?
Я считаю, что бесплатный индикатор должен быть квалифицированным инструментом.
А что насчет ДРУГИ
FREE

A tool for on-chart strategy backtesting and performance analysis.
A utility for developing, debugging, and testing custom trading ideas and indicator functions.
An indicator designed to quickly test trading concepts and visualize the effectiveness of different input parameters.
An all-in-one sandbox for testing everything from simple crossovers to complex, multi-condition trading systems.

Индикатор Давления Покупателей-Продавцов отображает рыночные настроения на множественных таймфреймах от M1 до D1. Он вычисляет проценты давления покупок и продаж, используя анализ импульса скользящих средних за настраиваемый период. Визуальная панель показывает полосы прогресса с силой покупателей в бирюзовом и доминированием продавцов в красном цвете, наряду с процентными значениями когда значимо. Каждый таймфрейм включает измерение силы тренда ADX с направленными индикаторами, показывающими во

Async Charts is an indicator to synchronize charts and display a customized crosshair (cursor) on all selected charts. This is a useful utility for traders using multiple timeframes of analyzing multiple symbols for trade entry or exit.
Main Features : Real time Crosshair Synchronization on All Selected Charts
Supports Multiple Timeframes and Multiple Symbols at the same time
Auto Scroll Option
Graphical Adjustment of Color, Font, Size, ...
Locking All or Locking Specific Charts
More and More .
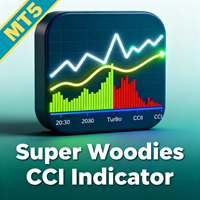
Улучшите свой торговый преимущество с помощью Super Woodies CCI Indicator MT5 — продвинутого осциллятора импульса, вдохновленного знаменитой системой Woodies CCI Кена Вуда, которая приобрела популярность в начале 2000-х среди дневных трейдеров благодаря подходу с двумя CCI для выявления циклических паттернов и высоковероятных установок. Широко любимый трейдерами форекс, акций и товаров, этот индикатор использует Commodity Channel Index (CCI) для обнаружения перекупленности/перепроданности, продо

-Концепция тенденции заполнения фитиля
Во время высокой волатильности на рынке свечи склонны создавать фитили на пути своего движения. Фитиль в свече отражает отклонение цены. В большинстве случаев эти фитили заполняются, поскольку в этом направлении движется огромный объем. Wick Fill Trend сканирует эти возможности, фокусируясь на трендовых рынках.
Он имеет приборную панель симулятора успешности, которая отображает живой сигнал с точкой входа, тейк-профитом и стоп-лоссом. Этот симулятор успе
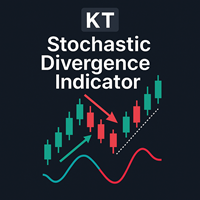
Дивергенция — это один из важных сигналов, указывающих на возможный разворот цены на рынке. KT Stoch Divergence показывает обычные и скрытые дивергенции между ценой и стохастическим осциллятором.
Ограничения KT Stoch Divergence
Использование дивергенции стохастика в качестве единственного сигнала входа может быть рискованным. Не каждую дивергенцию можно трактовать как сильный сигнал разворота. Для лучших результатов рекомендуется комбинировать с анализом цены и направлением тренда.
Особенности

KT Heiken Ashi Alert отображает стрелки покупки и продажи и генерирует оповещения на основе стандартных свечей Heiken Ashi. Это незаменимый инструмент для трейдеров, которые хотят включить Heiken Ashi в свою торговую стратегию. Стрелка на покупку появляется, когда Heiken Ashi меняется с медвежьего на бычье состояние. Стрелка на продажу появляется, когда Heiken Ashi меняется с бычьего на медвежье состояние. Поддерживаются push-уведомления, email, звуковые сигналы и всплывающие окна.
Что такое He
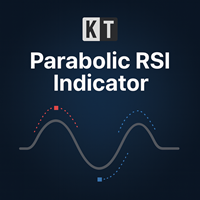
KT Parabolic RSI накладывает Parabolic SAR прямо на линию RSI, чтобы подчеркнуть возможные разворотные точки рынка. Классические уровни перекупленности и перепроданности RSI уже намекают на развороты, но добавленный фильтр PSAR убирает большую часть шума и делает сигналы четче и надежнее, предоставляя вам более ясные и уверенные торговые сетапы. Большие квадраты: Переворот Parabolic SAR на RSI, находящемся в зоне перекупленности или перепроданности. Это указывает на высокую вероятность разворота
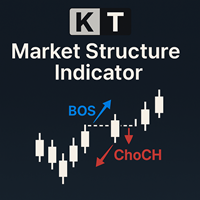
The KT Market Structure intelligently detects and displays Break of Structure (BOS) , Change of Character (CHoCH) , Equal Highs/Lows (EQL) , and various significant swing high/low points using our proprietary algorithm for accurate pattern detection. It also offers advanced pattern analysis by effectively demonstrating the captured profit for each pattern. A fully automated EA based on this indicator is available here: KT Market Structure EA MT5
Features
Accurate Pattern Detection: Our advance
Developed by Smart2Trader
The Didi Index Nuvem Indicator is an indicator based on the original Didi Aguiar (Didi Index) indicator, featuring two visualization methods for the moving averages: as a cloud or as lines (original). This customization offers a new way to visualize the moving average crossovers in the Didi Index indicator. About the Didi Index Indicator The Didi Index Indicator , created by Brazilian trader Didi Aguiar, is a technical analysis tool based on the crossover of three expo
FREE
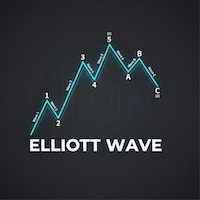
Автоматическая Волновая теория Эллиотта (Automated Elliott Wave) 1. Автоматический подсчет волн и снижение предвзятости (Объективность) Обычно подсчет волн Эллиотта сопряжен с субъективностью или "фантазиями" трейдера. Этот индикатор помогает: Находить Импульсные волны (1-2-3-4-5): Использует строгие правила (например, волна 3 не может быть самой короткой, волна 4 не должна перекрывать волну 1), отображая теоретически правильную структуру цены. Находить Коррекционные волны (A-B-C): Помогает пойм

Pivot Point Super trend it can be used to catch price turning points and can show arrows for buying and selling. calculations are based on price peaks . you can control the price turning points by increasing the Pivot point period input on the indicator the ATR factor is for how far apart do you want the bands to be spread apart price break outs are also spotted in their early stages which will make trading much better
FREE
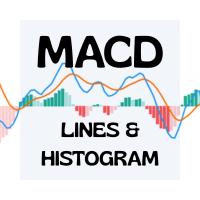
Advanced MACD Indicator with 6 Colors & Adjustable Line Thickness Elevate your trading charts with this fully customizable MACD indicator for MetaTrader 4/5. With six independent color slots and per-line thickness controls, you can tailor every element to your exact preferences. Key Features Six Separate Color Slots
Customize each component with its own color: MACD Line Signal Line Histogram Bars (Bullish) Histogram Bars (Bearish) Zero Line Adjustable Line Thickness
Choose any thickness—from e
FREE
Описание
Candlestick Pattern Analyzer — это продвинутый инструмент для дискреционных и системных трейдеров, разработанный для автоматического выявления основных японских свечных паттернов и предоставления детального статистического анализа их исторических результатов. Индикатор идеально подходит для тех, кто хочет проверить реальную эффективность паттернов и использовать их в сочетании с фильтрами подтверждения (тренд, ключевые уровни, объемы и т. д.) и четко определённой стратегией управления
++++++++++++++++++++++++++++++++++ +++ Trend Tool ++++++++++++++++++++++++++++++++++ Hallo Trader, This is a trend tool that I use... based on four moving averages. Price below or above the EMA200 is indication for the long term trend. Also the direction of the slope counts. You can customise in settings if you want. The tool is aligned with my Forecast System and the Bounce Zones. - Forecast System --> https://www.mql5.com/en/market/product/156904 - Bounce Zones --> https://www.mql5.com/en/mar
FREE
Simple Spread Indicator (SSI) is a simple and lightweight indicator that displays the current spread value directly on the main chart window.
It helps traders instantly recognize market liquidity conditions and trading costs without opening additional panels or tools. Features Real-time spread display on the main chart Customizable position and font size Minimal system load and no data buffering Useful for scalping and low-spread strategy monitoring How it works The indicator calculates the diff
FREE

Zone Alerts by iXOpay - MT5 Indicator What it is Indicator that marks price zones and sends alerts when the price touches, breaks, exits, or retests those zones. Neutral, informative tool. No promises of profit. How to use Attach to any symbol and timeframe. Set the zone boundaries and enable the desired events. Optionally enable trend/volatility filters. Receive alerts and manage your plan. Inputs EMA_Period (20/50/100/200) - optional trend filter Stoch_K , Stoch_D , Stoch_Smooth - confirmation
FREE
Haven Fibonacci Volume Profiles — Ваш Автоматический Аналитик Рыночных Диапазонов Представляем Haven Fibonacci Volume Profiles — мощный инструмент, который выводит анализ рынка на новый уровень. Этот индикатор автоматически определяет ключевые ценовые диапазоны, построенные по значимым точкам разворота (пивотам), и накладывает на каждый из них детализированный Профиль Объема вместе с уровнями Фибоначчи. Это позволяет трейдерам мгновенно видеть, где сосредоточена ликвидность и где находятся истин

The big figure is a crucial aspect of forex trading, serving as a reference point for trade execution, risk management, and technical analysis. By understanding the importance of the big figure and incorporating it into their trading strategies, forex traders can improve their decision-making process and increase the likelihood of successful trades. Why is the Big Figure Important? The big figure is important for several reasons: Simplification: Traders often refer to the big figure when discu
FREE

Multi-Currency Strength Dashboard PRO MT5 (v2.6) – Индикатор силы валют с визуальной панелью Multi-Currency Strength Dashboard PRO — это индикатор для MetaTrader 5 , который измеряет относительную силу 8 основных валют (USD, EUR, GBP, JPY, CHF, CAD, AUD, NZD) в реальном времени, анализируя до 28 валютных пар Forex (в зависимости от доступных у вашего брокера символов). Цель инструмента — дать быстрый и структурированный обзор силы/слабости валют, чтобы помочь выбирать пары для анализа (сильная в
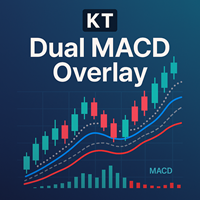
KT Dual MACD Overlay выводит два полноценных осциллятора MACD прямо на ценовой график: один для текущего таймфрейма, другой — с более высокого таймфрейма. Быстрый MACD фиксирует краткосрочный импульс, а медленный MACD удерживает вас в русле широкой тенденции. Так как оба слоя расположены поверх свечей, вы получаете полный обзор рыночного импульса без переключения окон или графиков.
Buy Entries
Основной вход в лонг: синяя вертикальная линия появляется при начале восходящего тренда. Дополнительны

Панель Phoenix Spread (MT5)
Панель мониторинга спредов в реальном времени для MetaTrader 5. Отображает текущий спред между ценой покупки и продажи в пунктах на вашем графике.
Назначение
Расширение спреда — одна из самых недооцененных причин торговых убытков. В периоды низкой ликвидности, ролловеров, новостных событий или волатильности спреды могут резко расширяться, превращая вполне выгодные сделки в мгновенные просадки.
Панель Phoenix Spread обеспечивает постоянный мониторинг стоимости спре
FREE
The Channel Sgnals ProfRoboTrading Indicator for MT5 is an effective Forex trading tool designed to track market movements. The MT5 signal point indicator effectively detects trend reversals after they have already occurred. This Indicator is a fully automated technical tool that includes a number of parameters to track market trends. It automatically examines the ever-changing price dynamics of the market, compares the information with earlier data and generates a trading signal. Because
FREE

Thermo MAP is a multicurrency and multitimeframe indicator that display a smart heat map based on proprietary calculations. Watch how Forex market moved and is currently moving with a single dashboard and have a consistent and good idea of what is happening!
It can be suitable for both scalping or medium/long term, just select options that better fit your trading style Symbols list are automatically sorted based on the preferred column. There is the possibility to click on: First row, timeframe
FREE

Cycle Sniper MT5 Cycle Sniper MT4 Version and definitions : https://www.mql5.com/en/market/product/51950 Important Notes: MT5 Version does not include Breakout Mode and Late Entry Mode Features.
MT5 Version does not include RSI and MFI filter. **Please contact us after your purchase and we will send you the complimentary indicators to complete the system.**
This indicator does not send any signal without a reason...You can observe and analyze the indicator and the signals it sends Cycle Sni

Этот индикатор сочетает в себе классические индикаторы MACD и Zigzag для обнаружения расхождения между ценой и индикаторами. Он также использует передовые технологии искусственного интеллекта (ИИ) для обнаружения достоверности расхождения. MACD известен как "король индикаторов", а Zigzag также является очень полезным индикатором. Объединяя эти два индикатора, этот индикатор использует преимущества обоих. Обнаружение расхождения является вероятностной проблемой. Часто расхождения возникают только

СПЕЦИАЛЬНОЕ ПРЕДЛОЖЕНИЕ НА ЗАПУСК – Бесплатно до 05.01.2026 или для первых 100 загрузок (что наступит раньше) Если вы видите эту страницу, значит вы всё ещё находитесь в рамках эксклюзивного периода запуска. После достижения лимита индикатор будет продаваться на Market MQL5 на стандартных условиях. Mikko Breakout Indicator – Интеллектуальное определение пробоев для MetaTrader 5 Профессиональный индикатор пробоев для MetaTrader 5, предназначенный для Forex, индексов и криптовалют. SqueezeMAX Pro
FREE

MT4 version Overview The Lowess Channel indicator is a smoothed trend-following tool designed to help traders identify the direction of the trend , detect flat or ranging markets , and spot breakouts from consolidation zones. It creates a central smoothed line with upper and lower channel boundaries, adapting to market noise while maintaining clarity. How It Works The indicator builds a channel around a smoothed price line. The central line reflects the current trend. The upper and lower bounda
FREE
1. Introduction The Squeeze Momentum Plus is a powerful technical analysis tool designed to help traders identify periods of low market volatility (the "squeeze" phase) and assess the direction and strength of price momentum . This indicator combines the principles of Bollinger Bands and Keltner Channels to detect changes in market volatility, along with a momentum oscillator to measure buying/selling pressure. 2. Key Components of the Indicator The Squeeze Momentum Plus is displayed in a separa
FREE
Multitimeframe Viewer HiddenEdge – HTF Realtime MiniChart A clear view of higher-timeframe structure — directly inside your main chart.
No need to switch timeframes anymore. HiddenEdge Multitimeframe Viewer shows the last candles of any higher timeframe in a compact, real-time panel — so you can see the bigger picture while staying focused on execution. Key Features Realtime update: the current higher-timeframe candle is drawn live, updating every second. Select how many candles to display:
FREE

Read This : Please provide comments and reviews for future improvements. WaveTrendPro_Indi v1.05
WaveTrend indicator with enhanced histogram visualization: WaveTrendPro_Indi v1.05
Indikator WaveTrend dengan tampilan histogram yang lebih jelas: Histogram otomatis lebih tinggi (bisa diatur dengan parameter HistScale ). Warna histogram berbeda untuk positif & negatif → tren naik lebih mudah dibaca. Tetap ringan & responsif di berbagai pair/timeframe. Cocok untuk scalper, swing trader,
FREE

My Fibonacci MT5 An automated Fibonacci indicator for MetaTrader 5 that combines ZigZag swing detection with comprehensive Expert Advisor integration through a 20-buffer system. More details about data specification and EA integration: https://www.mql5.com/en/blogs/post/764114 Core Features Automated Fibonacci Detection The indicator identifies swing points using configurable ZigZag parameters and draws Fibonacci retracements and extensions automatically. It updates levels as new swing formatio
FREE

This indicator draws regular bullish and bearish divergences in real-time onto the charts. The algorithm to detect those divergences is based on my 10+ years experience of detecting divergences visually. The divergences are drawn as green and red rectangles on the charts. You can even do forward testing in the visual mode of the strategy tester. This FREE Version is restricted to EURUSD and GBPUSD. The full version without restrictions is here: https://www.mql5.com/en/market/product/42758
Para
FREE

В Clock GMT Live есть все, что вам нужно, чтобы узнать больше о нашем брокере, много раз вы задавались вопросом, на каком GMT я нахожусь или над каким GMT работает мой брокер, что ж, с помощью этого инструмента вы сможете узнать в режиме реального времени как GMT смещение времени брокера и вашего местного времени, вы также будете постоянно знать пинг брокера Просто поместив его на время суток, вы можете получить информацию
Цена увеличивается за каждое приобретение, с этим мы защитим, чтобы нем
FREE

2025 Spike Killer Dashboard - Advanced Trading Signals & Market Analytics Transform Your Trading with Intelligent Market Insights! The 2025 Spike Killer Dashboard is a powerful MQL5 indicator that combines cutting-edge signal generation with an intuitive crystal dashboard for real-time market analysis. Designed for traders who demand precision and clarity, this all-in-one tool delivers actionable signals and comprehensive market metrics at a glance. Key Features: Dual Signal System Shved S

Certainly! Let me introduce you to a powerful tool for MetaTrader 5 (MT5) that can automatically identify and draw support and resistance (S&R) levels on your trading charts. This tool is called the “Support and Resistance Levels Guru” . Support Resistance Levels Guru The Support & Resistance Indicator automatically displays essential S&R levels on your chart. These levels are crucial for technical analysis and are used by many traders. Resistance levels (zones) are shown in R ed , while suppo
FREE

Descripción corta Consensus MTF es un indicador gratuito de alineación multi-timeframe diseñado para mostrar el contexto real del mercado .
No genera señales de entrada ni salida. Su objetivo es ayudar a evitar operar cuando el mercado no está alineado . Descripción completa Consensus MTF analiza la dirección del mercado en varios timeframes simultáneamente, evaluando la posición del precio respecto a su nivel de equilibrio en cada marco temporal. Cada timeframe se clasifica de forma indep
FREE

TickChartAskLine - это специализированный индикатор для MetaTrader 5, предназначенный для визуализации плавающего спреда на тиковых графиках, созданных с помощью TickChartService. Индикатор отображает две линии на графике: синюю Bid линию (основная цена) и красную Ask линию, позволяя трейдерам визуально отслеживать динамику спреда в режиме реального времени. Это критически важно для скальперов и высокочастотных трейдеров, которым необходимо контролировать стоимость входа в позицию на каждом
FREE

VolumeFlow is a Volume Accumulation / Distribution tracking indicator. It works in a similar way to OBV, but it is much more refined and includes the options to use: Classical Approach = OBV; Useful Volume Approach; Gail Mercer's approach; Input Parameters: Input Parameters: Approach Type: Explained above; Volume Type: Real or Ticks; Recommendations: Remember: The TOPs or BOTTONS left by the indicator are good Trade Location points. This is because the players who were "stuck" in these regions w
FREE
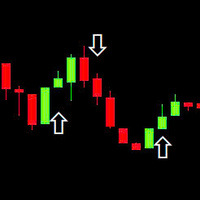
This indicator is based on the RSI (Relative Strength Index) to identify potential Breakout points and draw arrows on the chart to suggest buy/sell signals. Use RSI to find breakout signals. Draw Buy/Sell arrows on the chart. Send alerts when there is a trading signal. Buy (Orange Arrow - 0xFFAA00): When a buy signal appears. Sell (Blue Arrow - 0x0000FF): When a sell signal appears. DRAW_ARROW: Used to draw arrows on the chart.
FREE

TransitTrendlines this is a automatically trendline drawer, it draw both horizontal and diagonal trendlines. The horizontal trendlines are the pivot points of the day timeframe and the diagonal trendlines are based on the current time frames. You can adjust the diagonal trendlines by increasing the number of bars to draw the diagonal trendline and can also adjust the steepness. Note that the Horizontal trendlines are based on the day pivot points not currant time frame. Join mql5 transitbk98 cha
FREE

Об индикаторе: DALA Forecast - универсальный инструмент предсказания динамики временных рядов любой природы. Для предсказания используется модифицированные методы анализа нелинейной динамики, на основе которых строится предсказательная модель с применением методов машинного обучения. Для получения ознакомительной версии индикатора вы можете связаться со мной в личных сообщениях.
Как пользоваться индикатором: Примените индикатор к выбранному вами финансовому интрументу или индикатору с нужными
FREE
MetaTrader Маркет - лучшее место для продажи торговых роботов и технических индикаторов.
Вам необходимо только написать востребованную программу для платформы MetaTrader, красиво оформить и добавить хорошее описание. Мы поможем вам опубликовать продукт в сервисе Маркет, где его могут купить миллионы пользователей MetaTrader. Так что занимайтесь только непосредственно своим делом - пишите программы для автотрейдинга.
Вы упускаете торговые возможности:
- Бесплатные приложения для трейдинга
- 8 000+ сигналов для копирования
- Экономические новости для анализа финансовых рынков
Регистрация
Вход
Если у вас нет учетной записи, зарегистрируйтесь
Для авторизации и пользования сайтом MQL5.com необходимо разрешить использование файлов Сookie.
Пожалуйста, включите в вашем браузере данную настройку, иначе вы не сможете авторизоваться.