Смотри обучающее видео по маркету на YouTube
Как купить торгового робота или индикатор
Запусти робота на
виртуальном хостинге
виртуальном хостинге
Протестируй индикатор/робота перед покупкой
Хочешь зарабатывать в Маркете?
Как подать продукт, чтобы его покупали
Технические индикаторы для MetaTrader 5 - 9

Smart Volume Box is designed to give MetaTrader users a powerful, analytical tool for uncovering the hidden dynamics in the market. This precision-built tool, complete with user-friendly settings, integrates essential volume insights and advanced features like Volume Profile, VWAP (Volume Weighted Average Price), and Point of Control (POC) levels. Unlike typical indicators, Smart Volume Box doesn’t provide specific trade signals but instead offers a clearer perspective on market trends, makin

High Low Today (MT5) — бесплатный, простой и удобный индикатор для MetaTrader 5, который показывает на графике максимум (High) и минимум (Low) текущего дня. Также индикатор способен отправлять push-уведомления, предупреждая о касании или пробое ценой этих ключевых уровней. Его интерфейс выполнен в минималистичном стиле, поэтому он наглядно дает внутридневные ориентиры и не загромождает ваш график. Отмечает на графике уровни High и Low текущего торгового дня (ключевые внутридневные уровни поддер
FREE

Custom Spread Indicator *Please write a review, thanks!
Also MT4 version is available
Spread Indicator show the current spread in pips with color codes. Handle 3 levels, Low, Medium, High. You can set levels and colors for each level (eg. Low: Green, Medium: Orange, High: Red), and can choose display position on the chart.
There is two spread calculation mode: -> Server spread value -> Ask - Bid value
Can set opacity, for better customization. When spread jump bigger, then display do not
FREE

Индикатор ICT NewYork Open Killzone предназначен для трейдеров, которые следуют концепциям Smart Money (SMC) , торговым моделям ICT и стратегиям на основе ликвидности на рынке Forex . Этот инструмент отмечает New York Open Killzone , охватывая период с 11:00 до 14:00 по Гринвичу , критическое время, когда институциональный объем часто приводит к крупным движениям. Индикатор выделяет диапазоны сессий , диапазоны маркет-мейкеров , свипы ликвидности , зоны FV
Special offer : ALL TOOLS , just $35 each! New tools will be $30 for the first week or the first 3 purchases ! Trading Tools Channel on MQL5 : Join my MQL5 channel to update the latest news from me Supply Demand Retest and Break Multi Timeframe , этот инструмент отображает зоны спроса и предложения на основе свечей с сильным импульсом, позволяя вам идентифицировать эти зоны на нескольких временных интервалах с помощью функции timeframe selector . С метками повторного тестирован
Специальное предложение : ALL TOOLS , всего по $35 за каждый! Новые инструменты будут стоить $30 в течение первой недели или для первых 3 покупок ! Канал Trading Tools на MQL5 : присоединяйтесь к моему каналу MQL5, чтобы получать последние новости Stochastic Z-Score — это осциллятор импульса, который нормализует цену с помощью Z-оценки, ограничивает её стохастической логикой и сглаживает с помощью HMA, а ALMA добавляет долгосрочный контекст. Он обеспечивает чёткий и отзывчивый сигн

Verve AI Reversal Pro Indicator Pro — это идеальный помощник трейдера, требующего высочайшей точности и беспрецедентного понимания рыночной динамики. Используя передовые технологии искусственного интеллекта, этот инструмент непрерывно анализирует движение цены, объём и волатильность, чтобы выявлять зоны с высокой вероятностью разворота ещё до их полного формирования. Объединив алгоритмы машинного обучения с проверенными принципами технического анализа, Verve AI формирует чёткие и уверенные сигн

KT OBV Divergence показывает регулярные и скрытые дивергенции, возникающие между ценой и индикатором OBV (On Balance Volume).
Особенности
Несимметричные дивергенции отфильтрованы для повышения точности и снижения визуального шума. Поддерживает стратегии как на разворот тренда, так и на его продолжение. Полностью совместим и готов для встраивания в советник (Expert Advisor). Может использоваться как для входа, так и для выхода из позиции. Доступны все типы оповещений MetaTrader.
Что такое дивер
Pin bar tracker – это индикатор, предназначенный для поиска паттернов пин-бара на графиках валют, золота и биткойна на любом временном интервале. Он включает в себя инструмент, который автоматически рассчитывает соотношение риска и прибыли, объем сделки и возможные уровни стоп-лосса и тейк-профита. Характеристики: - Работает на любом временном интервале - Автоматически рассчитывает объем сделки - Показывает уровни стоп-лосса и тейк-профита - Отправляет уведомление, когда обнаруживает пин-бар
FREE

BOOM AND CRASH PRO SPIKER This indicator is specifically designed for all boom and crash indices. The indicator targets buy spike signals for boom indices and sell spike signals for crash indices. The indicator contains optimized trend filters to target buy spikes in an uptrend and sell spikes in a downtrend. The indicator also adds a grid signal to recover some loss of the first signal. The indicator also provides exit signals for delayed spikes which can help with risk management. Also, it an
FREE
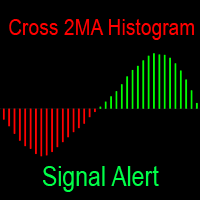
Индикатор показывает разницу между двумя скользящими средними в виде гистограммы. Скользящие средние обладают огромными возможностями для настройки. Оповещает всеми способами при смене цвета гистограммы: пищит в терминале, шлёт уведомление на телефон и письмо на почту — теперь вы точно не пропустите сделку. Полностью бесплатный индикатор пересечения скользящих средних в виде линий на графике: https://www.mql5.com/ru/market/product/148478 Ваши отзывы очень важны для меня. Обратная связь делает ра
FREE

Эта панель обнаруживает и отображает на графике зоны спроса и предложения , как в скальпинге, так и в долгосрочном режиме, в зависимости от вашей торговой стратегии для выбранных символов. Кроме того, сканерный режим панели помогает сразу проверить все нужные символы и не пропустить ни одной подходящей позиции / MT4 версия
Бесплатный индикатор: Basic Supply Demand
Особенности Позволяет просматривать торговые возможности по нескольким валютным парам , давая вам четкое и ясное пред
Candle Timer Countdown (CTC) – Minimalist & Precise Candle Timer Candle Timer Countdown (CTC) is a lightweight and non-intrusive MetaTrader indicator that displays the remaining time of the current candlestick on your chart. Designed with simplicity and clarity in mind, this tool helps traders stay aware of candle closures without cluttering the chart. Key Features: Real-Time Candle Countdown
Always know how many seconds are left before the current candle closes – works on all timeframes. Minima
FREE

This is a derivative of John Carter's "TTM Squeeze" volatility indicator, as discussed in his book "Mastering the Trade" (chapter 11).
Gray dot on the midline show that the market just entered a squeeze (Bollinger Bands are with in Keltner Channel). This signifies low volatility, market preparing itself for an explosive move (up or down). Blue dot signify "Squeeze release".
Mr.Carter suggests waiting till the first blue after a gray dot, and taking a position in the direction of the moment
FREE

Торговля пивотами:
1.pp pivot
2. r1 r2 r3, s1 s2 s3
Necessary for traders: tools and indicators Waves automatically calculate indicators, channel trend trading Perfect trend-wave automatic calculation channel calculation , MT4 Perfect trend-wave automatic calculation channel calculation , MT5 Local Trading copying Easy And Fast Copy , MT4 Easy And Fast Copy , MT5 Local Trading copying For DEMO Easy And Fast Copy , MT4 DEMO Easy And Fast Copy , MT5 DEMO
Сотрудничество QQ: 556024 "
Сотрудни
FREE

Bar Countdown With Symbol Info is a sleek, non-intrusive Heads-Up Display (HUD) designed to keep essential market data in front of your eyes without cluttering the chart. It combines a smart candle timer with a comprehensive symbol information strip.
Key Features: Smart Candle Countdown: Follow-Price Mode: The timer attaches dynamically to the Bid price line, moving up and down with the market so your eyes never leave the action. Dynamic Coloring: The background changes color in real-time
FREE

Super Trend Plus is a trading system that uses four Supertrends set with different parameters. The idea behind this system is that when three Supertrends move in the same direction, there is a strong trend confirmation, but entry occurs only when the fourth Supertrend also moves in the same direction as the other three. For example, the first Supertrend could be used with a volatility multiplier of 3 and a period of 10, the second Supertrend with a volatility multiplier of 3 and a period of 12,

This all-in-one indicator displays real-time market structure (internal & swing BOS / CHoCH), order blocks, premium & discount zones, equal highs & lows, and much more...allowing traders to automatically mark up their charts with widely used price action methodologies. Following the release of our Fair Value Gap script, we received numerous requests from our community to release more features in the same category. "Smart Money Concepts" (SMC) is a fairly new yet widely used term amongst price a

Indicator Description (based on AVPT EA ):
This indicator visualizes a Volume Profile-based liquidity architecture on the chart by analyzing where trading volume is concentrated across price levels over a specified lookback period. It calculates key volume structures such as:
Point of Control (POC): the price level with the highest traded volume.
Value Area (VA): the range containing a configurable percentage of total volume (typically ~70%).
High-Volume Nodes (HVNs): price levels with sign
FREE
UT Bot with Alerts The UT Bot Alerts Indicator for MetaTrader 5 is a versatile trading tool that generates buy and sell signals based on ATR-based trailing stop logic. It displays signals with arrows, draws an entry price line, and includes a candle countdown timer. The indicator offers customizable alerts (pop-up, email, push notifications) and a text label showing signal details. Users can adjust ATR sensitivity, label positions, and timer settings, making it suitable for various markets and
FREE

Sonic R Indicator Description Overview The Sonic R Indicator for MT5 is designed to help traders analyze market trends using moving averages and volume analysis. This tool assists in identifying potential price movements by displaying trend zones and volume strength, making it suitable for various trading strategies. Key Features Dual EMA Trend Channels – Uses 34-period Exponential Moving Averages (EMA) to visualize price movement. Volume Analysis – A color-coded histogram to indicate changes i

[Power Volume Candle] - Indicator to see the comparison of bullish and bearish volume
Volume comparison indicator on candlestick, by calculating the volume value of the specified candle history to determine the percentage of volume strength. calculates the percentage comparison of each time frame displayed on 1 screen. Subscribe the MQL5 channel for other interesting information : (Automatic) Forex Tools Join new Public Group to Expressing Opinions and Sharing: Auto Fx Investment See other
FREE

Откройте новые возможности анализа рынка с индикатором, отображающим визуальную книгу ордеров на графике, вдохновленным Visual Book от Profit компании Nelogica. Горизонтальные полосы показывают объемы покупок (синий) и продаж (красный), с желтым выделением для больших объемов, помогая выявить зоны высокой ликвидности. Цена имеет тенденцию двигаться в сторону зон с наибольшей концентрацией ордеров, что делает индикатор незаменимым для определения уровней поддержки и сопротивления. Настраиваемые п
FREE

NeoBull Predictive Ranges — это комплексная система технического анализа для MetaTrader 5. Индикатор объединяет продвинутые расчеты волатильности с объемным анализом тренда. Этот инструмент разработан для предоставления трейдерам точной информации о структуре рынка и потоке ордеров (Order Flow). Я предоставляю этот профессиональный инструмент сообществу бесплатно. Концепция и идея Стратегическая основа и комбинация индикаторов (Predictive Ranges и Volumatic VIDYA) базируются на анализе YouTube-к
FREE
** All Symbols x All Time frames scan just by pressing scanner button ** Discount: The price is $50$, But now it is just $35, Limited time offer is active.
*** Contact me to send you instruction and add you in "Swing scanner group" for sharing or seeing experiences with other users. Swing EA: https://www.mql5.com/en/market/product/124747 Introduction: Swing Scanner is the indicator designed to detect swings in the direction of the trend and possible reversal swings. The indicator st
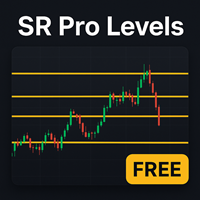
Получите кристально четкую рыночную структуру за секунды – без ручного построения!
Индикатор HTF Auto Support & Resistance автоматически отмечает ключевые уровни поддержки и сопротивления прямо на графике. Эти уровни основаны на старших таймфреймах (HTF), поэтому они гораздо надежнее случайных краткосрочных линий. Основные функции: Автоматическое определение сильнейших зон поддержки и сопротивления Мульти-таймфрейм анализ: выбирайте старший ТФ для более точных уровней Четко структурированные зо
FREE

SMC Order Block Zones (MT5) is a Smart Money Concept (SMC) analytical indicator specially designed and optimized for Gold (XAUUSD) .
It automatically detects Order Blocks and displays them as Supply & Demand zones , helping traders identify potential institutional price levels on Gold. The indicator uses volatility-adaptive logic , making it highly suitable for the fast and aggressive movements of XAUUSD. Key Features (XAUUSD Optimized) Specially designed for Gold (XAUUSD) Automatic Order Block
FREE

Indicator Guide: Key Price Levels & Structure Shifts 1. Description The indicator is a technical analysis tool for the MetaTrader 5 platform. It is designed to automatically identify specific price movements and to highlight corresponding price zones based on preceding price action. This provides a visualization of key price areas according to the indicator's internal logic. 2. Visual Elements & Their Identification The indicator identifies and draws several types of visual elements on the chart
FREE

AW Super Trend - Это один из наиболее популярных классических трендовых индикаторов. Имеет простую настройку, позволяет работать не только по тренду, но и отображает уровень стоплосса, который рассчитывается данным индикатором. Преимущества:
Инструменты: Валютные пары , акции, сырьевые товары, индексы, криптовалюты. Таймфрейм: М15 и выше. Время торговли: Круглосуточно. Показывает направление текущей тенденции. Ведет расчет стоплосса. Может быть использован при работе с трейдингом. Три ти
FREE

ICT Silver Bullet
If you are searching for a reliable indicator to trade the ICT Silver Bullet concept, or ICT concepts, Smart Money Concepts, or SMC, this indicator will respond to your need! Before version 2.2, this indicator was focused only on ICT Silver Bullet, but moving forward, we will include the different elements for smart money concept trading. This indicator will help you identify the following: FVG - fair value gaps Market structure: BOS and CHOCH. It is based on swing high and l

Professional VWAP Trading System with Advanced Signal Detection Transform your trading with the most comprehensive VWAP indicator available for MetaTrader 5. Magic VWAP Key Levels Pro combines multiple timeframe analysis, intelligent signal detection, and professional-grade visualization to give you the edge in modern markets. CORE FEATURES: Multi-Timeframe VWAP Analysis Session, Weekly, and Monthly VWAP calculations Previous 10-day VWAP support/resistance Dynamic anchor periods (Session/Week/Mo

The indicator shows bullish and bearish divergence. The indicator itself (like regular stochastic) is displayed in a subwindow. Graphical interface : In the main window, graphical objects “trend line” are created - produced from the “Low” price to the “Low” price (for bullish divergence) and produced from the “High” price to the “High” price (for bearish divergence). The indicator draws in its window exclusively using graphic buffers: “Main”, “Signal”, “Dot”, “Buy” and “Sell”. The "Buy" and "

Повысьте свою торговую стратегию с помощью Nadaraya Watson Envelope Alert MT5 , передового индикатора, использующего непараметрическую ядерную регрессию для обеспечения плавного, адаптивного анализа тенденций. Вдохновленный оценщиком Надрая-Ватсона, этот инструмент применяет гауссово сглаживание ядра к ценовым данным, создавая динамические оболочки, которые адаптируются к волатильности рынка без чрезмерного запаздывания традиционных скользящих средних. Широко признанный на платформах вроде Tradi

Smart SR Levels Support and Resistance - Professional Strength-Based Support & Resistance Indicator MT5
Key Features: • Automatic detection of significant Support and Resistance levels • Line thickness based on level strength (number of touches + volume factor) • Custom colours for Support and Resistance • Multi-timeframe support • Clean background lines (no overlap with candles) • Labels showing S/R type and strength value
Perfect for price action traders, supply-demand zones, and institutio
FREE

Монитор свечных паттернов Phoenix (MT5)
Инструмент для обнаружения и мониторинга свечных паттернов в реальном времени для MetaTrader 5. Автоматически идентифицирует классические свечные паттерны по нескольким символам и отображает комплексную статистику паттернов на визуальной панели инструментов.
Обзор
Монитор свечных паттернов Phoenix обнаруживает и отслеживает паттерны Доджи, Молот, Падающая звезда, Бычий поглощающий, Медвежий поглощающий, Утренняя звезда, Вечерняя звезда, Три белых солдат
FREE

Watermark Centralized
Adds a watermark centered with the asset name and chosen period.
It is possible to override the font type, font size, font color and separator character.
The watermark is positioned behind the candles, not disturbing the visualization.
It has automatic re-centering if the window is resized.
Hope this indicator helps you, good trading ;)
FREE

Средневзвешенная по объему цена аналогична скользящей средней, за исключением того, что объем включен для взвешивания средней цены за период.
Средневзвешенная по объему цена [VWAP] - это динамическое средневзвешенное значение, предназначенное для более точного отражения истинной средней цены ценной бумаги за определенный период. Математически VWAP - это сумма денег (т. Е. Объем х цена), деленная на общий объем в любой временной интервал, обычно с рынка, открытого для рынка.
VWAP отражает рын
FREE

Описание. Основой формирования графика Ренко является ценовой диапазон. Если цена выходит за его пределы, на графике отображается бокс выше или ниже предыдущего. В результате мы видим ценовое движение без дополнительного "шума" и важные уровни поддержки и сопротивления. Особенности. Для использования совместно с советником реализован дополнительный буфер-счетчик боксов. Для удобства и повышения скорости тестирования пользователь может использовать событие "новый бокс", которое индикатор генериру
FREE

Индикатор строит трендовый канал по методике Гильберта Раффа. Ось канала представляет собой регрессионную зависимость первого порядка. Верхняя и нижняя линии показывают максимальное расстояние, на которое удалилась цена закрытия интервала от осевой линии. Поэтому верхнюю и нижнюю линии можно считать линиями сопротивления и поддержки соответственно. Аналогичная версия индикатора для терминала МТ4
Как правило, большая часть движений цены происходит в пределах канала, выходя за линию поддержки или
FREE

Индикатор VR Donchian - это улучшенный вариант канала Дончиана. Улучшения коснулись практически всех функций канала, но при этом был сохранен основной алгоритм работы и построение канала. В индикатор бала добавлена смена цвета уровней в зависимости от текущей тенденции - это явно показывает трейдеру смену тренда, флета. Была добавлена возможность информировать трейдера о пробитии одного из двух уровней канала на смартфон, электронную почту или в самом терминале MetaTrader. Были добавлены ценовые
FREE
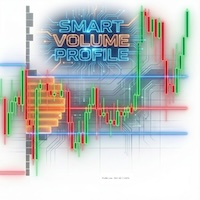
Russian Сканирование «Smart Money» (Volume Markers): Стрелки указывают на аномальный объем (выше среднего) с четким разделением на зеленый/красный цвета. Это помогает определить вход крупных игроков и отфильтровать ложные сигналы. Важные оповещения (Alerts): Не нужно постоянно следить за экраном. Система мгновенно уведомит вас, когда цена пересечет линию POC (центр объема), что часто является решающим моментом для продолжения или разворота тренда. Текущая структура рынка (Developing Profile): По

if you want to test it : private message me ( MT5 demo testing doesn't work ) Designed to help traders gain a deeper understanding of the market’s true order flow dynamics . By visualizing the “ footprints ” left by candles, this indicator reveals how the delta ( the difference between buying and selling pressure ) changes during the candle formation, as well as how volume fluctuates at different price levels. These insights are essential for traders seeking to identify reversals, breakouts, and

Индикатор отображает стакан заявок, а также увеличивает его глубину, запоминая расположение заявок, ушедших за пределы текущего "окна" просмотра.
Возможности индикатора Отображение уровней открытых позиций. Имитация установки/отмены/редактирования отложенных ордеров непосредственно в отображаемом стакане.
Особенности работы индикатора Отображение стакана заявок работает только на тех торговых символах, для которых он транслируется брокером. Для обнуления информации о строках, которые были зафи
FREE

Должна была состояться прибыльная сделка и вдруг отменилась? При наличии надежной стратегии выход из сделки также важен, как и вход. Exit EDGE помогает максимально увеличить доход от текущей сделки и не потерять выигрышные сделки.
Всегда будьте внимательны к сигналу на выход из сделки
Отслеживайте все пары и тайм-фреймы в одном графике www.mql5.com/en/blogs/post/726558
Торговля
Вы можете закрыть уже открытые сделки, как только получите сигнал Закрывайте заявку на покупку, если вы получили си
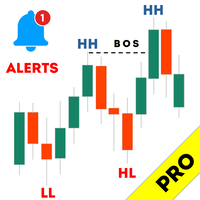
Haven Market Structure PRO - Ваш Профессиональный Аналитик Рынка Представляем Haven Market Structure PRO – это не просто индикатор, а полноценная система для автоматизации анализа ценового движения, основанная на ключевых концепциях Price Action и Smart Money. Эта PRO-версия была создана для трейдеров, которые хотят получить максимальный контроль над графиком и видеть полную картину рынка. Другие продукты -> ЗДЕСЬ . Понимание структуры рынка — это фундамент прибыльной торговли. Индикатор а

This is Wilder's ADX with cloud presentation of DI+ & DI- lines. Features
4 standard lines of the ADX indicator: DI+, DI-, ADX, ADXR cloud presentation of DI+/DI- lines with transparent colors applicable to all time-frames and all markets
What Is ADX
J. Welles Wilder Jr., the developer of well-known indicators such as RSI, ATR, and Parabolic SAR, believed that the Directional Movement System, which is partially implemented in ADX indicator, was his most satisfying achievement. In his 1978 book,
FREE

Auto Candle Sequence Counter – Индикатор для MT5 Обзор
Auto Candle Sequence Counter — это профессиональный индикатор для MetaTrader 5, который автоматически определяет и выделяет последовательности бычьих и медвежьих свечей. Вместо ручного подсчета, инструмент отображает сигналы в реальном времени, предоставляет статистику и уведомления, помогая трейдерам анализировать ценовое движение. Основные функции Определение последовательностей от 2 до 7 свечей (бычьих/медвежьих). Точная разметка без пр
FREE

Данный индикатор предназначен для отображения фракталов на ценовом графике, помогая трейдерам выявлять важные локальные экстремумы. Фракталы представляют собой особые точки на графике, которые соответствуют классическому определению: локальный максимум формируется, если центральная свеча выше двух соседних с обеих сторон, а локальный минимум — если центральная свеча ниже двух соседних. Другие продукты -> ЗДЕСЬ Основные возможности и преимущества : Гибкость отображения — индикатор позволяет визу
FREE

TB5 Channel — это канальный мультитаймфреймный индикатор. Который генерирует точки входа на разных таймфреймах. Предусмотрено 2 способа построения индикатора. Первый способ — это установка индикатора по текущему таймфрейму. В данном случае у вас построится канал по тому таймфрейму, который у вас открыт в МТ5. Второй способ построения индикатора – это умножение на индекс таймфрейма. Суть второго метода - построить на текущем графике канал старшего таймфрейма. Например, если вам надо построить

This indicator belongs to the family of channel indicators. These channel indicator was created based on the principle that the market will always trade in a swinging like pattern. The swinging like pattern is caused by the existence of both the bulls and bears in a market. This causes a market to trade in a dynamic channel. it is designed to help the buyer to identify the levels at which the bulls are buying and the bear are selling. The bulls are buying when the Market is cheap and the bears a

Market profile was developed by Peter Steidlmayer in the second half of last century. This is a very effective tool if you understand the nature and usage. It's not like common tools like EMA, RSI, MACD or Bollinger Bands. It operates independently of price, not based on price but its core is volume. The volume is normal, as the instrument is sung everywhere. But the special thing here is that the Market Profile represents the volume at each price level.
1. Price Histogram
The Price Histogram i

The Super Trend is one of the best trend-following indicator for MT5 platforms. It's working fine for real-time trend alerts and accurate signals and it help to identify the best market entry and exit positions. This indicator is the tool you can refers to a trend following overlays. It contains two major parameters: the period and the multiplier. Besides, traders should consider default values that include 10 for every true range aтd 3 for the multiplier. 2 Types TP SL you set in input Point
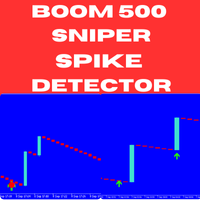
Introducing the Boom 500 Sniper Spike Detector – an advanced, non-repainting indicator specifically crafted to help you capture spikes in the Boom 500 market with precision. Whether you are an experienced trader or just starting, this indicator provides reliable signals that simplify spike trading, making it an essential addition to your trading arsenal. Key Features: Non-Repainting Signals : The Boom 500 Sniper Spike Detector generates highly reliable signals that do not repaint, allowing you t

Цветной ROC с скользящей средней и оповещениями - Продвинутый индикатор импульса Улучшенный Rate of Change (ROC)! Этот пользовательский индикатор для MetaTrader 5 предлагает ясный и интуитивный вид импульса рынка, идеальный для трейдеров, ищущих точные сигналы ускорения или замедления тенденций. Что такое ROC и его преимущества? Rate of Change (ROC) — это чистый осциллятор импульса, который измеряет процентное изменение цены по отношению к предыдущему периоду. Он подчеркивает скорость и силу цен

The Hull Moving Average is not very well know in novice and maybe in intermediate trading circles, but it is a very nice solution created by the trader Alan Hull - please visit www.AlanHull.com for full details of his creation. The purpose of this moving average is to solve both problems that all famouse and common moving averages have: Lag and Choppiness . The implementation we did has, apart of the Period configuration and Price type to use in the calculations, a "velocity" factor, which could
FREE

Индикатор Ultimate Boom and Crash
Индикатор Ultimate Boom and Crash – это передовой инструмент, разработанный Coetsee Digital, предназначенный для выявления потенциальных всплесков на рынке. Создан для трейдеров, работающих с синтетическими рынками Deriv и Weltrade. Индикатор оптимизирован для работы исключительно на таймфреймах 3 минуты (M3), 5 минут (M5), 15 минут (M15), 30 минут (M30) и 1 час (H1) и поддерживает только следующие пары: PainX 1200, PainX 999, PainX 800, PainX 600, PainX 400, G

Bar Countdown is a simple indicator for MetaTrader 5 that shows the time remaining of the each candle. It can be placed in any corner of the chart or near of the price close and it'll help you to know
if the current candle is ending. Choose the counter format between HR:MIN:SEC and MIN:SEC It is so easy to use, configure the color, size and counter position on the chart and that's it!!! The Countdown starts now!
Updates: 2021/02/28; v1.0: Initial release 2021/03/16; v1.1: Minor code changes
FREE
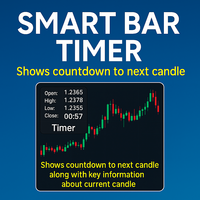
Улучшенный таймер свечей — это универсальный и настраиваемый индикатор для MetaTrader 5 (MT5), предоставляющий информацию в реальном времени о текущей свече, включая таймер обратного отсчета до следующей свечи, данные о свече, объем и спред. Индикатор отображается в выбранном пользователем углу окна графика и предлагает многострочный или однострочный формат, позволяя трейдерам следить за ключевыми рыночными данными с одного взгляда, улучшая процесс принятия решений и эффективность торговли. Осно
FREE

Это очень простой индикатор, которым может пользоваться каждый. Тем не менее, это очень наглядно, полезно и эффективно. Он подходит для каждого символа Форекс и любого таймфрейма. Но из своего тестирования и исследования, я не рекомендую использовать его с таймфреймами М1, М5, М15.
Параметр.
- Выберите оповещение Вкл/Выкл (по умолчанию ВКЛ).
- Выберите время (секунды) между 2 предупреждениями. По умолчанию 30 секунд
Как это работает?
- Восходящий тренд — когда цвет бара зеленый. - Нисходящ
FREE

This wonderful tool works on any pair producing alerts whenever the market enters the overbought and oversold zones of the market. The signals come as BUY or SELL but it does not necessarily mean you should go on and execute order, but that you should begin to study the chart for potential reversal. For advanced signal tools check out some of our premium tools like Dual Impulse.
FREE

Dark Inversion is an Indicator for intraday trading. This Indicator is based on Counter Trend strategy but use also Volatility. We can enter in good price with this Indicator, in order to follow the inversions on the current instrument. Hey, I made an Expert Advisor based on this indicator, if you are interested: Dark Titan MT5
Key benefits
Easily visible Inversion Lines Intuitive directional arrows Automated adjustment for each timeframe and instrument Easy to use even for beginners Never r
FREE

Индикатор визуальной линии прибыли в валюте депозита. Работает только при наличии открытых позиций в рынке по символу на котором установлен индикатор. Линию можно двигать мышкой или включить автоматическое следование за ценой Bid. Описание настроек индикатора: colotLine - цвет линии WidthLine - толщина линии colotText - цвет текста FontSize - высота текста Anchor - способ привязки для текста FollowBid - следовать за ценой Bid
FREE

Получите БЕСПЛАТНЫЙ индикатор AUX, поддержку EA и полное руководство, посетив – https://www.mql5.com/en/blogs/post/763955 Определи тренд. Прочти паттерн. Выбери момент входа. 3 шага менее чем за 30 секунд! Торгуйте легко — никакого анализа не требуется. Ваш умный помощник готов упростить ваш рабочий процесс Больше никакой перегрузки графиков. Торгуйте уверенно с помощью интеллектуального определения направления. Совместим со всеми валютами, криптовалютами, акциями, металлами, индексами и любыми

Divergence Force 1.0 Индикатор Дивергенции Описание Divergence Force - это индикатор, предназначенный для идентификации дивергенций между ценой актива и MACD (Moving Average Convergence Divergence). Этот индикатор автоматически рисует линии тренда на максимумах и минимумах цены и MACD, выделяя потенциальные торговые возможности. Основные функции Автоматическая идентификация дивергенций : Индикатор автоматически обнаруживает бычьи и медвежьи дивергенции между ценой и MACD. Отслеживание линий тр
FREE

Understanding the levels of the previous day or week is very important information for your trading.
This indicateur allow to draw Previous day High/Low Previous week High/Low
Congifuration High & Low for: Previous day, week Line Style, color Label position, size, color Any questions or comments, send me a direct message here https://www.mql5.com/en/users/mvonline
FREE
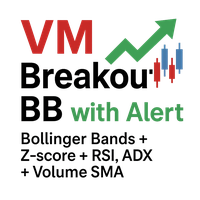
VM Breakout BB: Индикатор пробоев на основе вероятности с полосами Боллинджера VM Breakout BB — индикатор детекции пробоев, основанный на полосах Боллинджера в сочетании со статистическим анализом вероятности (Z-оценка и нормальная функция накопленного распределения, CDF) и умными фильтрами подтверждения, такими как RSI, ADX и скользящая средняя объёма (Volume SMA). Индикатор призван давать сигналы с чёткой статистической основой, сокращать шум и подтверждать пробои с более высокой вероятностью
FREE
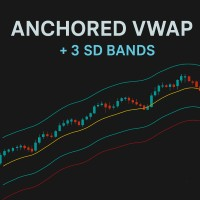
Anchored VWAP (AVWAP) с полосами стандартного отклонения – MT5 Поднимите свой трейдинг на новый уровень с точными Anchored VWAP, дополненными динамическими полосами стандартного отклонения. Разработано для трейдеров, которым важны скорость, ясность и практические рыночные инсайты. Основные функции: Несколько якорей: Размещайте неограниченное количество VWAP с индивидуальными датами и временем начала. Расширенные полосы Std Dev: До 3 полос на VWAP с полностью настраиваемыми множителями для деталь
FREE

Product: Phantom Shadow Reversal Engine Version: 3.0 (Elite Edition) Developer: Trade With Thangam
THE ULTIMATE SCALPING TOOL FOR XAUUSD & MAJOR PAIRS
The Phantom Shadow Reversal Engine is not just another indicator; it is a complete trading system designed for precision scalping and day trading.
Instead of relying on lagging signals, this system uses a "Proprietary Shadow Engine" that analyzes Market
FREE

Time Session OPEN-HIGH-LOW-CLOSE This Indicator Will Draw Lines Of OHLC Levels Of Time Session Defined By User. It Will Plot Floating Lines On Current Day Chart. Time Session Can Of Current Day Or Previous Day. You Can Plot Multiple Session Lines By Giving Unique ID To Each Session. It Can Even Show Historical Levels Of Time Session Selected By User On Chart To Do Backdating Test. You Can Write Text To Describe The Lines.
FREE

Простой индикатор, который автоматически выделяет все образующиеся на графике FVG, а также FVG на истории. Есть возможность выбрать цвета для FVG разного направления (лонг или шорт), выбор временого промежутка, выбор цвета средней линии, а также можно выбрать удалять ли заполненные FVG или оставлять их на графике (опция полезна для проведения бэктеста). Индикатор станет незаменим для тех, кто торгует по концепции Smart Money, ICT или просто иcпользует паттерн FVG в своей торговле.
FREE
MetaTrader Маркет предлагает каждому разработчику торговых программ простую и удобную площадку для их продажи.
Мы поможем вам с оформлением и подскажем, как подготовить описание продукта для Маркета. Все продаваемые через Маркет программы защищаются дополнительным шифрованием и могут запускаться только на компьютере покупателя. Незаконное копирование исключено.
Вы упускаете торговые возможности:
- Бесплатные приложения для трейдинга
- 8 000+ сигналов для копирования
- Экономические новости для анализа финансовых рынков
Регистрация
Вход
Если у вас нет учетной записи, зарегистрируйтесь
Для авторизации и пользования сайтом MQL5.com необходимо разрешить использование файлов Сookie.
Пожалуйста, включите в вашем браузере данную настройку, иначе вы не сможете авторизоваться.