Смотри обучающее видео по маркету на YouTube
Как купить торгового робота или индикатор
Запусти робота на
виртуальном хостинге
виртуальном хостинге
Протестируй индикатор/робота перед покупкой
Хочешь зарабатывать в Маркете?
Как подать продукт, чтобы его покупали
Технические индикаторы для MetaTrader 5 - 27

Indicador com regra de coloração para estratégias que utilizam Inside Bar! Quando rompe a barra inside, se for para cima, compra e posiciona o stop loss na mínima da barra inside. Se romper para baixo, vende e posiciona o stop loss na máxima da barra inside. Pode ser aliada a tendências de outros tempos gráficos e outros filtros.
Grupo de sinais gratuito no telegram: https://t.me/InsideBarRST
FREE

Title: Price Time Pro Monitor – The Ultimate Multi-Dimensional Chart Guardian Stop cluttering your screen with basic labels. Price Time Pro Monitor is not just another price and countdown tool; it is a sophisticated data engine designed for professional traders who demand precision and multi-timeframe awareness at a single glance. Why is this different from standard indicators? Smart RSI Engine (Multi-TF): Monitor RSI levels for M15, H1, and H4 directly on your current chart. No more switc
FREE

The TRIXs Indicator is the combination of the TRIX (Triple Exponential Moving Average) indicator with the addition of a SMA (Simple Moving Average) signal. It provides signs of trend continuity and the start of a new trend.
The entry and exit points of operations occur when the indicator curves cross.
It performs better when combined with other indicators.
FREE

DoubleMACD DoubleMACD DoubleMACD DoubleMACD DoubleMACD DoubleMACD DoubleMACD DoubleMACD DoubleMACD DoubleMACD DoubleMACD DoubleMACD DoubleMACD DoubleMACD DoubleMACD DoubleMACD DoubleMACD DoubleMACD DoubleMACD DoubleMACD DoubleMACD DoubleMACD DoubleMACD DoubleMACD DoubleMACD DoubleMACD DoubleMACD DoubleMACD DoubleMACD DoubleMACD
FREE
Eternal Spike Detector Pro - M5 Mastery System
HOW TO TRADE THIS SYSTEM
TRADING RULES
For CRASH 500/900/1000:
SELL SETUP:
· Wait for RED DOWN ARROW to appear · Enter SELL at the close of the M5 candle where arrow appears · Stop Loss: 1.5x ATR above the entry high · Take Profit: 2-3x ATR below entry · Only trade maximum 7 signals per day
For BOOM 500/900/1000:
BUY SETUP:
· Wait for GREEN UP ARROW to appear · Enter BUY at the close of the M5 candle where arrow appears · Stop Loss: 1.5

Индикатор Price Action Finder Multi это индикатор точек входа, который ищет и отображает паттерны системы Price Action сразу на десятках торговых инструментов и на всех стандартных таймфреймах: (m1, m5, m15, m30, H1, H4, D1, Wk, Mn). Найденные паттерны индикатор помещает в таблицу в нижней части экрана. Кликая на названия паттерна в таблице вы можете перемещаться на график, где этот паттерн находится. Инструкция/Мануал ( Обязательно читайте перед приобретением ) | Версия для МТ4 Преимущества
1.

«„Naturu“ — это ручной индикатор, который использует симметрию природы в качестве алгоритма.
Овладейте рынком с помощью простой стратегии и скрытой мудрости! При загрузке индикатора вы увидите две линии — Верхнюю (Top) и Нижнюю (Bottom).
Нажмите на линию один раз, чтобы активировать её. Чтобы переместить её, просто кликните на ту свечу, куда хотите её поставить. Вы задаёте точку максимума и точку минимума, а индикатор автоматически рассчитывает: магентовую зону, показывающую, где интересы быков

Logic Trade Solution Indicator (Standalone)
Idea by Suresh Dhuraisami | Code by Rafilathif Description The Logical Trading System (LTS) is a powerful multi-timeframe indicator for MetaTrader 5, designed around the concept of Valid Reversal Zones (VRZ). It generates precise trading signals and delivers comprehensive alerts, ideal for traders who value structured price action and zone-based strategies. Key Features VRZ Zone Detection: Identifies high-probability reversal zones using swing hig
FREE

BullBear Strength Meter The BullBear Strength Meter is a dynamic market sentiment and momentum indicator that quantifies the real balance of power between buyers and sellers. Instead of relying on a single formula, it fuses multiple proven analytical engines into one comprehensive strength model — giving traders an accurate visual readout of bullish and bearish dominance in real time. This tool measures, compares, and displays the intensity of market forces using advanced statistical and trend-b
FREE

Данный индикатор отображает график крестики-нолики (графики PnF) в окне индикатора. Такие графики показывают только те изменения цены, что больше указанной величины порога (размера клетки). Это позволяет скрыть шум и сконцентрироваться на основных трендах. Время здесь не берется в расчет. Учитывается только движение цены. Вот почему график крестики-нолики не синхронизируются с основным графиком, к которому он прикреплен. Более подробную информацию о графиках крестики-нолики можно узнать в Википе
FREE

1. Overview Thank you for choosing the Trend Maximizer. This tool is designed for technical analysis within the MetaTrader 5 platform. It is a sophisticated trend-following indicator that helps traders identify the prevailing market trend and can also function as a dynamic, trailing stop-loss level. The core of the indicator is based on a combination of a user-selected Moving Average (MA) and the Average True Range (ATR) indicator. By analyzing the relationship between the MA and the calculated
FREE

Synthetic Reverse Bar - индикатор является эволюционным развитием индикатора Reverse Bar . Известно, что свечные паттерны лучше всего работают на старших таймфреймах (H1, H4), однако из-за различия терминального времени у разных брокеров по одному и тому же инструменту свечи на старших таймфреймах могут формироваться по-разному, при том что история котировок на M1 и M5 будет совпадать! Из-за этого удачные паттерны на старших таймфреймах часто просто не формируются! Synthetic Reverse Bar решает д

Channels indicator does not repaint as its based on projecting the falling and raising channels. As a trader you need a path to be able to place your buy and sell trades such as: Supply and Demand , Falling & raising channels. Falling and raising channels can be in any time frame and also can be in all time frames at the same time and the price always flows within these channels. Experienced trades will draw the key levels and channels around the time frames. But, they will not be able to draw
FREE

**“Multi Trendline Channel With Regression Bands” – Каналы линейной регрессии + полосы стандартного отклонения (MT5)**
Этот индикатор автоматически строит многопериодные каналы линейной регрессии вместе с полосами стандартного отклонения, обеспечивая трейдерам мгновенную ясность относительно направления тренда, ценового разброса и ключевых зон поддержки/сопротивления. Преобразуя сложный анализ в простую и интуитивную визуализацию, он даёт дискреционным трейдерам чёткое понимание рыночного ко
FREE

XE Forex Strengh Indicator MT5 displays visual information about direction and strength of a signal for current pair and chosen timeframes (M5, M15, M30 and H1). Calculations are based on multiple factors and results are shown as a colored panel with scale bar, numerical values and arrows. There are also displayed values of current price and spread on the pair. There can be activated an alert (as a mail or pop-up window with sound) for each available timeframes which send a message when the dir
FREE

Stretch - это ценовой паттерн Тоби Крабела , который представляет собой минимальное среднее движение/отклонение цены от уровня открытия в течение некоторого периода времени, и используется для расчета двух уровней пробоев для каждого торгового дня. Он рассчитывается как 10-периодная SMA от абсолютной разницы между ценой открытия и High или Low, в зависимости от того, у которого из них меньше разница. Это значение используется расчета порогов пробоя для текущей торговой сессии, которые отображают
FREE

The Stochastic Oscillator is one of the main indicators used in the analysis of financial assets. It is one of the highlights in the study of price movements and can be an important indicator of changing trends in the capital market. Stochastic is an oscillator used to identify when an asset is overbought or oversold. It consists of two lines: %K, which is calculated from the highs and lows of a period, and %D, which is a moving average of %K. Our version contains color filling, which facilitate
FREE

CYCLE WAVE OSCILLATOR indicator is an indicator based on cyclical price fluctuations. This indicator can help you determine overbought and oversold levels, and help you predict price trends within the cycle. MT4 Version here! You can combine it with our indicators below to make your trading decisions more accurate: Supply Demand Ribbon MT5 Basic
Feature: - Three Trend Types: + Zero + Basic + Advanced
FREE

This indicator is very useful in observing the direction of the market. It allows users to enter multiple MA lines with specific display method. In addition, it is also possible to change the candle color same to color of the background of chart, so that we only focus on the MA lines. When a signal appears, represented by a red or green dot, we can consider opening a sell (red dot) or buy (green dot) order. Note: it need to set stoploss at the highest value of MA lines (with sell order) or lowe
FREE

PriceActionMatrix - Помощник по скальпингу с распознаванием нескольких паттернов PriceActionMatrix — это индикатор для скальпинга, который автоматически обнаруживает и проверяет множество краткосрочных паттернов Price Action. Вместо того чтобы представлять каждую свечу как отдельный сигнал, инструмент объединяет такие паттерны, как Пин-бар, Поглощение, Внутренний бар, зоны консолидации и тени отказов, а затем подвергает их настраиваемым уровням подтверждения — проверка тренда и EMA, диапазон AT

Трендовые индикаторы являются одними из направлений технического анализа для применения в торговле на финансовых рынках.
Индикатор Angular Trend Lines - комплексно определяет трендовое направление и формирует сигналы для входа. Помимо сглаживания среднего направления свечей
в нем используется еще и угол наклона трендовых линий. В качестве основы угла наклона был взят принцип построения углов Ганна.
В техническом анализе индикаторе совмещено свечное сглаживание и геометрия графика.
Есть два ти

Это четкий индикатор для оценки максимумов и минимумов, и он хорошо работает для колеблющегося рынка.
Акционная цена 49$ → 59$
функции хорошо оценивает верх и низ Без перерисовки, без дрейфа Быстрый расчет, без задержек Богатый режим напоминания Можно настроить несколько параметров и цветов
параметр "======== Главная ========" HighLowPeriod1 = 9 HighLowPeriod2 = 60 HighLowPeriod3 = 34 HighLowEMAPeriod = 4 MASignalPeriod = 5 "======== Уведомить ========" UseAlertNotify = истина; UseMetaQuotes

AT Break - Smart Breakout Points Indicator General Description The AT Break indicator is an advanced technical analysis tool for the MetaTrader 5 platform, designed based on detecting breakouts of resistance and support levels. This indicator uses sophisticated algorithms to identify potential entry and exit points and displays them visually on the chart. Main Settings Parameter Description Range/Options Default Price Type Determines the price type used for calculations Close, Open, High, Lo
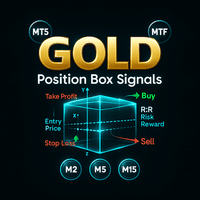
Gold Position Box Signals Pro v3.1 – Многофреймовый технический индикатор для XAUUSD
Обзор Gold Position Box Signals Pro v3.1 — это пользовательский индикатор для MetaTrader 5, разработанный для торговли XAUUSD. Он сочетает пересечения скользящих средних, уровни стоп-лосс/тейк-профит на основе волатильности, визуализацию позиций и многофреймовый анализ тренда. Инструмент помогает трейдерам находить потенциальные точки входа и управлять сделками с помощью наглядного отображения на графике.
Осн

Этот мульти-таймфрейм и мультисимвольный индикатор сканирует пин-бары, утренние / вечерние звезды, поглощения, пинцет, трехлинейные удары, внутренние бары, а также вымпелы и треугольники. Индикатор также можно использовать в режиме одиночного графика. Подробнее об этой опции читайте в разделе продукта. блог . В сочетании с вашими собственными правилами и методами этот индикатор позволит вам создать (или улучшить) вашу собственную мощную систему. Функции
Может одновременно отслеживать в

This MetaTrader 5 indicator identifies and visually displays the trading hours of major financial markets (Europe, US, and Asia) on the chart. Through customizable colored fills, it marks the trading periods of each market, respecting server times (GMT+2) and excluding weekends. Market names are displayed near the top of the chart in Arial Black font, also with customizable color. The indicator automatically adjusts to the chart scale, maintaining the fill across its entire vertical range.
FREE

Apex WilliamsR MT5 Looking for sharper entries? This indicator provides the foundation for visual price action. However, specialized markets require specialized tools. If you trade Gold or Indices, check out Gold Master Indicator or Nasdaq Master Indicator , specifically optimized for those assets' unique volatility. Don't just trade; trade with the right edge.
Apex Williams %R MT5 is a professional technical indicator that enhances the traditional Williams %R oscillator with advanced momentum
FREE

MarketCrack – Whale Detector: Взаимодействие с умными деньгами MarketCrack – Whale Detector — это профессиональный индикатор, разработанный для визуального и заблаговременного обнаружения активности крупных участников рынка, известных как «киты». Его цель — выявлять ключевые моменты значительного институционального давления, позволяя трейдеру следовать направлению «умных денег» и принимать стратегические решения с большей уверенностью. Функциональность и цель MarketCrack – Whale Detector анализи

Описание :
мы рады представить наш новый бесплатный индикатор, основанный на одном из профессиональных и популярных индикаторов на рынке форекс (PSAR), этот индикатор является новой модификацией оригинального индикатора Parabolic SAR, в индикаторе pro SAR вы можете видеть пересечение между точками и графиком цены, это пересечение не является сигналом, а говорит о возможности окончания движения, вы можете начать покупать с новой синей точки, и разместить стоп-лосс за один атр до первой синей т
FREE

Индикатор Body Ratio для MT5 – Анализ силы свечей и сжатия диапазона Индикатор Body Ratio — это технический инструмент для анализа структуры свечей и определения рыночных условий на основе соотношения тела свечи (открытие – закрытие) к её полному диапазону (максимум – минимум). Этот простой, но мощный расчёт помогает трейдерам определять свечи с сильным направленным движением, свечи неопределённости и фазы сжатия диапазона, которые часто предшествуют сильным пробоям. Каждая свеча классифицирует
FREE

aИндикатор Gann Box — это мощный и многофункциональный инструмент, разработанный для помощи трейдерам в выявлении и использовании ключевых уровней на рынке. Этот индикатор позволяет нарисовать на графике прямоугольник, который автоматически разделяется на несколько зон со стратегическими уровнями 0, 0.25, 0.50, 0.75, 1 . Когда цена касается одного из этих уровней, срабатывают предупреждения, что является ценным помощником в принятии торговых решений. Вы мгновенно видите, как развивается рынок п

LogVar — это индикатор, который вычисляет и отображает логарифмическое изменение цены , более точный способ измерения процентных изменений между периодами. Он сравнивает текущую цену закрытия с ценой закрытия n периодов назад (параметр iPeriod ) и отображает результат на увеличенной логарифмической шкале, что упрощает визуализацию силы и направления движения. Цвет линии меняется автоматически в зависимости от знака изменения: Зелёный: цена выше логарифмического эталона (восходящий тренд). Красны
FREE

Данный индикатор повторяет широко известную версию индикатора для MetaTrader 4, который есть в интернете в свободном доступе. Индикатор не перерисовывается. Индикатор реализует стратегию прорыва. Стрелки показывают направления рынка. Используйте индикатор на интервалах от M15 и выше. Индикатор рисует две полосы возле ценового действия и генерирует сигналы при закрытии цены под нижней и над верхней полосой. Для расчета нижнего и верхнего порога полос индикатор использует периодические максимумы и
FREE

Easy Correlations Indicator The Easy Correlations Indicator is designed to help traders analyze the relationship between two correlated instruments. By monitoring the distance between their Relative Strength Index (RSI) values, the indicator highlights situations where one instrument has moved significantly further than the other. This creates potential trading opportunities: Sell the stronger instrument (overstretched RSI) Buy the weaker instrument (lagging RSI) Because the positions are opened
FREE

Adiciona marca d'água com nome do ativo em negociação. Pode ser ajustado definindo tamanho da fonte e coloração do texto. Testado com vários ativos do mercado B3 e Forex Adione ao gráfico e configure de acordo com a necessidade. Caso tenha problemas sinta-se a-vontade para nos avisar e providenciaremos a correção logo que possível. ______________________________
FREE
If you love this indicator, please leave a positive rating and comment, it will be a source of motivation to help me create more products <3 Key Takeaways StochRSI is an oscillator that measures the RSI level relative to its high-low range over a period of time. It is more sensitive than the traditional RSI and can highlight overbought or oversold conditions in the market. StochRSI is typically used to generate more frequent and timely trading signals compared with the traditional RSI. StochRSI
FREE
MultiFrame Pivot: A Multi-Timeframe Analysis Tool MultiFrame Pivot is an analysis indicator designed to provide an overview of the market based on Pivot Points across multiple timeframes. The indicator synthesizes information from different timeframes to give you a more comprehensive view of important price levels. KEY FEATURES: Multi-Timeframe Analysis: MultiFrame Pivot allows you to simultaneously monitor the price's status relative to Pivot Points (PP), Support 1 (S1), and Resistance 1 (R1)
FREE

Индикатор "Envelope of Adaptive Moving Average" является инструментом, который поможет вам принимать информированные решения на финансовом рынке. Он разработан для предоставления вам четкой картины направления тренда и потенциальных точек входа и выхода в ваших сделках. Этот индикатор основан на адаптивном скользящем среднем, что означает, что он автоматически корректируется под изменения в волатильности рынка. Это делает его особенно полезным на рынках, которые могут быть как спокойными, так и
FREE

Highly configurable RSI indicator. Features: Highly customizable alert functions (at levels, crosses, direction changes via email, push, sound, popup) Multi timeframe ability Color customization (at levels, crosses, direction changes) Linear interpolation and histogram mode options Works on strategy tester in multi timeframe mode (at weekend without ticks also) Adjustable Levels Parameters:
RSI Timeframe: You can set the current or a higher timeframes for RSI. RSI Bar Shift: you can set the
FREE
Description (English) EMA 5-20-200 Cross Alerts (Fixed Alerts, No Repaint) This indicator combines three popular EMAs (5, 20, and 200) to help traders identify short-term, mid-term, and long-term trends.
With visual arrows on the chart and automatic alerts (popup & push notification) , it allows traders to catch entries and trend confirmations without constantly monitoring the screen. Key Features: Plots EMA 5, EMA 20, and EMA 200 directly on the chart. Generates Buy/Sell signals (EMA5 vs
FREE
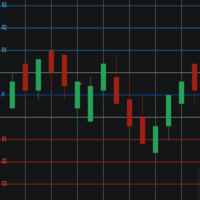
Pivot Points Levels Description The Pivot Points Levels indicator is an advanced and comprehensive tool for technical analysis based on support and resistance levels calculated from pivot points. This free indicator combines 6 different calculation methods with support for multiple timeframes, offering a robust solution for identifying key price reversal and continuation areas. Key Features 6 Calculation Methods : Traditional, Fibonacci, Woodie, Classic, DeMark (DM), and Camarilla Multi-Timefram
FREE

HiLo Ladder — это переосмысление классического индикатора HiLo , который широко используется трейдерами для определения трендов и возможных точек разворота на рынке. В отличие от традиционной версии, HiLo Ladder отображается в виде ступенчатого формата — популярных «лесенок» , что делает движение цены гораздо более наглядным и простым для анализа. Основные преимущества: Упрощённая визуализация фаз роста (зелёный) и падения (красный). Более интуитивный анализ без потери сути классического HiLo
FREE

This indicator serves as an alert for climax regions.
How does it work? When the 20-period arithmetic moving average meets the 200-period arithmetic moving average, a conflict region forms with two major opposing forces fighting. This causes the price to show random peaks until a winner side is defined, which can be dangerous. Therefore, the indicator paints the region between the moving averages to alert you.
How to use it? It can be used for specific volatility or support and resistance str
FREE

This is an OLD indicator which was rather efficient to be paired with MA Cross, Bollinger Bands, Dochian Channel and many other strategies and this provides you with market change of BEAR and BULL trends. Since there isn't much listed in MT5 Market, I would like to share my very own indicator for your usage. Please feel free to comment or criticize for better and improvement of the indicator listed.
FREE

Fair Value Gaps (FVG) and Liquidity Voids are price ranges you can exploit for better entries and exits on your trades. They're similar concepts, so let's look at them from the top and break it down. Think of FVG and Liquidity voids as soft-spots in the market. They are paths of least resistance. That doesn't mean price will go through them, but price could go through them more easily.
To find and locate it is easy but tidiest to repeat the same thing all over again. This helps to boost your t
FREE
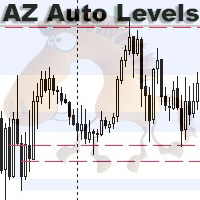
AZ Auto Levels builder ATR edition Indicator of automatic level drawing. For different instruments you need to play with the parameters to find the right ones. So, what is its idea - the indicator searches for levels of interest on the timeframe selected in the settings (by default H1). The search occurs only on candles that are 30% greater than the standard daily ATR of similar candles (you can change this in the settings). ATR is calculated for 20 days ago (also can be changed in the settings)
FREE

The Monthly Weekly Open Line is an indicator that plots: The current month open line that will extend till the last week on the month. Weekly lines that span the look back days period that you have set . Each line will extend from the respective weekly Monday zero GMT till friday of the respective week. Monthly and Weekly open lines can be used to build very powerfull anc consistent trading strategies. They act as natural S/R price barriers.
FREE

Welcome to the Minions Labs' reinterpretation of the Classic Bulls & Bears Power , developed by Alexander Elder a long ago. Since the 2 indicators: Bull Power and Bear Power were histogram-based indicators and having 2 indicators in the same chart and occupy too much screen, we decided to mix them into ONE Line and Color-based indicator, which give us all the information we need. The Bull & Bear Power indicators help you determine the strength of BUYERS (Bulls) vs. SELLERS (Bears). Basically, it
FREE

English
VWAP Daily (Clean) is a simple and lightweight indicator that plots the classic Daily VWAP (Volume Weighted Average Price) directly on your MT5 chart. Features: Classic Daily VWAP calculation Supports real volume (if available) or tick volume Timezone offset option to match your broker’s server time Weekend merge option (merge Saturday/Sunday data into Friday) Clean version → no arrows, no alerts, only VWAP line VWAP is widely used by institutional traders to identify fair value, su
FREE
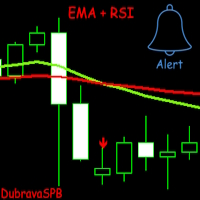
Представляем EMA + RSI – индикатор для торговли, который сочетает в себе анализ экспоненциальных скользящих средних (EMA) и индекса относительной силы (RSI) . При пересечении двух EMA и достижении RSI заданных условий индикатор сигнализирует о входе в сделку с помощью стрелок на графике. Индикатор изначально оптимизирован для валютной пары GBPUSD на таймфрейме 1H , однако пользователь может адаптировать его под свою стратегию. Основные характеристики : Гибкость настроек : пользователь может меня
FREE
If you like this product, please give it a 5 star rating as a token of appreciation.
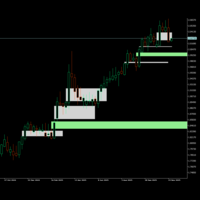
This indicator identifies and displays Fair Value Gaps (FVG) on price charts.
Fair Value Gaps are price zones where there's a significant imbalance between buying and selling pressure, creating "gaps" in price action. The indicator detects two types and when they are mitigated(touched):
Bullish FVG: When a candle's low is above the high of a candle two periods earlier.
Bearish FVG: When a candle's high is bel
FREE

Introduction
The SuperBands Indicator is a sophisticated technical analysis tool designed to provide traders with a clear visual representation of price movements within well-defined bands. This indicator is specifically engineered to filter out minor price fluctuations and market noise, offering traders a more accurate and reliable view of price trends and potential reversal points.
Signal
Buy when price breaks below the "Extremely oversold" band (darker red color) and then closes abo
FREE

Adaptive Session Trend Pro Easy Plug-and-Play Auto-Optimized Session Trend Indicator for MT5 Adaptive Session Trend Pro is a fully automatic, session-aware trend indicator for MetaTrader 5 that intelligently adapts to the symbol, instrument type, and broker trading session — with zero manual configuration required . Simply attach the indicator to any chart and it instantly: Detects the traded instrument (XAUUSD, US30, EURUSD, Forex pairs) Detects broker server time automatically Applies the cor
FREE

Индикатор контролирует уровень STOPLEVEL. При изменении уровня сигнализирует оповещением. STOPLEVEL - минимальный отступ в пунктах от текущей цены закрытия для установки Stop ордеров, или минимально допустимый уровень стоп-лосса/тейк-профита в пунктах. Нулевое значение STOPLEVEL означает либо отсутствие ограничения на минимальную дистанцию для стоп-лосса/тейк-профита, либо факт использования торговым сервером внешних механизмов динамического контроля уровней, которые не могут быть транслиро
FREE

https://www.mql5.com/en/users/gedeegi/seller
GEN (Trend Fib Zones) GEN (Trend Fib Zones) is a professional technical analysis indicator that automatically detects trend structure shifts using swing highs/lows and dynamically plots key Fibonacci retracement and extension zones. Key Features: Automatic Trend Structure Detection Identifies market structure changes using CHoCH (Change of Character) and BOS (Break of Structure) logic. Highlights trend direction based on real swing high/low pivo
FREE

Индикатор для визуализации временных диапазонов ключевых торговых сессий: Азиатской, Европейской и Американской. Индикатор обладает функционалом настройки времени начала и окончания каждой торговой сессии, а также устанавливаемой временной зоны торгового сервера. Основные преимущества индикатора включают возможность работы с минимальной загрузкой процессора и экономии оперативной памяти. Кроме того, предоставляется опция указания количества отображаемых исторических дней, обеспечивая пользовател
FREE

There is a science, named Quantitative Finance, that allows to study the financial derivative pricing models using the methods of theoretical and mathematical physics.
Lately I came across a paper that describes a new indicator for technical analysis that combines ideas from quantum physics and brings them to finance. I got interested in it and decided I would teach how to implement indicators based on a scientific papers in MQL5.
The original Moving Mini-Max paper [2] is written by Z.K. Silaga
FREE

DailyHiLo Indicator
Master the daily range like a pro. This indicator automatically plots the previous day’s high and low levels —a core element in the (Beat The Market Maker) trading approach—directly on your chart. These levels act as natural boundaries for intraday price action, helping traders identify potential reversal zones, breakout points, and liquidity targets. Key Features Accurate plotting of yesterday’s high and low for any symbol and timeframe. Works seamlessly with BTMM-inspired
FREE

TransitGhost Signal indicator, this is one of my best forex trading strategy. The strategy is based on the simple moving average cross, 5 SMA AND 200 SMA of which take a longer time to cross. Whenever the is a cross between the 5 SMA and 200 SMA a signal will be given, when the 5 SMA cross the 200 SMA to the upside ,a buying arrow will appear on chart, and push notification(alert) "Buy now, use proper risk management" will be sent on both the MT5 PC and mobile app, and when the 5 SMA cross the 2
FREE

За основу идеи алгоритма и отображения взят индикатор Currency Power Meter, отличия данной версии в снятии ограничений на количество отображаемых валют, код более компактный и быстрый, есть возможность получения значений для текущего бара через буферы индикатора. Что показывает индикатор : тонкая полоса и верхнее число напротив валюты показывает индекс относительной силы за последние N часов (N задаётся переменной Hours в параметрах), более широкая полоса показывает дневной индекс. Чем больше ва
FREE

Этот индикатор — простой, но очень надёжный определитель направления тренда, созданный для трейдеров, которые предпочитают чистые и точные сигналы без лишнего шума на графике. Основные особенности Стрелки для определения тренда – чёткие сигналы Buy/Sell, основанные на ценовом движении и трендовом потоке. Редкие, но точные сигналы – обычно около 1 сигнала в день, но с высокой точностью. Встроенные сигналы выхода – стрелки Exit показывают оптимальный момент для закрытия сделки. Без перерисовки – с

The Supertrend etradro indicator is volatility based and is more of a trend following indicator in function. The ATR indicator, which is integrated into the calculation of the super trend, also calculates course gaps (gaps) and does not overlook them. This allows more accurate values to be calculated. When measuring volatility, the mean value of the current price serves as the basis. Since the Supertrend indicator features sliding stop and reversal lines, it is quite similar in function to the P
FREE

Pivot Points Classic – L’indicatore essenziale per ogni trader tecnico Questo indicatore disegna automaticamente i livelli di Pivot Point più utilizzati dai trader professionisti, con supporto completo a 4 metodi di calcolo: Metodi supportati :
• Traditional
• Fibonacci
• Woodie
• Camarilla Caratteristiche principali :
Calcolo su timeframe superiore (multi-timeframe)
Visualizzazione chiara dei livelli P, R1, R2, R3, S1, S2, S3
Etichette dinamiche con nome e valore del livello
Colori per
FREE
The Hammer and Doji Scanner is a powerful technical analysis tool designed for MetaTrader platforms, such as MetaTrader 4 (MT4) and MetaTrader 5 (MT5), to detect and highlight key candlestick patterns, specifically the Hammer and Doji . These patterns are widely used by traders to identify potential trend reversals or periods of indecision in the market. Hammer: The Hammer is a bullish reversal candlestick pattern that appears after a downtrend. It is characterized by a small body near the top o
FREE

The Color Candles Indicator uses custom colors to highlight candles that follow the main market trend, based on the Moving Average. This simplifies the analysis of price movements, making it clearer and more direct. When the price is above the rising Moving Average, candles are highlighted indicating a BUY opportunity. When the price is below the declining Moving Average, candles are highlighted indicating a SELL opportunity.
Input Parameters : Period Method Applied Price
The moving averages
FREE

The Fisher Transform is a technical indicator created by John F. Ehlers that converts prices into a Gaussian normal distribution. The indicator highlights when prices have moved to an extreme, based on recent prices. This may help in spotting turning points in the price of an asset. It also helps show the trend and isolate the price waves within a trend. The Fisher Transform is a technical indicator that normalizes asset prices, thus making turning points in price clearer. Takeaways Turning poi
FREE

PRO VERSION https://www.mql5.com/en/market/product/144989?source=Site https://www.mql5.com/en/users/gedeegi/seller GEN Support & Resistance (EGGII77) is an MT5 indicator that automatically detects and draws Support & Resistance levels based on pivot highs and lows. The indicator features two sets of S&R (main structure and quick levels), a customizable maximum number of lines, adjustable colors, and a clean chart display for clearer price action analysis.
FREE

The Supertrend indicator is a very versatile and and accurate trend detection system. It can also be used an an reversal indicator. Therefor you can use it either as entry or as an exit signal. Depending on your settings it is also good for trend confirmation. This version is slightly enhanced from the original version from mladen. The Supertrend of Averages Histogram Version contains: 11 different price options Averaging period
18 different averaging types ATR period and ATR multiplier Shows re
FREE

Индикатор VeMAs — это инновационный торговый инструмент, предназначенный для улучшения вашей торговой стратегии за счёт анализа динамики объёма и рыночной структуры. Независимо от того, новичок вы или опытный трейдер, VeMAs дает вам преимущество. Индикатор VeMAs доступен всего за 50 $. Первоначальная цена индикатора 299 $ ПРЕДЛОЖЕНИЕ ОГРАНИЧЕННОЕ ПО ВРЕМЕНИ. Свяжитесь со мной после покупки для получения персонального бонуса! Вы можете получить абсолютно бесплатно крутую утилиту (VeMAs Utility MT
NeoBull Breakout Indicator - Профессиональный прорывной трейдинг стал проще NeoBull Breakout Indicator - это мощный технический индикатор для MetaTrader 5, специально разработанный для трейдеров прорывов. Он сочетает проверенные уровни Highest High/Lowest Low с трендовым фильтром SMA 200 для определения высоковероятных прорывных сетапов. Основные функции: * Ступенчатая линия Highest High (20) - Отображает наивысший максимум за последние 20 периодов в виде четкой горизонтальной линии (как в Trad
FREE
А знаете ли вы, почему MetaTrader Market - лучшее место для продажи торговых стратегий и технических индикаторов? Разработчику у нас не нужно тратить время и силы на рекламу, защиту программ и расчеты с покупателями. Всё это уже сделано.
Вы упускаете торговые возможности:
- Бесплатные приложения для трейдинга
- 8 000+ сигналов для копирования
- Экономические новости для анализа финансовых рынков
Регистрация
Вход
Если у вас нет учетной записи, зарегистрируйтесь
Для авторизации и пользования сайтом MQL5.com необходимо разрешить использование файлов Сookie.
Пожалуйста, включите в вашем браузере данную настройку, иначе вы не сможете авторизоваться.