Смотри обучающее видео по маркету на YouTube
Как купить торгового робота или индикатор
Запусти робота на
виртуальном хостинге
виртуальном хостинге
Протестируй индикатор/робота перед покупкой
Хочешь зарабатывать в Маркете?
Как подать продукт, чтобы его покупали
Технические индикаторы для MetaTrader 5 - 12

Volume Profile Trading System is NOT just another volume indicator. It's a complete trading ecosystem that combines professional volume profile visualization with an intelligent automated trading strategy. While other indicators show you WHERE volume is concentrated, Volume Profile Trading System shows you WHERE , WHEN , and HOW to trade it! displaying real volume distribution by price instead of time. It helps traders identify fair value zones, institutional activity, and high

Combination of Ichimoku and Super Trend indicators. 1. ARC (Average Range times Constant) The concept of ARC or Volatility System was introduced by Welles Wilder Jr. in his 1978 book, New Concepts in Technical Trading Systems . It has since been adapted and modified into the popular Super Trend indicator.
The fundamental idea behind ARC is simple: to identify support and resistance levels, you multiply a constant with the Average True Range (ATR) . Then, you either subtract or add the resulting
FREE

Este indicador traça uma reta baseada em regressão linear, esta reta é dinâmica e é atualizada a cada tick. O cálculo de regressão linear é feito considerando o número de candles definido pelo tamanho da janela fornecida pelo usuário. São traçadas duas linhas, uma superior e uma inferior, para guiar a estratégia do usuário, a distância dessas linhas para a linha central deve ser configurada. É possível definir os estilos, cores e espessuras de cada uma das linhas.
Esse indicador foi inicialmen
FREE

Индикатор Haiken Ashi для MT5 Улучшите свой торговый анализ с помощью индикатора Haiken Ashi для MT5. Этот мощный инструмент преобразует стандартные ценовые данные в более плавные, трендовые свечи, что упрощает идентификацию рыночных тенденций и потенциальных точек разворота. Ключевые особенности: Четкая идентификация тренда: Визуально различайте восходящие и нисходящие тренды по различным цветам свечей. Снижение шума: Фильтруйте ценовые колебания, обеспечивая более четкое представление об осно
FREE

WickSniper Pro – Precision Reversal Indicator for Smart Traders ===============================================================
WickSniper Pro is a powerful **non-repainting** price action indicator that detects **inside bar breakout reversals** with sniper-like accuracy. Whether you're a scalper, swing trader, or day trader, WickSniper Pro helps you catch high-probability turning points in the market using clean, intuitive signals.
Key Features ------------ - Non-Repainting – Once a signa
FREE
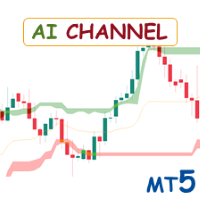
Special offer : ALL TOOLS , just $35 each! New tools will be $30 for the first week or the first 3 purchases ! Trading Tools Channel on MQL5 : Join my MQL5 channel to update the latest news from me Индикатор AI Channels использует скользящую кластеризацию K-means — мощный метод машинного обучения в анализе кластеров — для предоставления реальных данных о тенденциях цен. Этот индикатор создает адаптивные каналы на основе кластеризованных ценовых данных, что позволяет трейдерам прини
FREE
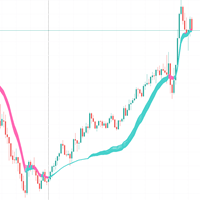
Understanding the RSI Adaptive EMA Indicator This code implements a custom trading indicator called "RSI Adaptive EMA" for MetaTrader platforms. It's a fascinating approach that combines RSI (Relative Strength Index) with an Exponential Moving Average (EMA) in a way that makes the EMA adapt based on market conditions.
Core Concept Traditional EMAs use a fixed smoothing factor (alpha), but this indicator creates a dynamic smoothing factor that changes based on RSI values. This allows the EMA lin
FREE

Панель таймера свечей Phoenix (MT5)
Таймер обратного отсчета свечей в реальном времени для MetaTrader 5. Отображает точное время, оставшееся до конца текущей свечи, чтобы улучшить время исполнения и дисциплину торговли.
Назначение
Точное время свечи имеет решающее значение для дискреционных трейдеров и алгоритмических стратегий. Слишком ранний или слишком поздний вход в сделку в пределах свечи может повлиять на риск, спред и достоверность сигнала.
Панель таймера свечей Phoenix обеспечивает ч
FREE

Выделяет торговые сессии на графике
Trading Sessions Indicator (Индикатор торговых сессий) отображает начало и окончание каждой торговой сессии.
Платная версия продукта Trading Sessions Indicator Pro с возможностью пользовательской настройки начала/окончания сессий >>>
[ОПЦИИ:] Timeshift - Используйте, если имеет место смещение сессий по времени
[Заданные параметры:] Asian session Open=0; Asian session Close=9; Asian session OpenSummertime=1; Asian session CloseSummertime=10; European sessi
FREE

### Индикатор Ultimate Pivot Levels для MetaTrader 5
Ultimate_Pivot_Levels — это универсальный инструмент, разработанный для улучшения вашего торгового опыта путем точного нанесения уровней пивотов на ваши графики. Он позволяет вводить желаемые значения вручную или использовать хорошо известные методы расчета пивотов для создания уровней пивотов. Индикатор рисует уровни на заднем плане и позволяет вам настраивать уровни, размер и цвета областей, сохраняя ваши корректировки при расширении уровне
FREE

This is a conventional volume indicator, which displays the ticks or real volume (if available from your broker). But it has others features like: 5 color schemes: single, when crossing with moving average, when crossing a specific level, when having different volume between bars and when candle change color. Being hable to have a customizable moving average. Being hable to have a value indicator line. Many thanks to Diego Silvestrin for the ideas to version 1.1 and Konstantin Demidov for
FREE

The original author is David Weis, an expert in the Wyckoff Method. The Weis Wave is a modern adaptation of the 1930's Wyckoff Method, another expert in Tape Reading techniques and Chart Analysis. Weis Waves takes market volume and stacks it into waves according to price conditions giving the trader valuable insights about the market conditions. If you want to learn more about this subject you can find tons of videos in YouTube. Just look for "The Wickoff Method", "Weis Wave" and "Volume Spread
FREE

Overview The TTM Squeeze indicator helps identify low volatility periods (squeeze) that often precede price breakouts. It uses Bollinger Bands (BB) and Keltner Channels (KC) to determine when the market is "coiling" and ready to move. Configuration Guide Volatility Settings The indicator uses Bollinger Bands to measure market volatility. When BBs are inside Keltner Channels, a squeeze is detected. The squeeze suggests the market is consolidating and may soon break out. True Range Option Optional
FREE
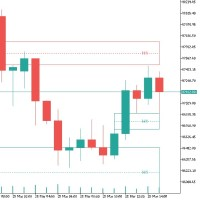
Имбаланс в трейдинге: основы и стратегии Имбаланс в трейдинге — это явление, при котором на рынке наблюдается дисбаланс между спросом и предложением. Это может проявляться как избыток ордеров на покупку (бычий имбаланс) или на продажу (медвежий имбаланс), что приводит к неэффективному ценообразованию и создает возможности для трейдеров. Технические аспекты - «Свечная Модель»: имбаланс часто представлен трехсвечной моделью, где вторая свеча длиннее остальных и определяет направление движения. - «
FREE

PO3 FIBONACCI GOLDBACH — Определяющий индикатор для анализа рынка
Раскройте секреты рынка с помощью идеального слияния передовой математики и интелтуального трейдинга!
---
ЭКСКЛЮЗИВНЫЕ ВОЗМОЖНОСТИ:
1. УНИКАЛЬНАЯ СИСТЕМА УРОВНЕЙ ГОЛЬДБАХА · Автоматическое определение Ордерных блоков (OB), Гэпов справедливой стоимости (FVG), Ликвидных пустот (LV) и Блоков митигации (MB). · Точный расчет уровней отторжения (RB) и зон равновесия (EQ) на основе гипотезы Гольдбаха. · Расширения на 1
The Trend Duration Forecast MT5 indicator is designed to estimate the probable lifespan of a bullish or bearish trend. Using a Hull Moving Average (HMA) to detect directional shifts, it tracks the duration of each historical trend and calculates an average to forecast how long the current trend is statistically likely to continue. This allows traders to visualize both real-time trend strength and potential exhaustion zones with exceptional clarity. KEY FEATURES Dynamic Trend Detection: Utiliz

Closing Price Reversal is a very well known and traded candlestick pattern. This little indicator paints with specific (user-selected) colors the Closing Price Reveral Up and Down patterns, as well as the Inside Bars (as a bonus). Higher timeframes are more effective as with all other candlesticks patterns. Do NOT trade solely on this indicator. Search the web for "Closing Price Reversal" to learn about the several approaches that can be used with this pattern. One of them is combining short/me
FREE

Это MQL5-версия индикатора MACD с нулевым запаздыванием, версия для MT4 которого доступна здесь: https://www.mql5.com/ru/code/9993 Также была опубликована цветная версия индикатора, но с ней были некоторые проблемы: https://www.mql5.com/ru/code/8703 Я исправил версию для MT4, содержащую 95 строк кода. На написание версии для MT5 у меня ушло 5 дней (включая чтение логов, несколько тестирование и поиск различий между MT5 и MT4!) В первой моей версии этого индикатора на MQL5 было 400 строк кода, но
FREE

Interactive AVWAP Pro — Анализ в стиле TradingView Interactive AVWAP Pro — это самый удобный индикатор Anchored Volume-Weighted Average Price (AVWAP) для MetaTrader 5/4. Забудьте о стандартных, неуклюжих инструментах. Мы перенесли интуитивную функциональность TradingView прямо в ваш терминал MT5/4. Преимущество Профессионального Инструмента Хватит загромождать графики вертикальными линиями и возиться с неудобными настройками. Interactive AVWAP Pro дает вам беспрецедентную скорость и точно

Повысьте точность своей торговли с индикатором WH Trading Sessions MT5 для MetaTrader 5! Этот мощный инструмент поможет вам визуализировать и управлять ключевыми рыночными сессиями без особых усилий. Основанный на на: Индикатор WH SMC MT5
Версия MT4: WH Trading Sessions MT4
Основные характеристики: Интерактивная панель графического интерфейса пользователя — легкий выбор и переключение между торговыми сессиями Азии, Лондона и Нью-Йорка .
Настраиваемые оповещения и настройки
FREE
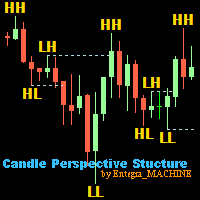
Candle Perspective Structure Indicator MT5 - это простой индикатор определяющий и отображающий свечную структуру рынка. Этот индикатор подойдет как опытным трейдерам, так и новичкам, которым тяжело визуально следить за структурой. Основные функции: Определение High и Low свингов используя паттерн трех свечей. Определение слома структуры. Настройка визуального отображения структурных элементов. Настройка периода, за который анализируется структура. Входящие параметры: General Settings Bars Back -
FREE

Развитие предыдущей версии индикатора ZigZag WaveSize MT4 ZigZag WaveSize - модифицированный стандартный индикатор ZigZag с добавлением информации о длине волны в пунктах, уровней и разной логики алертов
Общие улучшения: Адаптация кода под MetaTrader 5 Оптимизирована работа с графическими объектами Новое: Горизонтальные уровни на экстремумах Выбор типа уровней: горизонт/лучи/отрезки Фильтр ликвидных уровней (не пробитых ценой) Буфер для пробоев: настройка чувствительности к ложным пробоям На
FREE
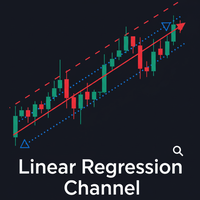
The Linear Regression Channel is a powerful technical analysis tool that helps visually identify the prevailing trend and potential price zones. Essentially, the indicator performs two main functions: It draws a trendline through the center of price action over a specified period. This line is calculated using the linear regression method, which results in the best possible "line of best fit" for the price data. From this center line, the indicator plots two parallel lines above and below, creat
FREE

Интегрированный сканер-панель – ваш командный центр на рынке (v2.0) Краткое описание: Хватит тратить время на ручное переключение десятков графиков. Интегрированный сканер-панель — это мощный мультисимвольный, мультитаймфреймовый сканер, который следит за каждым выбранным вами инструментом с одной панели. После серьезной архитектурной переработки версия 2.0 стала быстрее, стабильнее и мощнее, чем когда-либо. Получайте мгновенные визуальные оповещения о ценовых паттернах, дивергенциях и т

Zenith Session Flux is a professional-grade technical indicator for MetaTrader 5 designed to identify and visualize institutional trading windows known as ICT Killzones. The indicator automates the process of time-alignment by synchronizing your broker's server time with New York local time, ensuring that session boxes and price pivots appear at the precise institutional moments regardless of your broker's timezone. Indicator Features: Automatic Timezone Sync: Automatically calculates the offset
FREE

EmasFijas Multi-Timeframe EMA Indicator for MetaTrader 5 Product Description English: EmasFijas displays EMAs (Exponential Moving Averages) from any timeframe on your current chart. Perfect for multi-timeframe analysis without switching charts. Features an intuitive visual dropdown panel to quickly select any of the 21 available MT5 timeframes. Español: EmasFijas muestra EMAs (Medias Móviles Exponenciales) de cualquier temporalidad en tu gráfico actual. Perfecto para análisis multi-temporalidad

The Swing High Low Indicator is an essential tool for traders who rely on price action. It automatically marks key reversal points (swing highs in red, swing lows in green), helping you visualize trends, spot breakouts, and draw precise trendlines. By highlighting these critical levels, the indicator reveals market structure shifts—whether the trend is strengthening, reversing, or entering consolidation. Perfect for all timeframes and strategies, it turns raw price data into actionable tra
FREE

This indicator uses the Zigzag indicator to identify swing highs and swing lows in the price chart. Once it has identified the swing highs and swing lows, it can use them to determine potential support and resistance levels. A support level is formed when the price drops and bounces back up from a swing low, indicating that there is buying pressure at that level. A resistance level is formed when the price rises and reverses downward from a swing high, suggesting selling pressure at that level.
FREE

For those traders who really care about Volume as an important vector information on Price Action, here is an exclusive idea & creation from Minions Labs: Volume Speed . The Volume Speed indicator shows you visually how much time (in seconds, minutes, hours, you choose) the Volume took to reach the Average Volume of the past bars. This way you can have the exact idea of "what is happening right now with the Volume of the current bar..." and take action accordingly with your strategy, having even
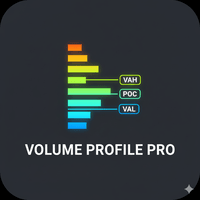
Daily & Composite Volume Profile This is a professional-grade market profile tool designed for MetaTrader 5. It utilizes a Dual-Profile System to visualize supply, demand, and liquidity concentrations. Key Features Left Side: Daily Session Profiles Automatically identifies the start and end of every trading day. Generates a unique Volume Profile for each individual day. Allows you to see how value migrated from yesterday to today (e.g., Is today's volume higher or lower than yesterday?).

Индикатор определяет направление движения цены, обсчитывает по внутренней формуле возможность входа в рынок и отображает сигнал входа на пробой. Сигналы индикатора появляются как при начале трендовых движений, так и в обратном направлении, что позволяет максимально эффективно открывать и закрывать ордера в любом из состояний рынка. Версия для MT4: https://www.mql5.com/ru/market/product/58349 Преимущества: уникальная формула расчета сигнала; высокая точность сигнала; не перерисовывается, не запаз
FREE

График секунд для MetaTrader 5
Индикаторы позволяют создавать графики в терминале MetaTrader 5 с таймфреймом в секундах. Таймфрейм на таком графике задается в секундах, а не в минутах или часах. Таким образом, вы можете создавать графики с таймфреймом меньше М1. Например, S15 — таймфрейм с периодом 15 секунд. К полученному графику можно применить индикаторы, советники и скрипты.
Вы получаете полноценный график, на котором можно работать так же хорошо, как и на обычном графике.
Таймфрейм в се
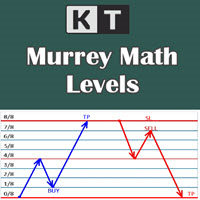
It shows the Murrey Math levels on chart and also provides an alert when price touch a particular level. T. Henning Murrey, in 1995, presented a trading system called Murrey Math Trading System, which is based on the observations made by W.D Gann.
Applications
For Murrey Math lovers, this is a must-have indicator in their arsenal. There is no need to be present on the screen all the time. Whenever the price touches a level, it will send an alert. Spot upcoming reversals in advance by speculatin

A Heatmap with a Volume Profile is like a thermal imager or x-ray machine. It will help you to estimate the relative distribution of volume during the price movement and to understand the relationship between volume and price. Indicator Volume Profile "Volumos Maxima" is a powerful tool for analyzing this relationship. After simple experimentation with heatmap, you can find that each trading instrument has its own “ characteristic ” way of distributing volume. And this will help you to make a b

Introduction
WaveTrend Plus is an amazing oscillator that can detect optimal entry points in the market with high precision using complex computations of price and momentum. This version packs many improvements compared to the original WaveTrend such as cleaner visuals, oversold/overbought signals and divergence detection
Signal
Buy when oversold signal appear (green dot below) or when a bullish divergence is detected (green dashed line)
Sell when overbought signal appear (red dot above) or
FREE

Metatrader 5 version of the famous Andre Machado's Tabajara indicator. If you don't know Andre Machado's Technical Analysis work you don't need this indicator... For those who need it and for those several friend traders who asked this porting from other platforms, here it is...
FEATURES
8-period Moving Average 20-period Moving Average 50-period Moving Average 200-period Moving Average Colored candles according to the inflexion of the 20-period MA
SETTINGS You can change the Period of all MA's
FREE

Heikin Ashi RSI Indicator for MT5 (HARSI) Overview
The Heikin Ashi RSI (HARSI) indicator combines Heikin Ashi candle smoothing with RSI momentum analysis, providing a dual-layer view of price action and relative strength. It offers a clear visualization of market direction, RSI-based overbought and oversold conditions, and optional backtesting and alert systems for strategy validation and trade signal automation. How It Works
The indicator applies RSI values to Heikin Ashi calculations, creati

Индикатор использует несколько таймфреймов для анализа лучших входов в покупки во время бума 1000. Он предназначен для торговли только во время пиков бума. индикатор имеет две стрелки; красные и синие. появление красной стрелки указывает на то, что вы должны быть готовы к появлению синей стрелки, которая является сигналом для входа на покупку. Индикатор не предлагает точек выхода. всегда собирайте 3 пипса, т.е. если вы вошли в сделку по цене 10230,200, вы можете выйти на отметке 10260,200 со ст
FREE

Local Time Scale Overlay is a technical indicator for MetaTrader 5 that enhances chart readability by overlaying a local time scale on the trading chart. It calculates the difference between your local system time and the server time and uses this difference to display time labels that reflect your local time at predefined intervals. The time interval is customizable via a drop‐down menu with options such as 5, 10, 15, 20, 30, 60, 120, and 480 minutes (with 15 minutes as the default).
Key Featu
FREE

MT4 Version MA Ribbon MT5 MA Ribbon is an enhanced indicator with 8 moving averages of increasing periods. MA Ribbon is useful to recognize trend direction, reversals and continuation points in the market as well as potential entry, partial take profit and exit points. Entry points for long and shorts position can be found when the price entries or leaves the Ribbon, at retest or a defined number of MA crossovers. It offers a good combination with mostly any volume or momentun indicators to

SUPERTREND ; Это индикатор следования за трендом, основанный на SuperTrend ATR, созданном Оливье Себаном. Его можно использовать для обнаружения изменений в направлении тренда и обнаружения стопов. Когда цена падает ниже кривой индикатора, она становится красной и указывает на нисходящий тренд. И наоборот, когда цена движется выше кривой, индикатор становится зеленым, указывая на восходящий тренд. Как и другие индикаторы, он хорошо работает с SuperTrend в сочетании с другими индикаторами, такими
FREE

CandleTimeAndSpreadLine – Tempo de vela e Spread em tempo real O CandleTimeAndSpreadLine é um indicador que mostra duas informações essenciais diretamente no gráfico:
(1) o tempo restante da vela atual e
(2) o spread em pontos, ambos ancorados ao preço de referência escolhido (Ask, Bid ou Mid). Ele utiliza atualização via OnTimer , garantindo que o tempo continue fluindo mesmo em momentos de baixa atividade do mercado.
Os valores são exibidos em rótulos sobrepostos ao gráfico, sem interferir na
FREE
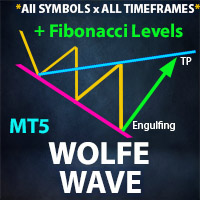
** All Symbols x All Timeframes scan just by pressing scanner button ** *** Contact me to send you instruction and add you in "Wolfe Wave Scanner group" for sharing or seeing experiences with other users.
Introduction: A Wolfe Wave is created with five-wave patterns in price. It shows supply and demand and a fight towards a balance price. T hese waves of price actions can help traders identify the boundaries of the trend . Also It helps forecast how the price will move in the near futur

MACD 2 Line MTF (Multi-Timeframe) Indicator for MetaTrader 5 This custom MetaTrader 5 indicator implements a classic MACD with two lines (MACD Line and Signal Line) and a color-coded histogram , enhanced with multi-timeframe capability . It allows traders to monitor MACD trends from higher or lower timeframes directly on the current chart. Key Features: MACD Line (Fast EMA minus Slow EMA) Signal Line (SMA of MACD Line) Histogram Up/Down : Displays positive values in green and negative values in
FREE

Smart Finder Order Block The Ritz Smart Finder Order Block is a next-generation market structure recognition tool, designed to intelligently detect and highlight institutional footprints within price action. Built on a dynamic blend of order block theory, consolidation tracking, and adaptive volatility modeling, it provides traders with a sophisticated lens to anticipate high-probability market reactions. Core Capabilities Smart Order Block Detection Identifies both Bullish and Bearish Order Blo
FREE

MT5 Version : This indicator represents a genuine momentum oscillator according to the true definition of "Momentum", and as realised by the techniques of digital filters. Scholarly papers on the subject by the current developer can be found here and here , but in this description we shall borrow only the minimum of conceptual and mathematical framework needed. In the process, we expose some long-held myths about indicators supposedly measuring price momentum, and in particular the one ca
FREE

Если вам нравится этот проект, оставьте 5-звездочный обзор. Как институционалы торгуют большими объемами, для них не должно пытаться
защищать свою позицию на определенных процентных уровнях. Эти уровни будут служить естественной поддержкой и устойчивостью, которую вы
можете использовать
либо войти в торговлю или быть в курсе возможных опасностей против вашей
позиции. Пример общего используемого процента составляет 0,25% и 0,50% на EURUSD для
неделя, вы можете увидеть этот пример на скриншотах.
FREE
Optimized Trend Tracker (OTT) Indicator The Optimized Trend Tracker (OTT) is a custom indicator designed to visualize trend direction and potential changes based on a configurable moving average and dynamic support/resistance levels. It provides multiple visualization and signal options, making it suitable for discretionary analysis or integration into automated systems. Key Features Configurable Moving Average Types
Supports SMA, EMA, WMA, TMA, VAR, WWMA, ZLEMA, and TSF for flexible calculatio
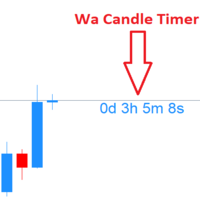
Wa Candle Timer MT5 показывает живой обратный отсчёт до закрытия текущей свечи прямо на основном графике. По мере приближения конца бара таймер меняет цвет (по умолчанию — когда прошло ~95% длительности свечи, т.е. осталось ~5% времени).
Индикатор лёгкий, наглядный и подходит трейдерам, синхронизирующим входы/выходы по закрытию свечи. Ключевые возможности Реальный обратный отсчёт до закрытия бара для любого инструмента и тайм-фрейма. Смена цвета, когда свеча почти завершилась (порог по умолчанию
FREE

Tabajara Rules for MT5 , based on Professor André Machado’s Tabajara Setup, indicates the market direction using moving averages when there are candles aligned with the direction of the moving average.
The indicator contains the color rule applied to the candles and the moving average.
It allows changing the parameters: period and smoothing method of the moving average.
It also allows changing the colors of the candles (borders and filling) and of the moving average.
Professor André Machado’s
FREE
Haven CBDR - это простой в использовании индикатор, который отображает на графике диапазон ICT «Central Bank Dealers Range» (CBDR). Программа строит прямоугольники, выделяющие ценовой диапазон CBDR, а также показывает дополнительные линии стандартных отклонений для оценки возможных уровней поддержки и сопротивления. Продукт позволяет настраивать временной интервал CBDR, число отображаемых календарных дней, цвета и стили графических элементов, а также автоматически подбирает цветовую схему в зав
FREE

ICT Turtle Soup Complete System - MT5 Indicator Overview The ICT Turtle Soup Complete System is an advanced MT5 indicator that combines Inner Circle Trader (ICT) concepts with the classic Turtle Soup trading pattern. This sophisticated tool identifies liquidity sweep reversals at key levels, providing high-probability trade setups with complete risk management calculations. Key Features 1. Multi-Timeframe Liquidity Detection Tracks Daily, 4H, 1H, and Yesterday's High/Low levels Identifies
FREE
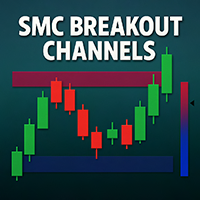
SMC Breakout Channels Anticipate market breakouts with precision.
SMC Breakout Channels automatically detect accumulation and distribution ranges where professional traders (“smart money”) are most active. By combining volatility-based range detection with real-time volume analysis, this tool highlights the key breakout zones that often precede strong directional moves. Advantages Clarity: No clutter, just clean breakout boxes with clear bullish/bearish bias. Early Signals: Detect hidden ac
FREE

BeST_Hull MAs Directional Strategy is a Metatrader Indicator based on the corresponding Hull Moving Average.It timely locates the most likely points for Entering the Market as well as the most suitable Exit points and can be used either as a standalone Trading System or as an add-on to any Trading System for finding/confirming the most appropriate Entry or Exit points. This indicator does use only the directional slope and its turning points of Hull MAs to locate the Entry/Exit points while it

Индикатор PipTick Pivot автоматически вычисляет и отображает уровни пивотов и уровни поддержки и сопротивления. Пивоты могут быть рассчитаны по формулам: Classic, Floor, Fibonacci, Woodie, Camarilla или DeMark. Также имеется возможность выбора периода для расчета индикатора. Можно выбрать дневной, недельный, месячный или пользовательский период.
Типы пивотов Classic. Floor. Fibonacci. Woodie. Camarilla. DeMark.
Основные характеристики Индикатор показывает текущие и исторические уровни пивотов.
FREE
AlgoRhythm ZLSMA - The Ultimate Trend Trading Solution Unlock the power of precision trading with AlgoRhythm ZLSMA , an advanced technical indicator designed to deliver razor-sharp trend signals. Engineered for MetaTrader 5, this cutting-edge Zero Lag Smoothed Moving Average (ZLSMA) combines sophisticated smoothing techniques, multi-timeframe analysis, and dynamic bands to give traders a competitive edge in any market. Whether you're a scalper, swing trader, or long-term investor, AlgoRhythm ZLS
FREE
ПОСМОТРЕТЬ ВСЕ МОИ БЕСПЛАТНЫЕ ПРОДУКТЫ
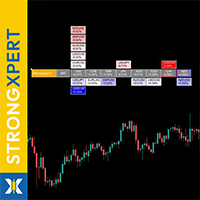
StrongXpert - это твой точный монитор силы валют в реальном времени для глобального валютного рынка. Он был разработан, чтобы показать тебе, куда на самом деле течёт капитал - и откуда он уходит с рынка . Индикатор измеряет относительную силу всех основных валют (USD, EUR, GBP, JPY, AUD, CAD, CHF, NZD) и превращает сложные ценовые движения в простой, легко читаемый визуальный дашборд - прямо на графике. Определи самую сильную и самую слабую валюту за счит
FREE
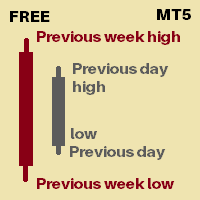
Its an indicator that will show you
Previous day high Previous day low Previous week high Previous week low You can set how many days of history you would like to see for previous day high low and previous week high low Currently 30 days of PDH/L will be marked 4 weeks of PWH/L will be marked You can change it from indicator settings. Dates are shown at marking lines to identify which date does that marking belongs to.
Thank you :) Always open to feedback and criticism if it helps me provide yo
FREE
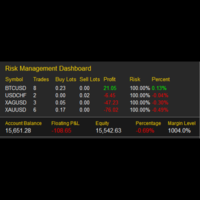
My Risk Management The Risk Management Dashboard is a visual tool designed to help traders monitor risk exposure in real time. With a clear and compact layout, it provides an instant overview of trading activity, enabling more disciplined and informed decision-making. Key Features Active Symbol Summary
Displays all traded symbols with the number of trades, total buy/sell lots, and current profit/loss. Per-Symbol Risk Analysis
Calculates and shows the risk percentage of each symbol relative to
FREE
Are you tired of those old, boring TP and SL lines cluttering your charts? Free now, celebrating release of Live Chart Viewer utility https://www.mql5.com/en/market/product/158488
Struggling to showcase your trades in a way that actually grabs attention ?
Worry no more! Introducing the ultimate solution you’ve been waiting for... The TPSL Bounding Box PRO Indicator! PRO Version (With Risk to Rewards Ratio and more Modern Look Stats)
With just a simple setup, you can transform you
FREE

SMC VALID EA (MT5) Version: 1.10
Author: Marrion Brave Wabomba
Category: Smart Money Concepts (SMC) and ICT concepts ICT Smart Money Daily Zones (SMC Pro) ICT Smart Money Daily Zones (SMC Pro) – ICT Daily Buy & Sell Zones Pro is a professional-grade Smart Money Concepts (SMC) / ICT trading indicator for MetaTrader 5, designed to clearly map institutional daily levels and guide traders with high-probability decision zones . This indicator automatically analyzes the Daily timeframe (PDH / PD

Overview of the Market Sessions Indicator The Market Sessions Indicator is a tool designed to help traders visualize the active trading hours of major global financial markets—specifically the Tokyo, London, and New York sessions. By clearly marking these time zones on the chart, the indicator allows users to identify the partitioning of major trading sessions. There are 3 regular trading sessions: - Tokyo Session - London Session - New York Session The indicator works from the H1 timeframe and
FREE

The Penta-O is a 6-point retracement harmonacci pattern which usually precedes big market movements. Penta-O patterns can expand and repaint quite a bit. To make things easier this indicator implements a twist: it waits for a donchian breakout in the right direction before signaling the trade. The end result is an otherwise repainting indicator with a very reliable trading signal. The donchian breakout period is entered as an input. [ Installation Guide | Update Guide | Troubleshooting | FAQ | A
FREE

Trend Magic Indicator for MT5
To download All Of Our Products , you can click this link: LINK Are you interested in the Wei Wave Indicator Volume : LINK
Are you interested in the Chandelier Indicator : LINK Are you interested in the Wave Trend Oscillator : LINK Are you interested in the Support & Resistance Indicator : LINK Are you interested in the Alpha Trend Indicator : LINK Are you interested in the NRTR Indicator : LINK
Introduction The Trend Magic Indicator is a smart tool that blends

Please Good Review on this indicator, and i will maybe produce more indicators, Coming soon, EA base on this indicators
Linear Weighted Moving Average with HLCC applied price, and Bollinger bands with LWMA as applied price. Interesing Buy and Sell arrow based on this indicator , non Lag indicator as arrow will appear 1 candle after crossed...............
FREE

The ATR Exit indicator uses the candle close + ATR value to draw trailing stop lines (orange under buys, magenta over sells) that advance with the trend until the trend changes direction. It uses a multiple of the Average True Range (ATR), subtracting it’s value from the close on buy, adding its value to the close on sell. Moreover, the trailing stop lines are generated to support the order’s trend direction (long or short): In an upward trend, the long trailing stop line (orange line under bu
FREE

FOTSI – Индекс истинной силы на Форекс Откройте истинную силу каждой валюты и торгуйте с преимуществом. Индикатор FOTSI — это мультивалютный осциллятор , который измеряет реальный импульс каждой основной валюты (USD, EUR, GBP, JPY, CHF, AUD, CAD, NZD) по всем парам. Вместо анализа одного графика FOTSI объединяет данные нескольких пар, сглаживает движение и применяет алгоритм True Strength Index (TSI) , чтобы дать вам четкое, стабильное и без задержек представление о относительной силе каждой вал

Индикатор KPL Swing - это простая система технической торговли следующая за трендом, которая автоматизирует вход и выход. Система работает с твердым стоп-лоссом и следующим стоп-лоссом для выхода с прибыльными сделками. Не даются цели, так как никто не знает, насколько высоко (или низко) может двигаться цена. Следующий стоп-лосс блокирует прибыль и убирает эмоции из торговли. Конвертировано с индикатора Amibroker с модификацией.
Идеально в сочетании с KPL Chart Uptrend & Downtrend
FREE

Сигналы снайперского входа MFI и RSI для синтетики Boom и Crash поставляются с мощными системами оповещения о входе, а для более продвинутых сигналов фильтрации рассмотрите Harmonic Hybrid Pilot Pro.При торговле шипами у вас есть три ордера, логически расположенных для распределения риска, и третий ордер, наконец, близка к самой высокой вероятности всплеска. Сигналы становятся недействительными через пятнадцать минут после окончательного ордера, и убытки должны быть закрыты немедленно. Что касае
FREE

The "Support Resistance Dynamic" indicator is a powerful technical analysis tool for the MetaTrader 5 platform, designed to automatically identify and plot dynamic Support and Resistance zones on price charts. This indicator helps traders easily recognize important price levels, potential reversal points, or breakout areas, thereby enabling more informed trading decisions. 2. Key Features Dynamic S/R Identification : Automatically identifies support and resistance zones based on an advanced Pivo
FREE
Узнайте, как легко и просто купить торгового робота в MetaTrader AppStore - магазине приложений для платформы MetaTrader.
Платежная система MQL5.community позволяет проводить оплату с помощью PayPal, банковских карт и популярных платежных систем. Кроме того, настоятельно рекомендуем протестировать торгового робота перед покупкой, чтобы получить более полное представление о нем.
Вы упускаете торговые возможности:
- Бесплатные приложения для трейдинга
- 8 000+ сигналов для копирования
- Экономические новости для анализа финансовых рынков
Регистрация
Вход
Если у вас нет учетной записи, зарегистрируйтесь
Для авторизации и пользования сайтом MQL5.com необходимо разрешить использование файлов Сookie.
Пожалуйста, включите в вашем браузере данную настройку, иначе вы не сможете авторизоваться.