Смотри обучающее видео по маркету на YouTube
Как купить торгового робота или индикатор
Запусти робота на
виртуальном хостинге
виртуальном хостинге
Протестируй индикатор/робота перед покупкой
Хочешь зарабатывать в Маркете?
Как подать продукт, чтобы его покупали
Технические индикаторы для MetaTrader 5 - 18
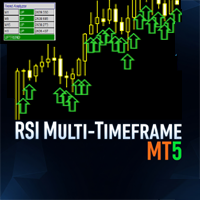
The MultiFrameRSIIndicator is a powerful MetaTrader 5 (MT5) indicator that leverages the Relative Strength Index (RSI) to analyze trends across multiple timeframes. This indicator synchronizes RSI-based trend signals from up to nine timeframes (M1, M5, M15, M30, H1, H4, D1, W1, MN1) and presents them with clear visual feedback, including a colored RSI line, signal arrows, and a customizable dashboard. Ideal for traders seeking momentum-based trend confirmation. Features Multi-Timeframe Analysis
FREE

Hi-Lo - это индикатор, цель которого - более точно определять тенденции данного актива, указывая, таким образом, на возможное лучшее время для покупки или продажи.
Что такое хай-лоу?
Hi-Lo - это термин, полученный из английского языка, где Hi связано со словом High, а Lo - со словом Low. Это индикатор тренда, используемый для оценки торговли активами на финансовом рынке.
Следовательно, его использование дается для определения того, показывает ли конкретный актив восходящий или понижательный
FREE

Этот индикатор является демо-версией полного My candle, который можно скачать здесь: Candle Patterns Creator В полной версии вы можете создавать свои собственные правила для свечей и модифицировать традиционные паттерны свечей для более точного соответствия вашей стратегии. В индикаторе приведено несколько примеров правил для свечей, но здесь я продемонстрирую только некоторые из них: Pattern Rule Candle Green C > O Candle Red C < O Doji C = O Hammer (C > O and (C-O) *2 < O-L and (C-O) *0.5 > H-
FREE
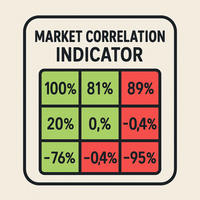
Общее Описание
Этот индикатор в реальном времени рассчитывает коэффициент корреляции Пирсона между различными финансовыми инструментами. Он отображает динамическую матрицу корреляций, показывающую силу и направление взаимосвязей между валютами, индексами, акциями и сырьевыми товарами. Основные Параметры SymbolsList : список инструментов для сравнения (через запятую) BarsToAnalyze : количество исторических баров для расчета TimeFrame : таймфрейм для анализа корреляции Интерпретация Корреляции З
FREE

Sessions are very important in trading and often good area where to look for setup. In SMC, ICT we will look for Asian session to serve as liquidity
This indicator displays: High & Low of the Asia session Midnight New York time opening line
Congifuration Line Style, color Label position, size, color Start of the level (Start of the day, Start of the session, Highest or Lowest point in the session)
Any questions or comments, send me a direct message here https://www.mql5.com/en/users/mvonline
FREE

The Donchian Channel Channels are among the most popular tools of technical analysis, as they visually convey to the analyst the limits within which most price movement tends to occur. Channel users know that valuable information can be obtained at any time, whether prices are in the central region of a band or close to one of the border lines.
One of the best known techniques to explore these concepts is Bollinger Bands. However, John Bollinger was not the only one to research the application
FREE

RSI Divergence Suite Pro - Продвинутый индикатор для MetaTrader 5 Общее описание RSI Divergence Suite Pro - это продвинутый технический индикатор для MetaTrader 5, который автоматически обнаруживает расхождения между ценой и RSI, предоставляя высокоточные торговые сигналы. Этот профессиональный индикатор сочетает в себе мощность RSI с анализом расхождений, поддержкой/сопротивлением на нескольких таймфреймах и полной системой оповещений. Основные характеристики Продвинутое обнаружение расхождени

Graph configuration and buy and sell signals based on Stormer's (Alexandre Wolwacz, Brazilian trader) swing, position and day trade strategy, described on his youtube channel (https://www.youtube.com/watch?v= 0QZ_NjWkwl0)
The buy and sell indications are based on 2 candle patterns ( Inside Bar [Yellow] and Reversal Closing Price [Blue and Red] ), 3 Moving Averages and 1 Stochastic .
Indicators: Inside Bar - Candle pattern indicating trend continuity, or reversal Reversal Closing Price - Cand
FREE

Demand and supply zones Support and Resistance areas Show broken zones Show tested and untested zones Show weak zones Fractal factors Notifications when price reaches point of Interest with Push notifications and pop ups Customizable History Clickable Works on all Timeframes Works on all pairs.
Free for a while till further notice and changes. The demand and supply bot coming soon
FREE

Imagine VWAP, MVWAP and MIDAS in one place... Well, you found it! Now you can track the movement of Big Players in various ways, as they in general pursue the benchmarks related to this measuring, gauging if they had good execution or poor execution on their orders. Traders and analysts use the VWAP to eliminate the noise that occurs throughout the day, so they can measure what prices buyers and sellers are really trading. VWAP gives traders insight into how a stock trades for that day and deter
FREE
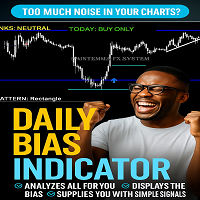
INTRODUCING the Powerful Daily Bias Indicator
The Daily Bias Indicator
Stop Guessing. Start Trading with Confidence.
Tired of staring at your charts and not knowing if today is a buy day or a sell day? The Daily Bias Indicator does the heavy lifting for you.
It scans the market using 7 powerful tools (EMA trend, RSI, MACD, ADX, Volume, Pivot Points & Price Action). It tells you in plain language:
“TODAY: BUY ONLY”
“TODAY: SELL ONLY”
Or “NO CLEAR BIAS” (so you don’t waste money
FREE
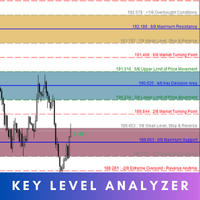
Key Level Analyzer – Know Better, Trade Smarter Key Level Analyzer is a powerful trading tool designed to provide precise market insights by identifying high-probability price zones , market turning points , and key decision areas . Unlike traditional indicators, it uses a smart algorithm to dynamically calculate support, resistance, and balance zones, helping traders make informed, data-driven decisions . MT4 Version - https://www.mql5.com/en/market/product/132809/ With real-ti

Big Figure Levels – Key Psychological Price Zones for MT5 Big Figure Levels is a professional trading tool designed for MetaTrader 5 that automatically identifies and draws major psychological price levels, including quarter and half levels. These levels are known to act as powerful support and resistance zones due to their influence on both institutional and retail trader behavior. This indicator is perfect for any trading style—whether you're a scalper, day trader, or swing trader—and is compa
FREE

** All Symbols x All Timeframes scan just by pressing scanner button ** *** Contact me to send you instruction and add you in "Head & Shoulders Scanner group" for sharing or seeing experiences with other users. Introduction: Head and Shoulders Pattern is a very repetitive common type of price reversal patterns. The pattern appears on all time frames and can be used by all types of traders and investors. The Head and Shoulders Scanner indicator Scans All charts just by pressing

AllTF Trend Bias Indicator is a professional tool to visualize market bias, designed mainly for 1-minute charts. The colors are not trading signals by themselves, but a visual compass to guide your decision-making: HiddenEdge release model
All HiddenEdge tools follow the same structured release plan.
Each indicator is released initially for free to collect feedback.
After reaching a stable user base, it moves to a fixed paid tier.
Some utilities remain permanently free as part of the Hidde
FREE
Opening Range Breakout Pro Professional ORB Session Indicator for MT5 Opening Range Breakout Pro is a highly visual, fully customizable Opening Range Breakout (ORB) indicator for MetaTrader 5, designed for intraday, session-based, and prop-firm traders . The indicator automatically plots the Opening Range High and Low , along with multiple target levels above and below the range , allowing traders to clearly visualize breakout zones, retests, and profit objectives directly on the chart. This too
Liquidity Pressure Index (LPI) is an advanced technical indicator designed to uncover the hidden battle between buyers and sellers in the market. Unlike conventional oscillators that only rely on price movements, LPI integrates market depth (order book data), ATR-based volatility compression, and adaptive smoothing to give traders a deeper view of true liquidity dynamics.
By combining price action with volume absorption and order flow pressure, the LPI helps traders anticipate shifts in market
FREE

Ищете качественный индикатор точек разворота? Значит, PZ Pivot Points - это то, что вам нужно! Он строит уровни не только за текущий день. Он строит исторические уровни для проведения тестирования на истории Вы сами выбираете таймфрейм Цвета и размеры настраиваются
Что такое "точки разворота"? Анализ точек разворота зачастую применяется совместно с расчетом уровней поддержки и сопротивления, как и в случае с анализом трендовых линий. При анализе точек разворота первые уровни поддержки и сопроти
FREE
Overview Unlock a fresh perspective on your charts with the KS Invert Chart Pro Indicator – a powerful, zero-lag tool designed exclusively for MetaTrader 5. This innovative indicator inverts bars or candles mathematically (by multiplying price data by -1), revealing hidden patterns, contrarian opportunities, and inverse correlations that traditional views might miss. Perfect for advanced traders employing correlation strategies, multi-timeframe analysis, or hedge monitoring. Whether you're spott
FREE
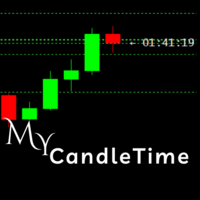
My CandleTime
This indicator displays the remaining time until the current candle closes directly on the chart.
It is designed to help traders keep track of candle formation without constantly checking the platform’s status bar. Main Features Shows countdown timer for the active candle. Works on any symbol and timeframe. Lightweight, does not overload the terminal. Adjustable font size and name. How to Use
Simply attach the indicator to a chart.
You can customize font size, color, and font to
FREE

Technical Description Daily Trend Lines Pro is an advanced indicator developed in MQL5, designed to provide accurate insights into the market’s daily movements. Based on the moving average calculated from the first candle of each day, the indicator plots a daily trend line that resets at the start of each new day, ensuring visual clarity and clearly delineating trading sessions. Main Features: Dynamic and Accurate Calculation:
The daily line is derived from the moving average value computed fr
FREE

Daily Weekly Monthly High Low - Your Ultimate Tool for Precision Market Analysis
The 200 free download promotion has ended. The price has now been updated. Thank you, everyone!
Love it? Hate it? Let me know in a review! Feature requests and ideas for new tools are highly appreciated. :)
Try "The AUDCAD Trader":
https://www.mql5.com/en/market/product/151841 Overview:
Elevate your trading strategy with Daily Weekly Monthly High Low , a sophisticated MQL5 indicator designed to pinpoint c
Индикатор Flower — это инструмент технического анализа, который в основном используется для определения трендов и помощи в стратегиях скальпинга или внутридневной торговли.
Индикатор Flower — это индикатор сигнального тренда, основанный на техническом и ценовом анализе динамики. Он визуально сигнализирует о трендах с помощью цветных цветов: синие цветы указывают на восходящий тренд, а красные — на нисходящий
Каждый уровень может действовать как поддержка и сопротивление (следите за уровнями +
FREE

Weis Waves — это технический индикатор, разработанный Дэвидом Вайсом и основанный на принципах Ричарда Вайкоффа.
В отличие от традиционного объема, который отображается бар за баром, Weis Waves накапливает объем в «волнах» роста или падения, начиная новый отсчёт при изменении направления цены. Этот метод позволяет трейдеру ясно увидеть реальную силу движения рынка , поскольку каждая волна отражает интенсивность объема, стоящего за серией свечей. Основные особенности: Группировка объема в волн
FREE

"Spotting emerging trends, defining correction periods, and anticipating reversals can benefit your trading in many ways..." So be it: Higher Highs & Lower Lows indicator. This is an indicator created by Vitali Apirine and presented to the public through the article "Time To Buy. Time to Sell - It's a Stochastic, Higher Highs & Lower Lows" in the Stocks & Commodities magazine . This is a Momentum indicator that helps determine the direction of a trend. Higher Highs and Lower Lows are two indicat
FREE

Hunt markets with Hunttern ZigZag . Easy to use with one parameter
You can use it for the following: -Classic patterns -Heads and shoulders -Harmonic patterns -Elliott Wave -Support and resistance -Supply and Demand
Single parameter: -Period (1-120)
Features: -Candle time -Single parameter -Light mode template
This is version 1 of Hunttern ZigZag. We are very happy to receive feedback from you.
FREE

Highly configurable Moving average indicator.
Features: Highly customizable alert functions (at levels, crosses, direction changes via email, push, sound, popup) Multi timeframe ability Color customization (at levels, crosses, direction changes) Linear interpolation option Works on strategy tester in multi timeframe mode (at weekend without ticks also) Parameters:
MA Timeframe: You can set the lower/higher timeframes for Ma. MA Bar Shift: Y ou can set the offset of the line drawing. MA Period,
FREE

Индикатор AI Forecasts для MT5:
Система прогнозирования будущего с искусственным интеллектом и глубоким обучением (AI + ML)
_ Основные особенности: Прогнозирование до 20 свечей вперед на основе динамического анализа данных Подходит для скальпинга Многоцветные графики прогнозирования, отражающие уровни уверенности в прогнозах, со счетчиком пунктов белого цвета рядом с текущим статусом Покупки/Продажи Вероятностные зоны, показывающие ожидаемые траектории цены с диапазоном изменения вероятности и
This indicator provides a clear, at-a-glance dashboard for monitoring both the Relative Strength Index (RSI) and Stochastic Oscillator on any instrument or timeframe.
Whenever both RSI and Stochastic %K simultaneously exceed their respective overbought or oversold levels, the indicator displays an arrow signal in the indicator window.
These signals highlight strong momentum and can help traders quickly identify high-probability reversal zones. As with all my free tools, the arrow symbol can be e
FREE
Special offer : ALL TOOLS , just $35 each! New tools will be $30 for the first week or the first 3 purchases ! Trading Tools Channel on MQL5 : Join my MQL5 channel to update the latest news from me I. Введение
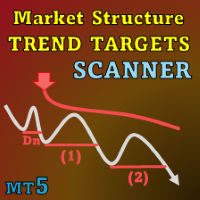
Market Structure Trend Targets Scanner — мощный инструмент для анализа рыночных трендов, выявления точек прорыва и управления рисками с помощью динамического стоп-лосса. Отслеживая предыдущие максимумы и минимумы для определения прорывов, этот инструмент помогает трейдерам б
[ MT4 Version ] Are you tired of spending months on demo or live accounts to test your trading strategies? The Backtesting Simulator is the ultimate tool designed to elevate your backtesting experience to new heights. Utilizing Metatrader historical symbol information, it offers an unparalleled simulation of real market conditions. Take control of your testing speed, test ideas quickly or at a slower pace, and witness remarkable improvements in your testing performance. Forget about wasting tim

Blahtech Moving Average indicator is a multitimeframe version of the standard Moving Average indicator. It is also enhanced with customisable alerts, period breaks and other configuration options. The 50 day and 200 day moving averages are widely followed by investors and traders, with breaks above and below the MA lines considered to be signals of interest. Links [ Install | Update | Training | All Products ]
Feature Highlights Up to three timeframes Configurable calculation variabl
FREE
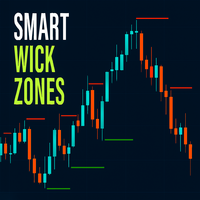
Smart Wick Zones indicator is a powerful tool designed to highlight hidden areas of price rejection and liquidity on your chart. By analyzing candle wicks (also called shadows or tails), the indicator automatically draws horizontal zones where strong buying or selling pressure has previously appeared. These wick zones often mark turning points in the market or areas where price reacts strongly, making them excellent references for support and resistance.
Instead of manually scanning candles for
FREE

Level Breakout Indicator - продукт для технического анализа, работающий от верхних и нижних границ, который может определять направление тренда. Работает на 0 свече без перерисовки и запаздываний.
В своей работе использет систему разных индикаторов, параметры которых уже настроены и объединены в единственный параметр - " Scale ", выполняющий градацию периодов.
Индикатор прост в использовании, не требует проведения никаких вычислений, с помощью единственного параметра необходимо подобрать нужную

Усильте свои возможности по выявлению трендов с помощью Consecutive Candle Indicator MT5 — динамичного инструмента, предназначенного для определения последовательностей бычьих или медвежьих свечей, предоставляющего своевременные оповещения для подтверждения трендов и потенциальных разворотов на рынках форекс, акций, криптовалют и сырьевых товаров. Этот индикатор высоко ценится в торговых сообществах, таких как Forex Factory и Reddit (r/Forex), а также упоминается в обсуждениях на Investopedia и
FREE

WaveTrendPro Arrow – Adaptive Cross Signal with Smart Alerts Description WaveTrendPro Arrow is a clean and powerful visual indicator designed to detect trend-reversal points using the classic WaveTrend oscillator (WT1/WT2 cross) , enhanced with intelligent on-chart arrows , real-time alerts , and mobile push notifications . Unlike traditional WaveTrend indicators that display signals in a subwindow, this version shows precise entry arrows directly on the main chart , positioned adaptively
FREE
https://www.mql5.com/en/users/gedeegi/seller The GEN indicator is a multifunctional technical analysis tool for the MetaTrader 5 (MT5) platform. It is designed to automatically identify and display key Support and Resistance (S&R) levels and detect False Breakout signals, providing clear and visual trading cues directly on your chart. Its primary goal is to help traders identify potential price reversal points and avoid market traps when the price fails to decisively break through key levels
FREE

INDICATOR: Trend Line GEN INDICATOR: Trend Line GEN Developer: gedeegi General Description Trend Line GEN adalah indikator yang secara otomatis menggambar trendline berdasarkan titik-titik swing penting (highs dan lows) pada chart. Garis-garis ini berfungsi sebagai support dan resistance dinamis untuk membantu pengambilan keputusan trading. Key Features Automatic Swing Detection: Mengidentifikasi pivot high dan pivot low secara otomatis. Flexible Slope Calculation: Pilihan metode perhitungan ke
FREE

Индикатор синхронизирует восемь видов разметки на нескольких графиках одного торгового инструмента.
Этот индикатор удобно использовать вместе с "Multichart Dashboard" или другим похожим помощником, который позволяет работать сразу с несколькими графиками одновременно.
"Multichart Dashboard" можно найти по ссылке на моём youtube-канале.
Настройки:
включение синхронизации Vertical Line
включение синхронизации Horizontal Line
включение синхронизации Trend Line
включение синхронизации Fi
FREE

Добро пожаловать в RSI Colored Candles, инновационный индикатор, разработанный для улучшения вашего опыта торговли путем интеграции индекса относительной силы (RSI) непосредственно на вашем графике цен. В отличие от традиционных индикаторов RSI, RSI Colored Candles использует четырехцветную схему, чтобы представить уровни RSI непосредственно на ваших свечах, обеспечивая вам ценные инсайты на первый взгляд. Особенности и преимущества: Экономия места: Попрощайтесь с перегруженными окнами индикатор
FREE
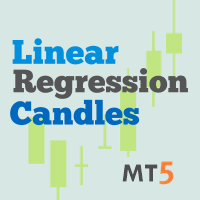
This indicator is the mql version of the Linear Regression Candles indicator. There are many linear regression indicators out there, most of them draw lines or channels, but this one actually draws a chart.This script includes features such as linear regression for open, high, low, and close prices, signal smoothing with simple or exponential moving averages. Find out more here: https://www.mql5.com/en/users/rashedsamir/seller I welcome your suggestion for improving the indicator
To incre
FREE
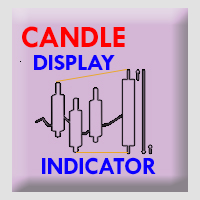
Timeframe Simulator Indicator This indicator redraws candlestick structures from a higher timeframe onto your current chart. It helps visualize higher-period price action without switching timeframes, making it easier to analyze trends and key levels while trading on lower timeframes. Main features: Customizable Candles – Adjust the appearance of higher timeframe candles (bull/bear colors, wick style, gaps, and history length). Higher Timeframe Lines – Optionally display dynamic high, low,
FREE

Используя вдохновение от Приватного Курса Менторства ICT 2016 года (месяц 05), размещенного на YouTube, наш инновационный инструмент дает трейдерам возможность навигации по рынкам с точностью. Помечая периоды в 60, 40 и 20 дней, он помогает выявлять значимые движения на рынке, опираясь на мудрость, внушенную ICT. То, что действительно отличает этот индикатор, - его способность к прогнозированию, функция, предлагающая бесценные идеи о поведении будущего рынка на основе тщательного анализа историч
FREE
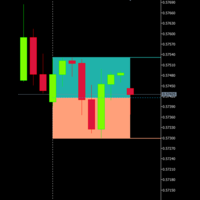
If you like this product, please give it a 5 star rating as a token of appreciation.
This indicator draws the premium and discount zones of a single candle from any timeframe on your chart.
You choose which candle (current or previous) using CandleOffset, and the indicator automatically retrieves that candle’s high, low, and midpoint.
It then visually displays:
Premium Zone (Upper 50%)
A shaded rectangle from the candle’s midpoint to high.
Discount Zone (Lower 50%)
A shaded rectangle from th
FREE
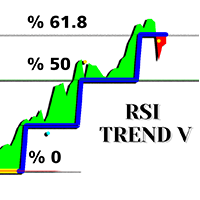
Важное примечание: "Некоторые изображения", показанные на скриншотах, взяты из моих индикаторов, Suleiman Levels Indicator и RSI Trend V Indicator. Индикатор RSI Trend V предназначен для идентификации тренда и интегрирован с уровнями Фибоначчи для определения целевых зон и возможных разворотов. Это очень мощный, строгий и полезный индикатор для определения общего направления тренда. Он включает бычьи и медвежьи стрелки, которые появляются в потенциальных зонах разворота цены. Однако ключевые эл

super trend version is to help you to have real time view of market move it will help you to get a live view of current market buy signal line and arrow to help you understand batter the direction sell signal line and arrow to help you understand batter the direction trade what you see not what you think this is an simple and best trading tool for our traders of any market crypto gold
FREE
Accurate Buy Sell System is a clean and reliable swing-based indicator designed to identify trend reversals and entry zones with high precision. The algorithm follows the original “Accurate Swing Trading System” concept from TradingView (by ceyhun) and has been fully re-engineered for MetaTrader 5. 1:1 match with TradingView behavior
Works on all symbols and timeframes
Clean non-repainting signals when used after candle close
Visual BUY/SELL arrows + colored dynamic trendline
Popup al
FREE

No Demand No Supply This indicator identifies No Demand –No Supply candles to your chart and plots volume bars colored according to the signal. It can be applied to all timeframes or to a specific one only. It can also be used as regular volume indicator with exceptional future of WEIGHTED VOLUME. Furthermore is has an alert notification, sound and email when a signals occurs. The indicator does not repaint but the alert will come on two candles back due to the definition of No Demand No Su

[ZhiBiDW Trend] - это простой, интуитивно понятный и эффективный индикатор трендов и шоков. Он подходит для периодов графика более 15 минут и менее 4 часов, подходит для всех разновидностей рынка.
Сигнал на покупку: появляется синяя стрелка вверх, появляется стрелка с предустановленной ценой для Stop Loss и Take Profit.
Сигнал на продажу: появляется красная стрелка вниз, появляется стрелка с предустановленной ценой для Stop Loss и Take Profit.
Описание настройки параметров:
[Send_Alert]: это
FREE
VWAP Machine Learning Bands: Прогностическое Преимущество для Трейдеров Откройте для себя новый уровень рыночного анализа с VWAP Machine Learning Bands – инновационным индикатором для MQL5, разработанным для предоставления беспрецедентной информации о рыночных трендах, динамических зонах поддержки/сопротивления и высоковероятных торговых сигналах. Используя запатентованный адаптивный алгоритм машинного обучения, интегрированный с мощью средневзвешенной цены по объему (VWAP), этот индикатор выход

Modern Spike Indicator Features:
1. Support and Resistance Lines: Displays dynamic horizontal dashed lines on the chart representing current support and resistance levels calculated from recent price swings.
2. Spike Detection Arrows: Shows up arrows (green) for potential upward spikes and down arrows (red) for potential downward spikes, triggered when price breaks S/R levels with RSI confirmation.
3. Trend Analysis: Incorporates ADX (Average Directional Index) to determine market trend stre

Precision Arrows – Умные сигналы входа с встроенными TP и SL Precision Arrows — это мощный торговый индикатор, созданный для трейдеров, ценящих точность, прозрачность и надежность. Он определяет сигналы на покупку и продажу с высокой вероятностью успеха и автоматически устанавливает уровни Take Profit и Stop Loss , помогая торговать дисциплинированно и стабильно на Forex, индексах, криптовалютах и синтетических инструментах . Индикатор сочетает в себе точное определение сигналов, интеллектуальну
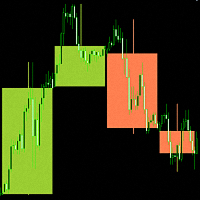
"Candlesticks MTF 5" информационный индикатор, который отображает "Японские свечи" . Индикатор анализирует и определяет время открытия и закрытия свечей из более старших таймфреймов.
Для индикатора "Candlesticks MTF 5" разработан алгоритм, корректирующий несоответствие времени открытия и закрытия свечи с большего таймфрейма. Например, если время открытия свечa на недельном таймфрейме приходится на 1-е число месяца, а на меньшем таймфрейме эта дата приходится на Субботу, то без данного алгоритма
FREE

This is a simple Orderblock alert indicator. it alerts you once it spots a bullish or bearish OB. what you choose to do with the alert, is left to you. Feel free to test on demo before use. (I'll be working on a combo i.e this and an EA working side by side, anticipate) Bullish OB has a light blue color and bearish has a light red color (rectangle box drawn on chart). Please trade wisely and don't forget to leave a positive review. thanks More blues to you, and Happy Trading!
FREE
This is a powerful, session-aware breakout indicator designed for serious traders who thrive on volatility and structure. Engineered for precision, it identifies high-probability breakout zones during the London and New York trading sessions—where the market moves with intent. Key Features: Session Range Detection
Automatically detects and highlights the key price range of London and New York sessions. Breakout Confirmation
Identifies breakout candles after the session range, with clear bullis
FREE

A useful dashboard that shows the RSI values for multiple symbols and Time-frames. It can be easily hidden/displayed with a simple click on the X top left of the dashboard. You can input upper and lower RSI values and the colours can be set to show when above/below these values. The default values are 70 and 30. You can choose whether the dashboard is displayed on the right or left of the chart. If you want to have 2 dashboards on the same chart you must input a different name for each. The sca
FREE

Supply and Demand indicator does not repaint as it counts the number of tests/retests occurred in the past x number of times. As a trader you need a path to be able to place your buy and sell trades such as: Supply and Demand, Falling & raising channels . Experienced trades will draw the key levels and channels around the timeframes. But, they will not be able to draw them on the small time frames as the price changes too frequent. This indicator is based on Shved supply and demand indicator, b
FREE

Finally a Metatrader version of the very popular (and expensive) Market Cipher B indicator, or the Vumanchu Cipher B + Divergences very popular on Tradingview platform.
This tool is very heavy on calculations, total are 31 plots using 97 buffers from several indicators. On my mid end computer, timeframes below M15 start getting a bit laggy, so it would require a powerful computer to run it properly at very low timeframes. It's still usable here, but somewhat sluggish response in Metatrader (lik
FREE

Daily session open lines shows the traders three important trading session opens. By default it is set up to show you: Zero GMT Open Line London Open Session Line New York Open Session Line The default times are set according to GMT+2 and as such you are able to change and customise according to your specific time zone. The Indicator is usefull specially for the trader who trades the London and NewYork sessions.
FREE
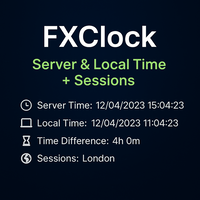
FXClock – Professional Clock Indicator for Traders Important Reminder:
If you find this tool helpful, please support the work by leaving a comment or rating.
Your feedback motivates further development!
The FXClock indicator is a practical and simple tool that displays time directly on your trading platform, allowing you to track multiple key pieces of information at the same time. It is specially designed to help traders synchronize their trading with market hours and global sessions. Key F
FREE

The outside bar indicator shows a range of inside bars and the breakout up and down from the range. The breakout is always displayed at the start of a new range and is extended until another breakout. The calculation always takes place at the start of a new candle. So it is displayed accordingly in all time frames. In inside bar ( insidebar ) trading you can see the top and bottom of a range.
In outside bar ( outsidebar ) trading, the breakout from a range and thus the trend following.
The col
FREE

Представляем мощный индикатор NRTR (Nick Rypock Trailing Reverse) - обязательный технический инструмент для трейдеров, стремящихся определить развороты тренда и установить эффективные уровни трейлинг-стопов. Разработанный Ником Райпоком, этот индикатор имеет уникальный алгоритм, который адаптируется к постоянно меняющимся рыночным условиям, что делает его ценным дополнением к арсеналу любого трейдера.
Вот два популярных способа использования этого индикатора трейдерами:
1. Развороты тренда: И
FREE

Who is he?: Peter Tuchman, a stock trader on the NYSE.
Why is he famous?: He's known as the "Einstein of Wall Street" because of his physical resemblance to the famous trader and his hairstyle. He's frequently photographed by the media, earning him the nickname "the most photographed trader on Wall Street." His image is often used to illustrate market volatility. Career history: He started in 1985 as a telegraph operator and has held various positions before becoming a stockbroker.
AND THIS I
FREE

Overlay indicator on chart between 2 pairs
The Timeframe Overlay indicator displays the price action of timeframes on a single chart, allowing you to quickly assess different timeframes from a single chart. The advantage is to observe and follow the correlations of price movements in real time to help you find potential trades at a glance.
---- Symbol 1 ----
Symbol = EURUSD
Correlation Inverse = false
Display = true
Ratio
FREE

1. Introduction Smart Volume S/R Pro is a powerful technical analysis tool designed for the MetaTrader 5 platform. Unlike traditional Support & Resistance (S/R) indicators that rely on price peaks and troughs, this indicator automatically identifies critical S/R zones based on a core factor: Trading Volume . Core Principle: Price levels that witnessed exceptionally high trading volume in the past will often become significant psychological zones, where the price is likely to react strongly (eith
FREE

RSI ABCD Pattern Finder: Technical Strategy 1. How the Indicator Works Combines the classic RSI with automatic detection of ABCD harmonic patterns . Key Components Standard RSI (adjustable period) Peak and Trough Markers (arrows) ABCD Patterns (green/red lines) Overbought (70) and Oversold (30) Filters 2. MT5 Setup period = 14 ; // RSI period size = 4 ; // Maximum pattern size OverBought = 70 ; // Overbought level OverSold = 30 ; // Oversold level Filter = USE_FILTER_ YES ; // Confirmation filte
FREE

RSI with moving average is great to see when the price is overbought and oversold instead of RSI only.
INPU T PARAME TERS : RSI:
Period - RSI period.
Price - RSI applied price.
Color scheme - RSI color scheme (4 available). MOVING AVERAGE:
Period - MA period.
Type - MA type.
Apply - MA applica tion.
Shift - MA shif t (correc tion). PRICE LINE:
Show - specify if line with price, only line or nothing.
Style - line style. OTHER:
Overbought level - specify the level .
Overbought descriptio
FREE

Please check the " What's new " tab regularly for a complete and up-to-date list of all improvements + parameters. FREE indicator for my trading utility Take a Break . This indicator allows you to manage multiple other EAs with just one Take a Break EA instance. Simply specify the corresponding Chart Group in the indicator(s) and Take a Break EA settings and you are good to go.
Setup examples (Indicator + EA)
As a prerequisite, add the URL https://trading.custom-solutions.it to the list of al
FREE

TransitX1 indicator is very useful, with unlimited signals and works on all the timeframes and all the piers. TransitX1 draws two trend lines very short trendlines (+/-20 bars) which can be considered as support and resistance. The support is in red trendline and the resistance is in green trendline. TransitX1 gives buying and selling signals, with only 3 being previous signals and the 4th one being the current signal. Buying signals are in green arrows and are always on the support trendline an
FREE

KDJ Indicator for MT5 The KDJ Indicator for MT5 is a professional-grade momentum and trend analysis tool designed to help traders identify trend reversals , overbought/oversold conditions , and entry or exit opportunities with high accuracy. Originally developed as an enhancement of the Stochastic Oscillator , the KDJ adds a powerful J-line that reacts faster to price movement, giving traders earlier warnings of potential reversals. Key Features Three-Line System (K, D, J):
The K and D lines r
FREE
MetaTrader Маркет - единственный магазин, где можно скачать демоверсию торгового робота и подвергнуть его проверке и даже оптимизации на исторических данных.
Прочитайте описание и отзывы других покупателей на заинтересовавший вас продукт, скачайте его прямо в терминал и узнайте, как протестировать торгового робота перед покупкой. Только у нас вы можете получить представление о программе, не заплатив за неё.
Вы упускаете торговые возможности:
- Бесплатные приложения для трейдинга
- 8 000+ сигналов для копирования
- Экономические новости для анализа финансовых рынков
Регистрация
Вход
Если у вас нет учетной записи, зарегистрируйтесь
Для авторизации и пользования сайтом MQL5.com необходимо разрешить использование файлов Сookie.
Пожалуйста, включите в вашем браузере данную настройку, иначе вы не сможете авторизоваться.