Смотри обучающее видео по маркету на YouTube
Как купить торгового робота или индикатор
Запусти робота на
виртуальном хостинге
виртуальном хостинге
Протестируй индикатор/робота перед покупкой
Хочешь зарабатывать в Маркете?
Как подать продукт, чтобы его покупали
Технические индикаторы для MetaTrader 5 - 23
NtickChart-BVcandle Features This is a free version with limited functionality.
This is a tick chart indicator that displays in a sub-window. Inspired by Bob Volman's (BV) scalping method, it is designed as a tool for achieving simple and effective trading. It is a tick chart specifically for day trading and scalping, focusing even on 1 pipette changes. Instead of time-based candle bars, it generates candle bars for a specified number of ticks (ticks_in_candle). This allows for a more detailed
FREE

Рынок несправедлив, хотя бы потому, что всего лишь 10% игроков управляют 90% капитала. У рядового трейдера мало шансов, чтобы противостоять этим «хищникам». Но выход есть, необходимо всего лишь перейти на другую сторону, необходимо находиться в числе этих 10% «акул», научиться распознавать их намерения и двигаться вместе с ними. Объем - это единственный опережающий фактор, который безупречно работает на любом периоде и любом торговом инструменте. Сначала зарождается и накапливается объем, и толь

VWAP для скальперов
Осведомленные об этапе линии VWAP для быстрых, точных скальпов. ️ Параметры (MT4/MT5) Enable_Hourly_VWAP: Включить почасовой VWAP. Enable_Asia_VWAP: Включить VWAP сеанса Азии. Enable_Europe_VWAP: Включить VWAP сеанса Европы. Enable_NA_VWAP: Включить VWAP сеанса Северной Америки. Enable_Extended_VWAP: Включить расширенный VWAP сеанса. Enable_Daily_VWAP: Включить дневной VWAP. Сеанс Азии (GMT) Session_Asia_Start_Hour: Время начала сеанса Азии. Session_Asia_End_Hour: Время око
FREE

Smart Risk Manager Dashboard is a MetaTrader 5 indicator designed to assist traders with structured risk control and real-time account monitoring.
It provides a visual interface for managing position size, tracking losses and gains, and setting custom trading limits. Key Features SL/TP Risk Calculator
Displays estimated risk and reward directly on the chart using adjustable horizontal lines. Live Dashboard with Metrics
Shows equity, balance, daily gain/loss, trade count, and other key values i

Like most things that work in trading, it's really simple. However, it's one of the most powerful tools I have that makes entries of many systems much more precise.
In its essence, it measures the recent volatility against the medium-term average. How does it work? Markets tend to be prone to strong trending movements when relative volatility is low and tend to be mean-reverting when relative volatility is high.
It can be used with both mean-reversion systems (like the Golden Pickaxe) and mo
FREE

This is a buyer and seller aggression indicator that analyzes the shape of each candle and project this data in a histogram form. There are 4 histograms in one. On the front we have two: Upper - Buyer force. Lower - Seller force. At the background we also have two histogram, both with same color. They measure the combined strenght of buyers and sellers. This histograms can be turned off in Input Parameters. It is also possible to have the real or tick volume to help on this force measurement. IN
FREE
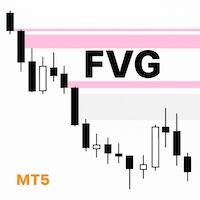
What Makes UTurn FVG indicator Unique I’m a trader, and I built a simple and clean FVG indicator that focuses on what traders actually need. Flexible color and transparency settings. The option to extend unmitigated and partially mitigated FVGs to the current price. Automatic removal of fully mitigated FVGs. Clear visual confirmation when an FVG has already been tested. A clean, professional look that helps traders make faster, more confident decisions. Overview UTurn FVG is a clean, efficient,
FREE
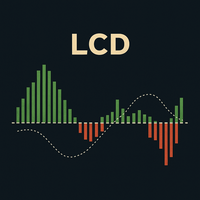
LCD Laguerre Convergence Divergence: Усовершенствованный MACD LCD Laguerre Convergence Divergence — это продвинутый технический индикатор, разработанный для улучшения классического MACD, который обеспечивает более быстрое, чувствительное и адаптивное обнаружение импульса. Его основное преимущество — использование фильтров Лагерра , которые реагируют на изменения цены более точно, чем традиционные скользящие средние. Ключевые преимущества Более высокая чувствительность и меньшая задержка: Фильтры
FREE
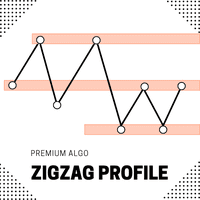
Introducing the ZigZag Profile — a powerful tool designed to identify high-probability pivot zones where price action frequently reverses. This indicator analyzes historical price data to pinpoint key areas where price has pivoted multiple times, providing traders with actionable insights into potential support and resistance levels. The ZigZal Profile indicator continuously scans for zones where price has reversed direction the most, highlighting these critical areas on your chart. By focusing
FREE
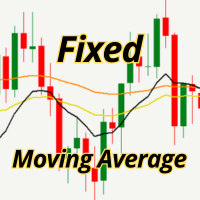
Display any moving average at its original timeframe, regardless of the chart’s timeframe.
What does it do?
This indicator allows you to view a moving average from any timeframe (M5, H1, H4, D1, etc.) directly on your current chart, preserving its original values from the timeframe you selected.
Practical example:
You are trading on the M5 timeframe.
You activate the H1 MA with this indicator.
You see exactly the same line you would see if you switched to H1.
Without changing the timefra
FREE

The Simple ICT Concepts Indicator is a powerful tool designed to help traders apply the principles of the Inner Circle Trader (ICT) methodology. This indicator focuses on identifying key zones such as liquidity levels, support and resistance, and market structure, making it an invaluable asset for price action and smart money concept traders.
Key Features Market Structure: Market structure labels are constructed from price breaking a prior swing point. This allows a user to determine the curren

Введение в Harmonic Pattern Plus Индикатор Harmonic Pattern Plus, предназначенный для работы в MetaTrader 5, ищет на графике гармонические модели. Программа Harmonic Pattern Plus предназначена для определения точек разворота текущего тренда - она находит гармонические модели с высокой силой прогнозирования. Гармонические модели состоят из нескольких линий, объединенных важными соотношениями Фибоначчи, такими как 0,618 и 0,382, которые часто используются профессиональными трейдерами для измерения

I'm sure after a lot of research on the internet, you haven't found any indicator that can help you with forex or binary trading in the latest probability strategy created by famous trader Ronald Cutrim. The strategy is based on a simple count of green and red candles, checking for a numerical imbalance between them over a certain period of time on an investment market chart. If this imbalance is confirmed and is equal to or greater than 16%, according to trader Ronald Cutrim, creator of the pro
FREE

BreakHarmony Multi-Timeframe Breakout Indicator for MT5
The BreakHarmony Multi-Timeframe Breakout Indicator for MT5 is a highly advanced tool providing information on breakout points across different timeframes, aiding traders in decision-making and understanding market movements. [ Features and Manual | MT4 version | All Products ] The indicator tracks breakout points on price charts across 6 timeframes. Breakout prices are indicated with the closing price of the correspondi
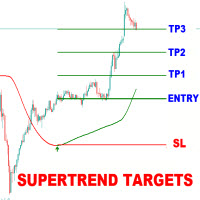
Supertrend Targets Signal is a powerful trend-following and breakout confirmation indicator designed to help traders identify high-probability entry points , visualize dynamic target zones , and receive clean, reliable signals across various market conditions. The core trend logic is built on a custom Supertrend that uses an ATR-based band structure with long smoothing chains—first through a WMA, then an EMA—allowing the trend line to respond to major shifts while ignoring noise. A key addition

Индикатор анализирует объём из любой точки и рассчитывает уровни рыночного истощения для этого объёма. Основные линии Meravith: Линия бычьего объёмного истощения – служит целью. Линия медвежьего объёмного истощения – служит целью. Линия, указывающая рыночный тренд. Она меняет цвет в зависимости от того, является ли рынок бычьим или медвежьим, и служит трендовой поддержкой. Как использовать: дважды щёлкните по вертикальной фиолетовой линии и переместите её в нужную позицию. Вы можете анализироват
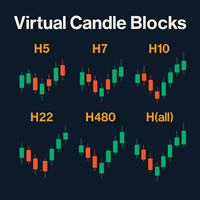
Virtual Candle Blocks – Визуализируйте рынок без ограничений Virtual Candle Blocks — это продвинутый индикатор для MetaTrader 5, который позволяет создавать и отображать свечи любого пользовательского таймфрейма, включая те, что недоступны на платформе изначально. Основные особенности: Пользовательские таймфреймы: Индикатор группирует базовые свечи графика в блоки любой желаемой продолжительности (например, 5ч, 14ч, 28ч, 72ч и т.д.), чтобы создать новую виртуальную свечу. Это дает вам доступ к у
FREE

Профессиональный инструмент для торговли - индикатор дивергенции между AO и ценой, позволяющий своевременно получать сигнал о развороте тренда или ловить движения откатов цены (в зависимости от настроек). Настройки индикатора позволяют регулировать силу дивергенции за счет угла наклона пиков AO и процентного изменения цены, что даёт возможность тонко настроить силу сигнала. Код индикатора оптимизирован и в составе советника очень быстро тестируется. Индикатор не перерисовывает, стрелки для на
FREE

This indicator is an MQL5 port inspired by the "Cyclic Smoothed RSI" concept originally developed by Dr_Roboto and popularized by LazyBear and LuxAlgo on TradingView. The Cyclic Smoothed RSI (cRSI) is an oscillator designed to address the two main limitations of the standard RSI: lag and fixed overbought/oversold levels. By using digital signal processing (DSP) based on market cycles, the cRSI reduces noise without sacrificing responsiveness. It features Adaptive Bands that expand and contract
FREE

Этот вспомогательный постоянно обновляющийся индикатор отображает время, оставшееся до закрытия на текущем таймфрейме. Также он показывает цену последней сделки и отклонение от уровня закрытия предыдущего дня. Индикатор полезен дневным трейдерам и скальперам, которые пристально следят за открытием и закрытием свечей.
Настройки индикатора Show in shifted end - по умолчанию: False. Отображение времени и значения на экране. При значении True отображается только время до закрытия возле последней св
FREE

Velas Multi Time Frame
Las velas multi time frame, también conocidas como "MTF candles" en inglés, son un indicador técnico que permite visualizar velas japonesas de un marco temporal diferente al marco temporal principal en el que estás operando. Este enfoque ofrece una perspectiva más amplia del comportamiento del precio, lo que resulta especialmente útil para los traders que emplean estrategias de acción del precio. A continuación, se detallan los conceptos clave relacionados con este indic
FREE

Megatron Shark Indicator – MT5 Harmonic Pattern Detection Tool The Megatron Shark Indicator is a MetaTrader 5 tool for detecting and displaying Shark harmonic patterns directly on the chart. It automatically identifies bullish and bearish Shark formations, calculates entry, stop-loss, and take-profit levels, and provides real-time alerts. This allows traders to quickly integrate harmonic pattern analysis into their trading process without manual drawing. Advantages * Automatic Pattern Detection
FREE

Индикатор отображает кластеры объёма либо профили объёма на выбор. Для торговых символов, содержащих ленту сделок, индикатор может производить вычисления на основании ленты сделок.
Описание входных переменных
StepPoint - шаг кластера в пунктах, при значении равном нулю назначается автоматически. HistoryTicks - размер тиковой истории (для VolumeType в режиме TimeAndSales). AssociatedTimeframe - привязка индикатора к заданному таймфрейму графика, при значении равном Current индикатор работает на
Strifor Pivot ATR Target Индикатор пивот-уровней с ATR-целями и аналитической панелью
для MetaTrader 5 Strifor Pivot ATR Target — это инструмент для внутридневной и среднесрочной торговли, объединяющий классические пивот-уровни с динамическими целями по ATR и расширенной аналитической панелью. Индикатор помогает заранее оценивать торговый диапазон, вероятные зоны реакции цены и потенциал движения, исключая ручные расчёты и субъективные предположения. Основные возможности Автоматическое построени
FREE

TurnPoint Indicator – Market Reversal & Trend Signal Tool The TurnPoint Indicator is designed to help traders identify potential turning points and key levels in the market. By analyzing price action, it highlights areas where reversals or continuations are likely to occur, allowing traders to anticipate trend changes more effectively. This tool incorporates advanced logic to filter signals, reducing noise and false alerts. Users can choose between breakout and pullback modes, depending on their
FREE

If you like this free tool, check out my EA which is currently on a Launch Sale for only $39 ! Title: [Overview] Universal Smart Monitor Pro: Automated Fibonacci & Price Action System Say goodbye to manual charting! Universal Smart Monitor Pro is a professional-grade technical analysis system that combines Fibonacci Retracements with Price Action logic. With a fully upgraded core, this algorithm is now universally compatible across all markets. It automatically adapts to the volatility characte
FREE
Легендарные уровни Уильяма Ганна в полностью автоматизированном индикаторе для MT5. GANN Master точно определяет ключевые зоны, в которых с наибольшей вероятностью цена может развернуться или продолжить движение, основываясь на данных за день, неделю и месяц. Основные возможности: Однокликовые кнопки выбора периода: нажмите Daily, Weekly или Monthly, чтобы мгновенно построить зоны за текущий день, неделю или месяц Автоматический и ручной режимы
• Автоматический : GANN Master сам вычисляет все ур

Lot Size Calculator - Smart Risk Management Tool
The Lot Size Calculator is a simple but powerful MetaTrader indicator that helps traders manage risk with precision. Instead of guessing your position size, this tool instantly calculates the exact lot size you need based on your account equity, chosen risk percentage, and reward ratio (1:1, 1:2, etc.).
Features:
Input your account equity and risk % per trade Supports both long (buy) and short (sell) trades Automatically adjusts for diffe
FREE

DiverX - это мощный многофункциональный индикатор дивергенций, разработанный для платформы MetaTrader 5 . Он позволяет выявлять как регулярные, так и скрытые дивергенции на основе пяти популярных технических индикаторов: RSI (Relative Strength Index) , RVI (Relative Vigor Index) , Stochastic Oscillator , CCI (Commodity Channel Index) и MACD (Moving Average Convergence Divergence) . Индикатор отображает результаты непосредственно на основном графике, предоставляя визуальные линии, стрелки и метк
FREE
Important: The price will increase to 150$ after 8 more purchases Every buyer of this indicator also receives for free: The exclusive Signal Reacter EA, which automatically executes every Signal a step-by-step guide to help you install the Signal Capturer Note: To claim your free EA, just send me a quick message on MQL5.
I present to you the original, self-developed tool that grabs premium signals from top services like the Divergence Bomber, Algo Pumping and Grabber System.
An instructional
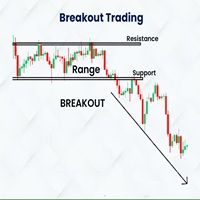
Indicador Basado en la estrategia de ruptura del rango de londres de Amaury Benedetti.
Este indicador dibuja automaticamente el rango, el maximo y minimo y sus correspondientes lineas de stoploss, entrada y takeprofit.
SE RECOMIENDA USAR EN M1 EN EL US30 (DE ACUERDO A LA ESTRATEGIA)
Los valores se pueden modificar de acuerdo a la necesidad del usuario, tambien se tienen mas configuraciones para dibujar cualquier rango en diversos horarios y con diferentes configuraciones de sl, tp, etc
Detal
FREE

Индикатор SMC Venom Model BPR — профессиональный инструмент для трейдеров, работающих в рамках концепции Smart Money (SMC). Он автоматически идентифицирует на графике цены два ключевых паттерна: FVG (Fair Value Gap) — комбинация их трёх свечей, в которой имеется разрыв между первой и третьей свечой. Формирует зону между уровнями, где отсутствует поддержка объемов, что часто приводит к коррекции цены. BPR (Balanced Price Range)— комбинация двух FVG-паттернов, образующих «мост» — зону пробо
Simple Spread Indicator (SSI) is a simple and lightweight indicator that displays the current spread value directly on the main chart window.
It helps traders instantly recognize market liquidity conditions and trading costs without opening additional panels or tools. Features Real-time spread display on the main chart Customizable position and font size Minimal system load and no data buffering Useful for scalping and low-spread strategy monitoring How it works The indicator calculates the diff
FREE

USD STRENGHT VERSUS MARKET USD (DXY) Versus Market Panel is a professional visual indicator designed to analyze US Dollar strength and pressure against major trading symbols in real time. The indicator compares USD performance (based on DXY logic or internal strength calculation) versus selected symbols, allowing traders to quickly identify dominant currency flow, relative strength, and market bias from a single panel view. Built with a clean, lightweight, and non-intrusive panel , this tool hel
FREE
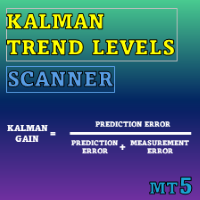
Special offer : ALL TOOLS , just $35 each! New tools will be $30 for the first week or the first 3 purchases ! Trading Tools Channel on MQL5 : Join my MQL5 channel to update the latest news from me Kalman Trend Levels — это продвинутый индикатор следования за трендом, который использует передовую технологию фильтра Калмана для предоставления трейдерам мощных аналитических сигналов. Разработанный для точности и адаптивности, этот инструмент не только выявляет ключевые зоны поддержки

Скользящая средняя RAINBOW Forex-трейдеры применяют скользящие средние по разным причинам. Кто-то использует их в качестве первичного аналитического инструмента, а кому-то они служат ориентиром для принятия инвестиционных решений. Здесь мы представим немного иные виды стратегий, а внедрение их в ваш стиль торговли зависит от вас! Техника, применяемая в техническом анализе для определения изменений трендов. Создается посредством размещения большого количества скользящих средних на одном графике.
FREE

The Bar Time Countdown indicator displays the remaining time before the current candle (bar) closes and a new one opens. It provides a clear, real-time countdown in minutes and seconds , helping traders precisely time their entries and exits during fast-moving markets — especially for scalping or breakout strategies. Designed with a clean, minimal interface , it automatically adjusts to any timeframe and symbol. The countdown is updated every second and positioned conveniently on the chart, with
FREE

Enjoy the Free Candle Color indicator.
Kijun Sen is an element of Ichimoku Kinko Hyo Indicator, it's far too complicated for many traders hence they tend to be confused. We have simplified it so the Kijun Sen will change colors as it activates without the Tenkan Sen, Senkou Span, Up Kumo and Down Kumo. Customize to your period parameter and colors of your choice. Great for beginners and seasoned traders. Set your period and enjoy
GOOD LUCK and ALL THE BEST IN YOUR TRADING JOURNEY !!!!!
FREE

ATR Based Swing Trader Indicator Description The ATR Based Swing Trader Indicator is a sophisticated technical analysis tool designed for MetaTrader 5 (MT5) to assist swing traders in identifying potential buy and sell signals based on the Average True Range (ATR) and trend direction. Developed by Rahulkumar Kanani, this indicator leverages volatility and price movement to generate actionable trading signals, making it suitable for traders who aim to capture short- to medium-term price swings in
FREE

The Spider ZIGZAG is an algorithm to determine how critical the current peak is by spreading several lines with different parameters instead of one line between each 2 peaks. 1. The more zigzag's lines meet at a peak the higher probability the market will go for correction or change direction. 2. Usually when 3-4 zigzag's lines meet at a peak, the market enters a correction period, this don't happen instantly, it might take some time. 3. Usually when 5-6 zigzag's lines meet at a peak, th
FREE
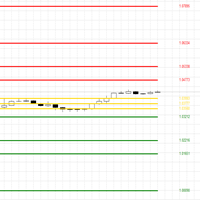
Индикатор CPR — это мощный инструмент технического анализа, разработанный для идентификации ключевых уровней поддержки и сопротивления на ваших графиках MetaTrader 5. Он рассчитывает Центральный Пивот (CP) как среднее значение максимальной, минимальной и закрывающей цен предыдущего дня, предоставляя центральную точку отсчета. Рассчитывает и отображает 11 уровней (CP, BC, TC, S1-S4, R1-R4) Настраиваемый период ретроспективы (по умолчанию: 5 дней) Возможность включения/отключения ценовых меток с р
FREE

Smart Grid MT5 автоматически распознает любой символ, период и масштаб графика и размечает его соответственно, есть возможность разметки графика по торговым сессиям. Сетка состоит из двух основных видов линий.
Вертикальные линии Имеют два метода визуализации: Standard - линии делятся на три типа, разделяющие: Малый временной период; Средний временной период; Большой временной период. Trading Session - линии делятся на группы (всего десять). В каждой группе по две линии: первая отвечает за откры
FREE

My Fibonacci MT5 An automated Fibonacci indicator for MetaTrader 5 that combines ZigZag swing detection with comprehensive Expert Advisor integration through a 20-buffer system. More details about data specification and EA integration: https://www.mql5.com/en/blogs/post/764114 Core Features Automated Fibonacci Detection The indicator identifies swing points using configurable ZigZag parameters and draws Fibonacci retracements and extensions automatically. It updates levels as new swing formatio
FREE
FULL VERSION https://www.mql5.com/en/market/product/145203?source=Site https://www.mql5.com/en/users/gedeegi/seller
GEN TurboTrend Signals is an adaptive volatility-based trend indicator designed to help traders identify dominant trend directions, key momentum transition points, and projected profit-taking zones in a visual and intuitive manner. The indicator utilizes a temporally-weighted moving average combined with statistical dispersion via standard deviation to construct a dynamic volati
FREE

This Supertrend strategy will allow you to enter a long or short from a supertrend trend change. Both ATR period and ATR multiplier are adjustable. If you check off "Change ATR Calculation Method" it will base the calculation off the S MA and give you slightly different results, which may work better depending on the asset. Be sure to enter slippage and commission into the properties to give you realistic results. If you want automatic trade with Supertrend indicator, please buy following pr
FREE
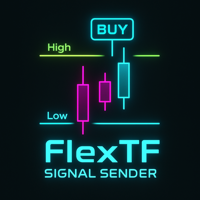
FlexTF Signal Sender — Индикатор подтверждения касания High/Low на разных таймфреймах Официальный канал Обновления, инструменты и документация: Открыть официальный канал MQL5 | Описание FlexTF Signal Sender — это многофреймовый индикатор подтверждения уровней High/Low. Он считывает High/Low со старшего ТФ (H1/H4/D1), отслеживает взаимодействие цены и подтверждает BUY/SELL по свечам младшего ТФ (M5/M15/M30). Индикатор содержит фильтры, защиту от повторных касаний, логику пробоя и стильную н
FREE
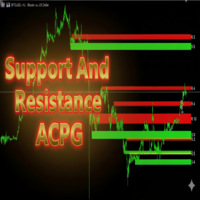
Support And Resistance ACPG Indicator
The Support And Resistance ACPG Indicator (developed by Grok by xAI) is an advanced tool for the MetaTrader 5 (MQL5) platform, designed to identify and visualize support and resistance zones on a price chart. Unlike traditional support and resistance indicators, the ACPG method combines a dynamic approach based on swing points, volatility analysis using the Average True Range (ATR), and an adaptive clustering system to detect high-relevance zones in the
FREE

Fundamentação teórica A VWAP é uma média móvel ajustada pelo volume, ou seja o peso de cada preço corresponde ao volume de ações negociadas no período, dando mais importância ao período em que se tenha mais negociações. [1] VWAP = sum(price[i]*volume[i]) / sum(volume[i]) Metodologia É possível configurar o período que será utilizado para o calculo da VWAP, a cor, a espessura e o estilo da linha. A linha é desenhada desde a o começo da série disponível apenas uma vez para economizar recursos com
FREE

Совершение сделок может быть довольно утомительным, когда вам нужно смотреть на несколько вещей одновременно.
Формат свечей, поддержек, сопротивлений, графиков, новостей и индикаторов.
Этот инструмент призван облегчить анализ индикатора ADX. Раскрашивает свечи в зависимости от уровней индикатора и линий DI.
Период, лимит индикатора и цвета свечей настраиваются. Вы также можете разместить наглядное пособие в нижней правой части графика, чтобы просмотреть значения ADX, DI + и DI-.
FREE
This indicator is a sophisticated MetaTrader 5 tool that calculates and displays Average Daily Range (ADR) levels on your chart. It draws horizontal lines representing expected price movement ranges based on historical daily volatility, helping traders identify potential daily high and low targets. ADR (Average Daily Range) = The average difference between the daily high and low over a specified period (default: 14 days). Unlike ATR which includes gaps between days, ADR focuses purely on int
FREE

Индикатор VR Grid разработан для создания графической сетки с настройками, определяемыми пользователем. В отличие от стандартной сетки VR Grid используется для построения круглых уровней . В зависимости от выбора пользователя, шаг между круглыми уровнями может быть произвольным. Кроме того, в отличие от других индикаторов и утилит, VR Grid сохраняет положение сетки даже при изменении временного периода или перезагрузке терминала. Настройки, set файлы, демо версии, инструкции, решение проблем, мо
FREE

The indicator represents the session boxes for the Asian, European and American sessions. It is possible to change the time of each session, such as color. It is also possible to disable the display of each session. You will find in input parameters variables to modify in format hh:mm. In Colors tab you can change the color of boxes of each sessions. If you need some implementations please contact me.
FREE
Volume Flow Indicator (VFI) - User Manual 1. General Introduction The Volume Flow Indicator (VFI) is an advanced technical oscillator designed to measure the strength and sustainability of a price trend by incorporating both price and volume data. Developed based on the concepts of On-Balance Volume (OBV) but with significant improvements, the VFI provides deeper insight into money flow and the conviction behind price movements. This indicator is not an automated trading system but a powerful an
FREE
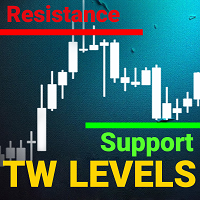
support resistance levels indicator mt5:
Этот инструмент является индикатором многовременных рамок, который определяет и отображает линии поддержки и сопротивления, а также уровни Фибоначчи на графике с такой же точностью, как человеческий глаз. Уровни поддержки и сопротивления TW для форекс имеют сложный алгоритм, который сканирует график для определения предыдущих уровней стабилизации цен и отскоков, фиксируя количество касаний.
Вы устали вручную рисовать уровни поддержки и сопротивления и

Read This : Please provide comments and reviews for future improvements. WaveTrendPro_Indi v1.05
WaveTrend indicator with enhanced histogram visualization: WaveTrendPro_Indi v1.05
Indikator WaveTrend dengan tampilan histogram yang lebih jelas: Histogram otomatis lebih tinggi (bisa diatur dengan parameter HistScale ). Warna histogram berbeda untuk positif & negatif → tren naik lebih mudah dibaca. Tetap ringan & responsif di berbagai pair/timeframe. Cocok untuk scalper, swing trader,
FREE

The Volume+ and VSA Signals indicator for MT5 is based on the Volume Spread Analysis (VSA) methodology to provide the signals. The signals are displayed at closing of bars on the main window or subwindow in the form of symbols. The symbols are not repainting. The indicator produces a signal on an individual bar and this signal is not buy or sell signal. When a minor trend goes in the opposite direction of a major trend, there are sequences of major trend-following signals that give a higher pro

Мультивалютный и мультитаймфреймовый индикатор Commodity Channel Index (CCI). В параметрах вы можете указать любые желаемые валюты и таймфреймы. Также индикатор может отправлять уведомления при пересечении уровней перекупленности и перепроданности. По клику на ячейке с периодом будет открыт данный символ и период.
Параметры CCI Period — период усреднения.
CCI Applied price — тип цены;
Clear the chart at startup — очистить чарт при старте;
Set of Pairs — набор символов
— Market Watch — п

The HammerStar indicator is designed to search for the Hammer and Shooting Star patterns on charts of any currency pairs.
Hammer Downward trend.
The lower shadow is not less than 2 and no more than 3 times larger than the body.
There is no upper shadow, or it is very short (no more than 10% of the candlestick range).
The color of the body in the long game is not important, with the short - white hammer is much stronger than the black one.
Confirmation is suggested.
Shooting Star Uptrend.
The u
FREE

TransitTrendlines this is a automatically trendline drawer, it draw both horizontal and diagonal trendlines. The horizontal trendlines are the pivot points of the day timeframe and the diagonal trendlines are based on the current time frames. You can adjust the diagonal trendlines by increasing the number of bars to draw the diagonal trendline and can also adjust the steepness. Note that the Horizontal trendlines are based on the day pivot points not currant time frame. Join mql5 transitbk98 cha
FREE

Volatility Break Signals Description:
The Volatility Break Signals is an indicator designed to detect potential trend changes while partially filtering market noise. It uses an adaptive volatility measure based on the selected price (Close, Open, High, Low, etc.) and generates Buy and Sell signals when the price shows a reversal relative to the previous direction. How it works: Price Volatility Measurement The indicator calculates the absolute price changes from bar to bar ( |price - previous
FREE

The Market Momentum indicator is based on the Volume Zone Oscillator (VZO), presented by Waleed Aly Khalil in the 2009 edition of the International Federation of Technical Analysts journal, and presents a fresh view of this market valuable data that is oftenly misunderstood and neglected: VOLUME. With this new approach of "seeing" Volume data, traders can infer more properly market behavior and increase their odds in a winning trade.
"The VZO is a leading volume oscillator; its basic usefulness
FREE
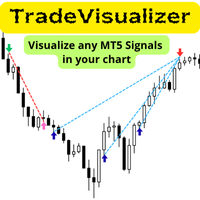
Индикатор Trade Visualizer оживляет ваши торговые данные, отображая полную историю сделок прямо на графиках MT5. Независимо от того, анализируете ли вы собственную производительность или исследуете сигналы трейдеров MQL5, этот инструмент превращает сырые торговые данные в наглядные визуальные элементы. Каждая сделка представлена стрелками входа и выхода, соединёнными линиями и подробными подсказками с ценами, прибылью, объёмом и пунктами — позволяя мгновенно понять логику и эффективность любой с
FREE
Индикатор "Step Channel Momentum Trend" (MT5 Indicator) Step Channel Momentum Trend — мощный индикатор, основанный на импульсах, предназначенный для того, чтобы дать трейдерам адаптивное преимущество, сочетая структуру рынка с динамическим анализом волатильности. Этот инструмент помогает четко отделить тренд от диапазона, не полагаясь на методы сглаживания, подверженные задержкам, используя уникальную ступенчатую среднюю линию и ATR-фильтрованный канал. Основные функции Структурная ступенчатая
FREE
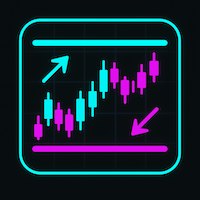
ATT Support and Resistance— лёгкий индикатор для MetaTrader, который в реальном времени находит локальные максимумы и минимумы по фрактальному принципу и автоматически строит по ним значимые уровни поддержки и сопротивления. Убирает «шум» близко расположенных линий и обновляет зоны при каждом новом тике без лишней нагрузки на терминал. Другие разработки: Здесь
Преимущества ATT Support and Resistance: Быстрое выявление ключевых ценовых зон на любом таймфрейме Автоматическая фильтрация близких у
FREE

Вилка Нео v5, разрабатывалась для торговой системы "Оракул", но постепенно дополнялась, например - углами Ганна и другими опциями... Можно создавать графические объекты с заданным цветом, стилем и толщиной, такие как: прямоугольники с заливкой и без, отрезки трендлиний и нестандартный инструмент - "вилка Нео" в виде трезубца, так же есть возможность интерактивно настраивать цветовую палитру прямо с графика, настраивать видимость объектов для разных ТФ, толщину и стили...
Панель переключается кл
FREE
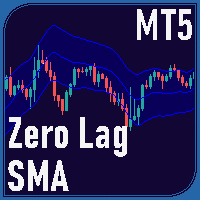
Zero Lag SMA для MT5 Индикатор Zero Lag SMA (ZLSMA) для MT5 представляет собой модификацию простой скользящей средней (SMA), разработанную для минимизации запаздывания, что позволяет быстрее реагировать на изменения цен. Это делает его полезным для определения потенциальных разворотов тренда и ключевых уровней цены своевременно. Основные характеристики: Расчет без запаздывания : В основе этого индикатора лежит метод двойного сглаживания, который уменьшает запаздывание, обеспечивая более быструю
FREE
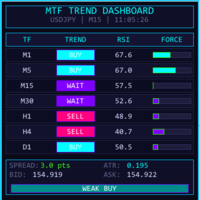
MTF TREND DASHBOARD – Многофреймовый анализатор тренда Мощная визуальная панель, отображающая направление тренда одновременно на 7 таймфреймах (M1, M5, M15, M30, H1, H4, D1). === ОСНОВНЫЕ ОСОБЕННОСТИ === Мгновенное определение тренда на нескольких таймфреймах с помощью пересечения EMA Значения RSI с цветовой индикацией перекупленности/перепроданности Динамические индикаторы силы тренда Общий рыночный сигнал (Strong Buy/Sell, Bias, Weak, Neutral) Онлайн-отображение спреда, ATR, Bid/Ask Современна

Скользящая средняя Т3 Тиллсона была представлена миру технического анализа в статье «Лучшая скользящая средняя», опубликованной в американском журнале Technical Analysis of Stock Commodities. Разработанный Тимом Тиллсоном, аналитики и трейдеры фьючерсных рынков вскоре увлеклись этой техникой, которая сглаживает ценовой ряд, уменьшая при этом лаг (лаг), типичный для систем следования за трендом.
FREE

Наиболее важным ценовым уровнем в любом "Профиле объема" является "Точка контроля" . Это ценовой уровень с наибольшим торговым объемом. И в основном это уровень, на котором крупные игроки начинают свои позиции, так что это уровень накопления/распределения для умных денег.
Идея индикатора возникла после того, как сделали индикатор "MR Volume Profile Rectangles" . При создании индикатора "MR Volume Profile Rectangles" мы потратили много времени на сравнение объемов с объемами из профиля объемов в

ADR, AWR & AMR Indicator: Comprehensive Trading Guide Try "Average Daily Range Scalper":
https://www.mql5.com/en/market/product/154469 Core Concepts ADR (Average Daily Range) Definition : The average distance between daily high and low prices over a specified lookback period (typically 14-20 days) Purpose : Measures daily volatility expectations, identifies range-bound versus trending days, sets realistic intraday profit targets Key Insight : Markets tend to respect their average volatility - d
FREE
MetaTrader Маркет - торговые роботы и технические индикаторы для трейдеров, доступные прямо в терминале.
Платежная система MQL5.community разработана для сервисов платформы MetaTrader и автоматически доступна всем зарегистрированным пользователям сайта MQL5.com. Ввод и вывод денежных средств возможен с помощью WebMoney, PayPal и банковских карт.
Вы упускаете торговые возможности:
- Бесплатные приложения для трейдинга
- 8 000+ сигналов для копирования
- Экономические новости для анализа финансовых рынков
Регистрация
Вход
Если у вас нет учетной записи, зарегистрируйтесь
Для авторизации и пользования сайтом MQL5.com необходимо разрешить использование файлов Сookie.
Пожалуйста, включите в вашем браузере данную настройку, иначе вы не сможете авторизоваться.