Смотри обучающее видео по маркету на YouTube
Как купить торгового робота или индикатор
Запусти робота на
виртуальном хостинге
виртуальном хостинге
Протестируй индикатор/робота перед покупкой
Хочешь зарабатывать в Маркете?
Как подать продукт, чтобы его покупали
Технические индикаторы для MetaTrader 5 - 47

This indicator allows us to identify unusual volatility conditions.
If the ATR line is below the middle bollinger line, volatility is assumed to be below average. If the ATR line is above the middle bollinger line, volatility is assumed to be above average.
If the ATR line breaks the upper bollinger band, volatility is assumed to be high. If the ATR line breaks the lower bollinger band, volatility is assumed to be low.
FREE

MyHistogram The MyHistogram indicator is a tool designed to help users visualize the distance between price extremes and a moving average. By calculating and displaying this distance in a histogram format, it allows to quickly assess market trends, spot potential reversals, and make more informed trading decisions. The indicator is highly customizable, enabling users to select different timeframes, moving average types, and applied price settings. Additionally, it features a color-coded syste
FREE

Monte Carlo simulation is an Indicator that uses a Monte Carlo model to calculate the probability of the price going up or down. If the price has a probability of going up or down more than 90%, the system will enter a trade by doing a back test of gold assets. It was found that it was able to generate a return of more than 20% in a period of 5 months while having a MAX DD of less than 7%.
What is a Monte Carlo simulation?
A Monte Carlo simulation is a model used to predict the probability of
FREE
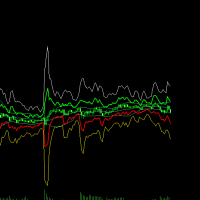
Here's a clearer, more organized description for the indicator: An enhanced ATR Bands indicator that provides flexible, configurable price bands based on Average True Range (ATR). While traditional ATR-based indicators often have limitations in their configurability and functionality, this version offers comprehensive features for both stop-loss and take-profit level calculations. Key Features: Configurable source price (close, high, low) for ATR band calculations Adjustable scaling factors wit
FREE

The DailyWeeklyMarkers indicator helps traders visualize trading weeks by clearly marking the start of each day and week on the chart. It draws vertical separator lines for each day (including weekends if enabled) and highlights the beginning of new trading weeks with double lines for better clarity. This makes it easier to analyze price action within daily and weekly contexts. Who Is This Indicator For? Swing Traders – Helps identify weekly opening gaps and key levels. Day Traders – Vis
FREE

Volume Above Average Indicator - MQL5 Introduction The Volume Above Average Indicator is a custom indicator for the MetaTrader 5 (MQL5) platform that helps traders identify the current trading volume compared to the historical average. The indicator uses three different sensitivity levels to classify volume into weak, medium, and strong, providing a clear visualization of market momentum. Key Features Displays trading volume in a separate window. Compares the current volume with the historical a
FREE

Раскройте Потенциал Каждой Свечи с Индикатором Теней! Устали от поверхностного анализа ценовых движений? Хотите глубже понимать силу покупателей и продавцов на каждом временном промежутке? Представляем вашему вниманию Индикатор Теней – ваш незаменимый инструмент для визуализации и анализа скрытой динамики рынка! Этот мощный индикатор превращает невидимую борьбу между быками и медведями, отображаемую в размерах теней свечей, в четкую и информативную гистограмму прямо на вашем графике. Что такое
FREE

Triple Exponential Moving Average (TRIX) It is a strong technical analysis tool. It can help investors determine price momentum and identify oversold and overbought signals in a financial asset.
Advantages of having an indicator like TRIX.
One of the main advantages of TRIX over other trend-following indicators is its excellent filtering of market noise and its tendency to be an early rather than late indicator.
To aid in the operations, a coloring was configured to facilitate the identifica
FREE

Индикатор выделяет цветом места на графике, где цена движется в одном направлении непрерывно от выбранного количества свечей. Можно указать количество пунктов от начала движения, чтобы выделять только движения от этого количества. Может быть полезно для поиска разворотов или резких импульсов.
Так же рекомендую приобрести эту утилиту, для определения локальных недельных/месячных трендов и линий поддержек и сопротивлений. https://www.mql5.com/ru/market/product/61401
FREE
MT5用 サブウィンドウにスプレッドとBUY SWAP(BS)とSELL SWAP(SS)を表示するインジケーターです。
表示の文字フォントの大きさと色の設定、スプレッドの表示をPIPS表示もしくはPOINTS表示切替が可能ですので、チャートの色設定などに合わせて、お好みでご利用いただけます。 サブウィンドウの表示サイズに合わせて、その中央に表示するようになっています。
(ご協力お願いします!) こちらは無料でご利用いただけます。どうぞご自由にご利用ください。 もしよければ MS High Low indicator も紹介していますので、どうぞご参照の上、DEMO版のダウンロードをお試しください!
Happy Trading :)
FREE

This indicator idea comes from Tushar Chande called Qstick.
Technical indicators quantify trend direction and strength in different ways.
One way is to use the difference between close and open for each bar and to sum it up over a period of time.
The formual is:
Qstick (period ) = Average ((close-open ), period )
In this indicator, we can choose how to calculate body by two famous chart types. The first and default indicator settings are based on Heiken Ashi chart, and the second is based
FREE

This indicator shows the strength of each currency compared to the US dollar by calculating the rate of change in price over a specified time period. When you open the indicator, you'll see a list of different currencies on the price chart. Each currency will have a numerical value indicating its strength level compared to the US dollar, where: If the value is higher than the US dollar, it will be displayed in green, meaning that currency is stronger than the dollar. If the value is lower than t
FREE

Highly configurable Balance of Power (BOP) indicator.
Features: Highly customizable alert functions (at levels, crosses, direction changes via email, push, sound, popup) Multi timeframe ability Color customization (at levels, crosses, direction changes) Linear interpolation and histogram mode options Works on strategy tester in multi timeframe mode (at weekend without ticks also) Adjustable Levels Parameters:
BOP Timeframe: You can set the lower/higher timeframes for Balance of Power . BOP r
FREE

Это версия MT5. Это алгоритм для раннего обнаружения изменений тренда. Вы должны попробовать несколько значений для параметра мультипликатора (1 < <10 рекомендуется). На первый взгляд вы можете увидеть эффективные записи. Это, по сути, один из строк, что Гелег Faktor первоначально было. Но он был удален, потому что он больше не нужен. Других строк было достаточно для эффективности G.Faktor, но я все еще хотел поделиться этим. Всегда тест, прежде чем использовать его на живой счет, так что вы пол
FREE

G Channels – Efficient Adaptive Channel Indicator Introduction Channel indicators are widely used in technical analysis, offering valuable insights into price movements, trend identification, and volatility. Most channel-based indicators, such as Bollinger Bands and Keltner Channels, rely on a central tendency estimator (e.g., a moving average) combined with a volatility component to define upper and lower bands. The G Channels indicator takes this concept further by leveraging a highly efficie

Volumes ******************* Volumes для платформы секундных графиков Micro . ********************* Секундный график на порядок увеличит точность ваших входов и выходов. Секундный период , в привычном формате, позволит увидеть то, что ранее было скрыто. Бесплатные индикаторы, дополнят визуальную картину, что, в совокупности выведет вашу торговлю на новый уровень. Идеально подходит как скальперам, так и трейдерам торгующим внутри дня. Индикатор Volumes для платформы Micro. Входные парам
FREE

Based on two MA line indicators.
Looking at the histogram, if the value is greater than 0, the uptrend will increase, the bigger the value, the stronger the uptrend will be and vice versa, if the value is less than 0, the downtrend will decrease, the smaller the value, the stronger the downtrend . The necessary condition when entering a buy order is that the first histogram is greater than 0 and the current candle is closed, and enter the order when the second histogram appears. The necessary
FREE

FractalEfficiencyIndicator A ratio between 0 and 1 with the higher values representing a more efficient or trending market, It is used in the calculation of Perry J. Kaufman Adaptive Moving Average (KAMA), dividing the price change over a period by the absolute sum of the price movements that occurred to achieve that change. The Fractal Efficiency or also known as Efficiency Ratio was first published by Perry J. Kaufman in his book ‘Smarter Trading‘. This is mostly considered a filter for v
FREE

Double Correlation indicator (free) plots two windowed correlations in a separate window. the size of window is taken as input before the two symbols to correlate to. Two symbols are taken as an input parameters as well as period length. and the two correlations are computed with the currently shown symbol ex: input GBPJPY and AUDNZD. current symbol EURUSD then the following will be computed corr(EURUSD,GBPJPY) and corr(EURUSD,AUDNZD) The indicator can be useful to run a multi-symbol pair trad
FREE

During volatile market conditions brokers tend to increase spread. int OnCalculate ( const int rates_total, const int prev_calculated, const datetime &time[], const double &open[], const double &high[], const double &low[], const double &close[], const long &tick_volume[], const long &volume[], const int &spread[]) { int spread_array[];
FREE

The Digital Buy/Sell Power Indicator is an advanced, visually intuitive tool that monitors buying and selling pressure across timeframes (M1 to Monthly), displaying momentum on a 0-100 scale with glowing digital readouts. Equipped with a movable panel, timeframe toggle switches, and a weighted algorithm for accurate Buy/Sell/Neutral signals, it provides traders with precise, actionable market dynamics. All time frames can be used at once to give a better perspective of market direction. Lowerin
FREE
The Adaptive Trend Indicator is a dynamic trend-following tool that adjusts its sensitivity based on market volatility,
offering a more responsive alternative to classic moving averages.
It supports both SMA and EMA modes and changes color based on trend direction or crossovers, giving a clear visual cue for potential entries or exits. Read about recommended usage for different markets, timeframes and trading styles: Adaptive Trend Indicator
Features ATR-based period adaptation for responsive
FREE

Non-proprietary study of Joe Dinapoli used for trend analysis. The indicator gives trend signals when the fast line penetrates the slow line. These signals remain intact until another penetration occurs. The signal is confirmed at the close of the period. It is applicable for all timeframes. Parameters Fast EMA: period of the fast moving average. Slow EMA: period of the slow moving average. Signal EMA: period of the signal line. ************************************
FREE

Новостной индикатор. Показывает учётную ставку 12 стран(Австралия, Бразилия, Канада, Мексика, зона евро, Великобритания, Индия, Новая Зеландия, Швейцария, Соединенные Штаты, Южная Корея, Япония). Поможет проанализировать влияние учётной ставки на курс валют. Устанавливать индикатор имеет смысл на большие таймфреймы. Для улучшения информативности, есть смысл, изменить в настройках стиль индикатора нужной страны, таким образом, чтобы линия выделялась из общей массы индикаторов, как указано на перв
FREE

Индикатор временных рамок Wormhole для MetaTrader 5 (MT5) — это не просто еще один инструмент для торговли, это ваше конкурентное преимущество на финансовых рынках. Разработанный как для начинающих, так и для профессиональных трейдеров, Wormhole изменяет подход к анализу данных и принятию решений, помогая вам всегда быть на шаг впереди. Почему вам нужен (бесплатный) индикатор Wormhole Перехитрите конкурентов: Возможность отображать две временные рамки на одном графике одновременно означает, что
FREE

TrendVigor Index, as an RVI (Relative Vigor Index) indicator, is a technical analysis tool focusing on the intensity of price movement and trend sustainability. It measures the dynamic relationship among opening price, closing price, and full-cycle range to evaluate bull-bear vigor with 50 as the dividing line: a value above 50 indicates dominant bullish momentum, while a value below 50 signals bearish dominance. Its core functions include: 1. Trend Direction Identification: Determine the mai
FREE

Dynamic Indicator --> YKL_DinDX Dynamic Indicator that creates a Band based on the distance from moving average specified by the user. The indicator considers the period entered by the user in order to calculate the average distance from moving average, creating an upper band and a lower band. This indicator is utilized by EA YKL_Scalper, version 2.0 or superior.
FREE

Технический индикатор Trend Moving Average позволяет определить глобальное направление рынка. Данный технический индикатор создан для того, чтобы определить «линию наименьшего сопротивления» рынка и понять в какую сторону направлен тренд. Помимо классического использования МА, индикатор позволяет понять направленность рынка на основе динамики его значений. Так, если значение индикатора демонстрируют переход с нисходящего значения в восходящее (и наоборот) - это является дополнительным торговым с
FREE

SPREADEX e' un indicatore per MT4 e MT5 che indica la distanza dell'ASSET dal GP. il GP e' il prezzo del vero valore dell'ASSET sottostante ottenuto per stima. Il GP e' come una calamita, attira il prezzo dell'ASSET con alta probabilita' ed all'interno della stessa giornata di trading. Quindi SPREADEX indica quali sono gli asset piu distanti dal GP al momento in tempo reale. Fornendo un punto di vista al TRADER su quali asset concentrarsi e cercare eventuali segnali di inversione dei prezzi per
FREE

Indicador Monte Carlo Simulation Indicador faz uma regressão linear nos preços de fechamento do ativo escolhido e gera uma simulação de Monte Carlo de N preços aleatórios para definir 3 níveis de sobrecompra e 3 níveis de sobrevenda. O primeiro processo é a Regressão Linear dos preços de fechamento do ativo, no qual é regido pela equação: Y = aX + b + R Onde Y é o valor do ativo escolhido, X é o tempo, a é a inclinação da reta, b é a intersecção da reta e R é o resíduo. O resí
FREE

Dynamic Range Pro – Indicator Dynamic Range Pro is a technical indicator designed to visualize key market zones by plotting a dynamic channel based on price extremes. Main Features: Dynamic channel calculated using the highest highs and lowest lows over a specified period. Midline representing price equilibrium. Compatible with multiple instruments and timeframes. Inputs: PeriodPR: Sets the number of bars used for channel calculation. Functionalities: Highlights potential breakouts when price mo
FREE

Бинарный индикатор находит свечной паттерн "Поглощение" и рисует соответствующий сигнал для входа рынок. Имеет встроенные фильтры и панель для просчета количества успешных сделок. Демо версия является ознакомительной, в ней нет возможности изменять параметры. Полная версия . Особенности Работает для всех валютных пар и любых таймфреймов. Индикатор рассматривает комбинацию из 2-х или 3-х свечей в зависимости от настроек. Имеется возможность фильтровать сигналы путем настройки количества свече
FREE
Этот индикатор подходит для выявления тенденций, определения ценовых каналов и генерации торговых сигналов. Он сочетает в себе плавность, адаптивность и визуальную ясность, что делает его полезным для скальпинга, дневной торговли и свинг-трейдинга.
Технические подробности: Скользящая средняя Халла (HMA) – обеспечивает плавную линию тренда без задержек.
Super Smoother – уменьшает «шум» и создает плавную кривую.
Ширина канала – адаптируется к таймфрейму (например, уже для M1, шире для D1).
Ве
FREE

Объем - широко используемый индикатор в техническом анализе, однако есть вариант, который даже более полезен, чем сам объем: скользящее среднее объема.
Это не что иное, как скользящая средняя, применяемая к популярному индикатору Volume.
Как следует из названия, Volume + MA служит для отображения объема транзакций (совершенных покупок и продаж) определенного финансового актива в заданный момент времени вместе со скользящей средней этого же объема с течением времени.
Для чего это? С помощью
FREE
Advanced Trend Analyzer Pro MT5 The Ultimate Multi-Strategy Trend Analysis System That Never Repaints Transform Your Trading with Professional-Grade Market Analysis Advanced Trend Analyzer Pro MT5 is a revolutionary indicator that combines Fuzzy Logic , Multi-Timeframe Analysis , and Currency Strength Technology into one powerful trading system. Designed for serious traders who demand precision, reliability, and consistent performance across all market conditions. Why Choose Advanced Tr

Индикатор PipTick Fibo позволяет отображать уровни коррекции Фибоначчи, которые представляют собой значительные уровни поддержки и сопротивления. Диапазон для расчета индикатора может быть выбран из предыдущего дня, недели, месяца, года или заданной пользователем сессии.
Уровни 100 % (High) диапазона предыдущей сессии. 0 % (Low) диапазона предыдущей сессии. 76,4 % диапазона предыдущей сессии. 61,8 % диапазона предыдущей сессии. 50 % диапазона предыдущей сессии. 38,2 % диапазона предыдущей сесси
FREE

Logarithmic chart in new window You can use both chart as half or full window All features are active in both arithmetic and logarithmic charts Magnet in arithmetic chart is standard metatrader magnet in logarithmic chart magnet have two modes: first mode only select high or low, if this mode is enabled, you can set how many candles will be search before and after to find the highest or lowest points second mode select the closest point of the candle to click, its choose between 4 points (High,
FREE

The best Vwap Midas coding for Metatrader 5 you can find in White Trader indicators.
The indicator has been optimized not to recalculate (improving performance) and has several visual settings for you to adapt in your own way. TRY IT FOR FREE by clicking the free demo button Where and why to use Vwap Midas (and Auto Zig Vwap Midas) can be used on a variety of indices, currencies, forex, cryptocurrencies, stocks, indices and commodities.
Many successful traders use price and volume to get the

Versión Beta El indicador técnico Non Lag MA MTF (Non-Lagged Moving Average Multi-Time Frame) es una versión avanzada del Non Lag MA que permite visualizar la media móvil en varios marcos temporales simultáneamente. Pros: - Visión integral: Proporciona una visión más completa al mostrar la media móvil en diferentes marcos temporales en un solo gráfico. - Anticipación de tendencias: Ayuda a anticipar cambios de tendencia al observar la convergencia o divergencia de las medias móviles en distint
FREE

Индикатор тренда (флета) с ценовым каналом.
Торговля Покупка - цена пересекла центральную линию снизу вверх (свеча закрылась выше линии), канал ориентирован горизонтально (желтая линия) или вверх (зеленая линия). Перевод в безубыток после достижения ценой противоположной границы канала. Закрытие позиции после формирования условий для продажи. Продажа - цена пересекла центральную линию сверху вниз (свеча закрылась ниже линии), канал ориентирован горизонтально (желтая линия) или вниз (красная лин
FREE

Buy and sell signals based on Joe DiNapoli's shifted 3 period exponential moving average strategy for trend reversals.
Who is he? Joe DiNapoli is a professional trader and author that has been involved in the markets for more than 38 years. He is also a registered Commodity Trading Advisor (C.T.A.) for over 15 years and has taught his techniques in the major financial capitals of Europe, Asia, South Africa, the Middle East, Russia and in the United States.
How does the indicator work? The ind

Индикатор PipTick Retracement показывает текущее и историческое значения максимума, минимума и среднего значения. По желанию пользователя отображаются все основные уровни коррекции. Все эти уровни в сочетании формируют ключевые уровни поддержки и сопротивления. Всем видам трейдеров непременно необходимо осознавать эти уровни. Уровни High - максимум Low - минимум Midpoint - средняя точка 76,4 % 61,8 % 38,2 % 23,6 %
Основные характеристики Индикатор показывает текущие уровни High, Low, Mid и выбр
FREE

This indicator is designed according to the combination of WPR and Stoch indicators, when WPR goes up and Stoc goes up quickly too, the price may meet strong resistance, many times short order will take profit, but if the price break through it, Long positions are more likely to be profitable, and the reverse held true as well. You can adjust the parameters of WPR and Stoc to Adapt the symbol you operate. Click here to look the advanced edition: https://www.mql5.com/en/market/pro
FREE

RSI talking, use all your senses while trading!
The idea When trading your eyes might be very stressed. Therefore I programmed the RSItalking. Trade what you see and what you hear !
Function This indicator says "rsioverbought" when rsi is over a threshold value (default 75%) and "rsioversold" if it is under a lower threshold (default 25%). When you keep a long position be adviced to realize profit when the indicator tells you "rsioverbought" and vice versa. You will find an explanation of the
FREE

The indicator is based on the relationship between two sets of Stochastic lines. The first set consists of 6 Stochastic with periods: 5, 8, 10, 12, 14, 16. The second set consists of 6 Stochastic with periods: 34, 39, 44, 50, 55, 60. These periods are customizable. Input parameters Stochastic MA Method Method of calculation ===== Short-term ===== Stochastic #1 %K Period Stochastic #2 %K Period Stochastic #3 %K Period Stochastic #4 %K Period Stochastic #5 %K Period Stochastic #6 %K Period Short
FREE
**Переключайте Таймфреймы Мгновенно с TimeView!**
Индикатор TimeView для MetaTrader 5 позволяет переключаться на любой таймфрейм всего несколькими нажатиями клавиш. Никаких сложных меню, никаких поисков. Быстро, интуитивно и эффективно!
**Ключевые особенности:** Горячие клавиши: Активируйте панель цифровыми клавишами (1-6, 8). Настраиваемый: Изменяйте цвета, шрифты и размер панели. Все таймфреймы: Поддержка от M1 до MN1. Удобное управление: Подтверждайте Enter, отменяйте Escap
FREE
RTS5PatternBTCPrice is an analytical tool for MetaTrader 5 that systematically searches for historical similarities in price action and evaluates how the market behaved after similar situations.
The indicator provides both visual and statistical information that can be used to support trading decisions. It compares the current price pattern, defined by a selected number of candles, with historical data.
The similarity results are displayed using a histogram with three categories: Good Match –
FREE

This is Gekko's indicator of quotations and variations. It summarizes quotations and variations of the current symbol in different timeframes as well as other correlated symbols. Keep track of all this information on your chart while you are negotiating for decision making support. Input Parameters General Settings: configure which quotations and variations you want to keep track for current day, week, month or year as well as M1, M5, M15, M30, H1 and H4 charts; Symbols Configuration: add up to
FREE

MACD indicators https://mql5.com This MACD indicator looks slightly different from the MACD indicator found in many other charting software. When the value of the signal line parameter is greater than the value of the MACD parameter, the indicator will give a buy prompt, and when the signal line parameter is less than the value of the MACD parameter, the indicator will give a sell prompt.
FREE

Displays symbol tabs for easy access when trading, symbols that are coloured are symbols you have trades running on.
The indicator immediately shows the specified currency pair in the open window after clicking it. You no longer need to open a new window to view each chart thanks to the indicator. Additionally, it enables traders to concentrate on their trading approach by just keeping a small number of charts displayed.
FREE

This indicator will show the the change of volumes via 2 lines of SMA: . Fast line (default is 5 candles) . Slow line (default is 13 candles) We can use the crossing point of fast line and slow line to know investors are interesting in current price or not. Pay attention: The crossing point is not signal for entry. Absolutely that we must use in combination with other indicators for sure. Parameters: . Fast line periods: the periods (candles) to calculate SMA of fast line . Slow line periods: th
FREE

Double Line Donchian Channel MT5/Meta Trader 5 Indicator, this is customized Indicator to show only 2 Lines of Highest and Lowest PRICE line where you can add a MA (MOVING AVERAGE) for center line. What is Donchian Channel?
Donchian Channels are three lines generated by moving average calculations that comprise an indicator formed by upper and lower bands around a midrange or median band. The upper band marks the highest price of a security over N periods while the lower band marks the lowest p
FREE
Индикатор Custom ATR для торговли по горизонтальным уровням
Индикатор Custom ATR – это мощный инструмент, предназначенный для трейдеров, использующих горизонтальные уровни и понимающих важность среднего истинного диапазона (ATR) при принятии торговых решений. Этот индикатор вычисляет ATR на основе настраиваемого количества баров, фильтрует аномальные бары (слишком большие или слишком маленькие) и предоставляет наглядное отображение ключевых данных, включая значения ATR, количество пунктов для с
FREE
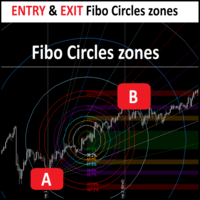
FiboCircles Zones — The Ultimate Price-Time Fibonacci Suite for MT5 Professional Geometry | Context-Aware Momentum | Cross-Timeframe Precision Elevate Your Analysis to Institutional Standards FiboCircles Zones is more than just a drawing tool; it is a high-precision Professional Analytical Framework for MetaTrader 5. It bridges the gap between classic technical analysis and advanced market geometry, allowing traders to identify "Price-Time Confluence" —those rare moments where geomet

The Buyside & Sellside Liquidity indicator aims to detect & highlight the first and arguably most important concept within the ICT trading methodology, Liquidity levels. SETTINGS
Liquidity Levels
Detection Length: Lookback period
Margin: Sets margin/sensitivity for a liquidity level detection
Liquidity Zones
Buyside Liquidity Zones: Enables display of the buyside liquidity zones.
Margin: Sets margin/sensitivity for the liquidity zone boundaries.
Color: Color option for buysid
Product Overview Enhanced MACD Pro is an advanced implementation of the classic MACD (Moving Average Convergence Divergence) indicator, enhanced with professional features for serious traders. This indicator combines traditional MACD analysis with modern alert systems and visual optimizations. Why Choose Enhanced MACD Pro? Multiple Alert Systems : 3 different alert modes to catch every trading opportunity Customizable Parameters : Full control over all MACD settings Professional Visualization
FREE

Индикатор измеряет и отображает разницу количества изменений цен "Bid" и "Ask" в виде цифровых, аналоговых и графических показателей. Предназначен для исследования рынка и для определения моментов выхода при скальпинговой торговле на периодах графиков не более одного часа (использование на старших периодах не запрещено, но не является информативным ввиду большого количества аккумулированных значений). Теория Цены "Bid" и "Ask" меняются не одновременно для большинства символов. Зачастую можно в
FREE
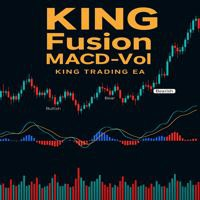
- وصف المنتج - مؤشر احترافي متكامل
لا يعد KING Fusion MACD-Vol من KING TRADING EA مجرد MACD آخر — فهو عبارة عن مجموعة أدوات تداول كاملة تجمع بين مؤشرات احترافية متعددة في نافذة فرعية واحدة أنيقة. لم تعد بحاجة إلى تحميل مخططك بأدوات منفصلة. يجمع هذا المؤشر بين:
MACD مع خطوط مزدوجة ورسم بياني مكبر
رسم بياني ملون ومثبت بالحجم
ملصقات ديناميكية مع قيم المؤشرات في الوقت الفعلي (ATR، ADX، RSI، Volume)
عداد تنازلي للبار
التنبيهات المتقاطعة (مرئية + صوتية)
كل ما تحتاجه من الوضوح والسرعة والدقة -
FREE

The idea behind this indicator is to find all currency pairs that are over-bought or over-sold according to the RSI indicator at one go.
The RSI uses the default period of 14 (this can be changed in the settings) and scans all symbols to find the RSI level you will have specified. Once currency pairs that meet the specification are found, the indicator will open those charts for you incase those charts aren't open and proceed to write the full list of currencies on the experts tab.
FREE
BBTrend is a powerful trend analysis tool designed to provide a clear overview of market volatility and trends at a glance.
This indicator calculates the difference between two Bollinger Bands of different periods,
visually indicating the strength of upward or downward trends to traders. Clear Trend Visualization: The upward trend is represented in green, and the downward trend in red,
allowing traders to intuitively grasp the direction and strength of the trend. Standardized Percentage Disp
FREE

Market Palette - мощный инструмент фильтрации торговых решений, основанный на инерции и ускорении ценовых колебаний. _________________________________ Как пользоваться сигналами индикатора: Индикатор формирует сигналы гистограммы, трёх различных цветов. В стандартной схеме цветового оформления при появлении столбцов синего цвета рекомендуется держать только длинные позиции, при появлении красных столбцов - только короткие, при появлении серых столбцов - воздержаться от торговых действий. Появле
FREE
Description: Candle Time is a simple and effective tool that shows the remaining time until the current candle closes — directly on your chart. Whether you’re trading fast moves or waiting for confirmations, knowing exactly when the candle ends helps you stay sharp. Main Features: Real-time countdown for the current candle Color adapts to candle direction (bullish, bearish, or neutral) Adjustable font, size, color source, position, and thickness Supports Visual Mode in the Strategy
FREE
Hi Traders, EMA is very popular indicator to determine: trend // support // resistance. Here are the use of this simple yet very powerful Multi-Time Frame indicator: 1- Attach this indicator to your chart . - Choose the desired time frame ( ex: Current, M15, H1, H4, D1,...). - Set your desired EMA periods ( ex: 20, 50, 100, 150, 200,...). - Enable which EMA you want to show by setting the relevant EMA to: True / False (you can show 1, 2, 3, 4 or all of 5 EMAs at the same time). - Set c
FREE

Unlock the Power of Scalping with this Essential Indicator for Any Currency Pair! Experience Crystal-Clear Buy/Sell Signals and Activate Instant Alerts for Maximum Precision.
Introducing the Ultimate Scalping Companion: Your Key to Precision Profits! Transform Your Trading Strategy with an Indicator that Stands the Test of Time! In the ever-evolving world of trading, consistent success hinges on smart risk management . While no tool can be the holy grail, our non-repainting indicator i
FREE

TP Audio Alert is a MetaTrader 5 custom indicator that plays a sound automatically whenever a trade position is closed at Take Profit (TP) . This tool is perfect for traders who want to be notified instantly without constantly watching the chart. Key Features: Plays sound when a TP position is closed Lightweight and does not clutter the chart No visual elements (zero plotted indicators) Simple and easy to configure Compatible with all symbols and timeframes How to Change the Sound File: Pla
FREE
The Periodic ATR Indicator visually compares the ATR values of each bar to the average ATR values for the same time of day over previous days. By contrasting the current ATR value with the historical average, this tool allows traders to identify exceptionally strong or weak market movements. It also helps to contextualize each market movement within the broader framework of long-term market behavior. This versatile indicator is compatible with all timeframes, including higher ones such as 4-hou
FREE

Trading Guide MT5 Indicator - Ultimate Trading Psychology Assistant Description
The Trading Guide MT5 Indicator is a powerful psychological trading assistant designed to keep traders disciplined, focused, and emotionally balanced. This innovative indicator displays real-time motivational messages, trading rules, and analysis guidelines directly on your chart, with vibrant blinking colors to capture your attention and reinforce proper trading habits.
Key Features
Real-Time Trading Psychology
FREE

SSACD - Singular Spectral Average Convergence/Divergence Аналог индикатора MACD на основе метода "Гусеница" Сингулярного Спектрального Анализа (ССА). Версия с ограничениями индикатора SSACD Forecast . Ограничения касаются набора параметров и их диапазона.
Специфика метода ССА является эффективной методикой обработки нестационарных временных рядов с неизвестной внутренней структурой. Метод позволяет находить заранее неизвестные периодичности ряда и строить прогноз исходя из обнаруженных закономе
FREE
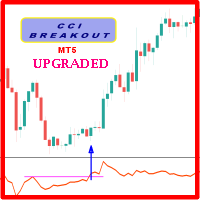
Probability emerges to record higher prices when CCi oscillator breaks out oscillator historical resistance level when exhibit overbought values. Since, oscillator breakout of support and resistance have similar effect as price breaks support and resistance levels, therefore, its highly advised to confirm price breakout with oscillator breakout; certainly, will have the same output in short trades. Concept is based on find swing levels which based on number of bars by each side of peak or troug
FREE

这是一个功能完整的MT5相关性矩阵指标。 主要功能 相关性矩阵显示 显示多个货币对之间的皮尔逊相关系数 正相关显示为绿色,负相关显示为红色 对角线显示为1.0(自身完全相关) 智能品种检测 支持自定义品种列表 自动匹配平台上可用的交易品种 处理不同经纪商的品种后缀 排序货币对列表 最高正相关货币对(前15名) 接近0相关性货币对(前15名) 最高负相关货币对(前15名) 自定义化设置 可调整计算周期 自定义更新频率 颜色、字体、位置等可视化参数 使用说明 输入参数 CorrelationPeriod : 相关性计算周期(默认60) UpdateInterval : 更新间隔毫秒数(默认1000) UseCustomSymbols : 是否使用自定义品种列表 CustomSymbols : 自定义品种列表(逗号分隔) MatrixPositionX/Y : 矩阵显示位置 SortedListX/YOffset : 排序列表位置 显示解读 绿色数值 : 正相关(越接近1相关性越强) 红色数值 : 负相关(越接近-1负相关性越强) 接近0的数值 : 相关性较弱 这个指标对于识别货币对之间的关
FREE
MetaTrader Маркет - уникальная площадка по продаже роботов и технических индикаторов, не имеющая аналогов.
Памятка пользователя MQL5.community расскажет вам и о других возможностях, доступных трейдерам только у нас: копирование торговых сигналов, заказ программ для фрилансеров, автоматические расчеты через платежную систему, аренда вычислительных мощностей в MQL5 Cloud Network.
Вы упускаете торговые возможности:
- Бесплатные приложения для трейдинга
- 8 000+ сигналов для копирования
- Экономические новости для анализа финансовых рынков
Регистрация
Вход
Если у вас нет учетной записи, зарегистрируйтесь
Для авторизации и пользования сайтом MQL5.com необходимо разрешить использование файлов Сookie.
Пожалуйста, включите в вашем браузере данную настройку, иначе вы не сможете авторизоваться.