Смотри обучающее видео по маркету на YouTube
Как купить торгового робота или индикатор
Запусти робота на
виртуальном хостинге
виртуальном хостинге
Протестируй индикатор/робота перед покупкой
Хочешь зарабатывать в Маркете?
Как подать продукт, чтобы его покупали
Технические индикаторы для MetaTrader 5 - 57
Этот индикатор распознает два мощных паттерна IDRN4 и IDNR7 на 28 парах при появлении нового дневного бара. IDNR4 - это сокращение от "Inside Day Narrow Range 4", где "Inside Day" - дневной бар с более низким максимумом и более высоким минимумом по сравнению с предыдущим баром, а "Narrow Range 4" - бар с самым узким диапазоном за последние 4 бара. Аналогично, "Narrow Range 7" - за последние 7 баров. Следовательно, ID/NR4 и более надежный ID/NR7 - это объективные критерии для определения дней с п
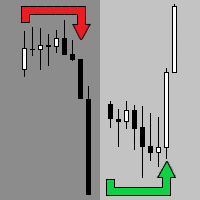
Индикатор показывает развороты рынка (точки входа).
Развороты позволяют отслеживать отбой/пробой/тестирование с обратной стороны линий графического анализа или индикаторов.
Развороты могут быть самостоятельным сигналом.
Индикатор позволяет определять развороты с учётом тренда и без . Можно выбирать разный период для движения, предшествующего развороту, а также коэффициент волатильности. При построении разворотов индикатор учитывает волатильность. Индикатор не перерисовывается .
Настройк

Как известно, работа по паттернам на рынке форекс это высший пилотаж торговли, то, к чему стремятся все трейдеры! У профессиональных трейдеров уходят годы на то, чтобы запомнить и научиться определять паттерны (фигуры и комбинации свечей) на графике, а затем по ним определять, куда будет двигаться цена. Паттерны - это различные комбинации японских свечей на графике, фигуры классического тех. анализа, а также любые закономерности в поведении рынка, которые повторяются многократно при одинаковых у

Индикатор PipTick Effort Index основан на работах спредового трейдера Картика Марара (Karthik Marar). Индикатор сравнивает изменение цены (результат) с объемом (усилие) за определенный период времени. Сравнивая результат с усилием, мы можем получить больше информации о будущем ценовом движении. Оба значения нормализуются и преобразуются в шкалу от 0 до 100% на основе выбираемого периода истории. Закон усилия и результата Согласно закону, изменение цены торгового актива является результатом усили

Индикатор отображает наличие на рынке тренда, его величину, направление, а также увеличивается ли он. Индикатор полезен для обнаружения флета при использовании трендследящих стратегий. Индикатор также сообщает о переходе рынка из флета в тренд, что может быть превосходной точкой входа. Алерт можно включить прямо на графике, поставив галочку. Также включает в себя бонус в виде индикаторов текущего спреда и цен спроса и предложения крупным текстом с изменением цвета при изменении цены.
Применение

T-Channel - индикатор технического анализа, который позволяет с достаточной вероятностью определять, когда на валютном рынке господствует тренд или флэт. Индикатор построен на TEMA (Triple Exponential Moving Average). Достоинство скользящей средней TEMA в том, что она обеспечивает меньшую задержку, нежели скользящая средняя с однократным или двойным сглаживанием. Индикатор может работать на любых таймфреймах, но для минимизации вероятности ложных сигналов следует выставлять таймфрейм от H1 и выш

Индикатор TEMA Trend построен на двух скользящих средних TEMA (Triple Exponential Moving Average) - быстрой и медленной. Достоинство скользящей средней TEMA в том, что она обеспечивает меньшую задержку, нежели скользящая средняя с однократным или двойным сглаживанием. Индикатор позволяет определить направление и силу тренда, а также смену тенденции, и может работать на любых таймфреймах. Восходящий тренд показан синим цветом линии индикатора, а нисходящий тренд - красным цветом. Закрывать коротк

Этот индикатор рассматривает движение цены как совокупность микро-трендов. Все микро-тренды анализируются и усредняются, и на основе этого усреднения делается фильтрация движения цены. IP_High и IP_Low (голубая и красная штриховые линии) отображают мгновенное движение цены. Они показывают прогноз только по текущим значениям цены, учитывая только то количество баров, определяемое параметром Filter level. SP_High и SP_Low (голубая и красная сплошные линии) сглаживают ценовые движения за счет учёта

Назначение Индикатор DG Trend+Signs окрашивает свечи по цвету тренда и четко показывает области консолидации, используя индикаторы DoGMA Trend и DoGMA Channel. Он разработан для помощи пользователям в торговле, отображения трендов, зон консолидации и обозначения точек входа и выхода. При определении пробоев индикатор также учитывает консолидации.
Основные особенности Разработан простым в использовании, имеет небольшое количество параметров НЕ перерисовывается НЕ пересчитывается Сигналы на вход

Allows multiple indicators to be combined into a single indicator, both visually and in terms of an alert. Indicators can include standard indicators, e.g. RSI, CCI, etc., and also Custom Indicators, even those purchased through Market, or where just have the ex4 file. An early alert is provided, say when 4 out 5 indicators have lined up, and a confirmed alert when all are in agreement. Also features a statistics panel reporting the success of the combined indicator by examining the current cha

Уровни Фибоначчи используются в трейдинге уже около 85 лет, с момента создания Волновой теории Эллиотта. До сих пор трейдеры используют анализ Фибоначчи для определения ценовых паттернов. Тем не менее, мы не смогли найти примеров использования анализ Фибоначчи для работы с волатильностью. Индикатор Harmonic Volatility стал первым техническим инструментом, использующим уровни Фибоначчи для анализа волатильности на рынке. Изначально индикатор Harmonic Volatility разрабатывался как способ преодолет

On-Balance Volume (OBV) – индикатор импульса, разработанный в 1963 году Джозефом Грэнвиллом. OBV показывает важность объема и его взаимосвязь с ценой. Он сравнивает положительные потоки объемов с ценой за определенный период времени. Чтобы подтвердить, что тренд может ослабевать, Грэнвилл рекомендует использовать 20-периодную скользящую среднюю в сочетании с OBV. В результате пользователям проще отслеживать такие события по пересечению линии OBV со своей скользящей средней. На Форексе у трейдера

Индикатор прогнозирует ближайшие бары графика на основе поиска до трех наиболее подходящих паттернов (последовательности баров заданной длины) в истории текущего инструмента текущего таймфрейма. Найденные паттерны совмещаются с текущим паттерном по цене открытия текущего (последнего) бара. Прогнозируемые бары - это бары, следующие сразу за паттернами, найденными в истории. Поиск паттерна осуществляется один раз в момент открытия каждого нового бара текущего таймфрейма. В течении формировани
StrongCurrency - полноценная торговая система, основанная на различных технических индикаторах, скользящих средних и точках разворота. Каждый из этих элементов можно оценить определенными правилами и коэффициентами (в зависимости от индикатора), что предоставляет безграничные сценарии оптимизации для StrongCurrency. После оценки этих данных, StrongCurrency создает список со значениями сил трендов и сигналов на вход по всем символам. Он экстраполирует информацию и рассчитывает силу или слабость т

i-Orders — простой индикатор для наблюдения за собственной торговлей или для анализа чьего-то счета. Пользуюсь им настолько давно, что не представляю, как выглядит график без этих стрелочек, линий и цифр с результатами торговли. Настройки позволяют: отключить отображение открытых или закрытых позиций ( Show OPENED , Show CLOSED , Show PENDING ), изменить цвета стрелочек и линий отдельно для прибыльных и убыточных бай и селл-позиций ( Color for profitable/ losing BUYs/SELLs ), изменить стиль и то

"Индикатор Squeeze пытается определить периоды консолидации на рынке. В целом рынок находится либо в периоде тихой консолидации, либо в вертикальном обнаружении цены. Выявляя эти спокойные периоды, мы имеем больше возможностей попасть в сделки с потенциалом для больших движений. После того, как рынок входит в состояние "сжатия", мы наблюдаем за общей динамикой рынка, чтобы получить помощь в прогнозировании направления рынка, и ожидаем высвобождения энергии рынка." Индикатор Modified TTM Squeeze

Индикатор-Конверт определяет наличие тренда или флэта, имеет 3 типа сигналов, показывает уровни возможной коррекции и уровни возможных целей. В расчётах индикатора используются коэффициенты Фибоначчи. Сигналы (образуются при касании линий или отбое от линий): Тренд - средняя линия конверта имеет ярко выраженный наклон; для сделок на покупку используются линии ниже средней линии канала и средняя линия, на продажу выше средней линии канала и средняя линия;
направление сделки должно совпадать с
Анализ самых сильных и самых слабых валют Продукт показывает силу основных форекс-валют на основе средней прибыли/убытка в пипсах на разных таймфреймах! В зависимости от силы валюты цвета индикатора меняются от синего до красного, также меняется их порядок, позволяя сразу найти самую сильную и слабую валюту.
В чем его преимущество? Независимо от вашей торговой стратегии всегда важно выбирать правильные пары. В этом поможет данный индикатор, который рассчитывает средний выигрыш/убыток в пипсах п

Индикатор сочетает разворотные паттерны "Двойное дно" и "Двойная вершина" с индикатором определения расхождения RSI.
Особенности С легкостью определяет сильные сигналы разворота. Позволяет использовать паттерны "Двойное дно" и "Двойная вершина" и сигналы расхождения RSI вместе или по отдельности. Получайте уведомления по электронной почте и/или на мобильное устройство при обнаружении сигнала. Можно использовать пользовательские цвета. Индикатор не перерисовывается. Можно использовать в составе

Уровни коррекции Фибоначчи представляют собой метод технического анализа для определения уровней поддержки и сопротивления. Индикатор TSO Fibonacci Chains отличается от стандартных уровней коррекции Фибоначчи тем, что для каждого уровня коррекции дополнительно доступны цели. Другими словами, для каждого уровня коррекции (С) доступен уровень расширения Фибоначчи (D). Индикатор сканирует график для определения точек максимального и минимального ценового уровня. Затем он начинает вычислять цепи Фиб

Простая, но эффектиная система для определения форекс-тренда. Представляет собой два индикатора в одном: Heiken Ashi и Heiken Ashi Smoothed Moving Average (сглаженная скользящая средняя). Heiken Ashi (HA) и Heiken Ashi Smoothed (HAS) рассчитываются в рамках одного события с необходимыми буферами и циклом, повышая скорость их работы, улучшая оптимизацию и эффективность . По вашему выбору на графике могут отображаться одновременно оба индикатра или только один.
Входные параметры Display Heiken As
Версия для MetaTrader 4 доступна здесь : https://www.mql5.com/ru/market/product/24881 FFx Basket Scanner ищет до пяти индикаторов среди 16 доступных на всех парах и таймфреймах. Таким образом вы можете ясно увидеть торговли по каким валютам следует избегать, а на каких сосредоточить внимание.
Когда валюта переходит в экстремальную зону (например, 20/80%), вы можете торговать всей корзиной с большей уверенностью. Другая область применения индикатора – определение сильных и слабых валют для поиск

PowerSignal - полноценная торговая система, основанная на техническом индикаторе ATR. Этот индикатор будет записывать текущее состояние каждого POWERTREND на каждом анализируемом таймфрейме и валютной паре. После оценки этих данных, PowerSignal создает список со значениями сил трендов и сигналов на вход. Если на какой-либо паре появляется полное совпадение, появится оповещение, указывающее на такой случай. В списке отображаются значения символа, таймфреймов с M5 по MN1, BuyPercent, SellPercent,

Индикатор индекса относительной силы Gekko — это модифицированная версия знаменитого индикатора RSI. Индикатор сочетает стандартный индикатор RSI с различными расчетами сигналов входа и оповещением о потенциальных точках входа и выхода.
Входные параметры Period: период расчета RSI; Метод расчета сигнала входа (свинга): 1 - Генерирует сигналы на выход для свинг-торговли на основе входа и выхода значения RSI из верхней и нижней зоны; 2 - Генерирует сигналы на вход/выход для свинг-торговли на осно

Этот индикатор реализует процесс простого линейного сглаживания. Одним из недостатков экспоненциального сглаживания является быстрое затухание сигнала. Это не дает возможности полноценно отслеживать долговременные тенденции ценового ряда. Линейное сглаживание позволяет более точно и тонко настроить фильтрацию сигнала. Индикатор настраивается с помощью подбора параметров: LP - этот параметр позволяет выбрать период сглаживания. Чем больше его значение, тем более долговременные тенденции отображае

Индикатор среднего направленного индекса Gekko — это модифицированная версия знаменитого индикатора ADX. Индикатор сочетает стандартный индикатор ADX с различными расчетами сигналов входа и оповещением о потенциальных точках входа и выхода.
Входные параметры Period: период расчета ADX; PlotSignalType: метод расчета сигнала входа (свинг): 1- ShowSwingsOnTrendLevel : показывает сигналы с подтверждением тренда; 2- ShowSwingsOnTrendLevelDirection: показывает сигналы с подтверждением тренда и направ

Индикатор показывает и выделяет на графике свечи, которые формируются в результате того, что в рынок входят крупные игроки большими объемами. Или такие свечи могут формироваться при наступлении определенности на рынке, когда большинство игроков занимают позиции в одну сторону. После таких свечей движение в эту сторону может продолжиться. Индикатор выделяет значимые свечи из существующих на графике; По индикатору можно отслеживать тренды на основании свечей, в которых усиливаются позиции в сторон
Тип: трендовый Индикатор Parabolic SAR Gekko — это модифицированная версия знаменитого индикатора Parabolic SAR. Индикатор сочетает стандартный индикатор SAR с различными способами оповещения о потенциальной точке входа или выхода.
Входные параметры Step: шаг коэффициента ускорения (Acceleration Factor, AF), по умолчанию 0.02. Каждый раз, когда точка экстремума формирует новый минимум или максимум, коэффициент увеличивается на 0.02. AF может достигать значения, не превышающего значение параметр
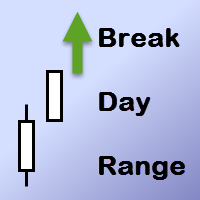
Сигнальный индикатор. Реализует тактику, описанную в книге Ларри Вильямса "Долгосрочные секреты краткосрочной торговли", глава 4 "Прорывы волатильности - прорыв моментума". Индикатор отражает на графике точки открытия позиции в виде стрелок. Входные параметры не используются.
Пример использования в действующей торговой системе Используется на реальном счете в составе портфеля стратегий на фьючерсе GMKN. Адрес в сигналах https://www.mql5.com/ru/signals/204344 . Скриншоты созданы по данным указан

Индикатор "Predicting Donchian Channel MT5" позволяет спрогнозировать изменение уровней канала Дончиана в будущем исходя из текущего положения цены. Стандартный индикатор Зиг-Заг начинает рисовать свой луч в 99% при касании противоположного канала Дончиана. Прогноз уровней границ канала поможет найти точки окончания коррекции или точки смены тенденции, оценить, как скоро могут произойти эти события.
Настройки Period - период расчета канала Дончиана. Рекомендуемые значения от 12 до 240.

Exclusive Bollinger - это профессиональный индикатор на базе известного индикатора Bollinger Bands , но с более продвинутым алгоритмом. В отличие от стандартного Bollinger , мой Exclusive Bollinger дает более качественные сигналы и оснащен гибкими настройками, что позволяет трейдерам подстроить этот индикатор под свой стиль торговли. В индикаторе есть возможность настроить уведомления (алерт, почта, телефон), что поможет вам не пропустить торговый сигнал.
Преимущества индикатора Индикатор прекр

Индикатор определяет наиболее подходящий момент для входа с точки зрения волатильности на рынке, когда рынок имеет силу для движения (сигнал указывается стрелкой под свечой). Для каждого из сигналов определяется наличие трендов на текущем и старших графиках, чтобы сигнал был в сторону большинства открытых позиций на рынке (подписывается на мониторе возле сигнала аббревиатурами временных периодов, на которых есть тренд). Сигнал появляется после закрытия свечи. Для установки ордера Take-Profit или

Этот индикатор находит клинья , которые представляют собой паттерны продолжения, которые определяются сходящимися линиями тренда, окружающими период консолидации цен. Он сигнализирует о сделках, используя прорыв дончиана вместе с прорывом пласта. [ Руководство по установке | Руководство по обновлению | Устранение неполадок | FAQ | Все продукты ] Легко использовать Настраиваемые цвета и размеры Реализует сигналы прорыва Он реализует оповещения всех видов
Оптимальное использование Чтобы увидеть

Currency Index Watcher - это простой инструмент для тех, кто хочет торговать на рынке Форекс, используя индексы валют . После завершения расчетов показываются конкретные торговые возможности , и подаются сигналы по ним. Currency Index Watcher можно настроить непосредственно с панели управления : Индексы 8 валют: EUR, USD, GBP, JPY, CHF, AUD, CAD, NZD с возможностью выбирать для анализа индексы и синтетические пары. Выбор возможностей осуществляется в соответствии со следующими критериями: Minima

Alpha Trend MT5 - это трендовый индикатор для платформы MT5, разработанный группой профессиональных трейдеров. Индикатор Alpha Trend MT5 находит наиболее вероятные точки разворота тенденции, что позволяет совершать сделки в самом начале тренда. Данный индикатор оснащён уведомлениями при появлении нового сигнала (алерт, почта, телефон), что поможет вам своевременно открыть позицию. Alpha Trend не перерисовывается, что дает возможность оценить его эффектность на истории. Версия Alpha Trend дл

Комплексный инструмент для определения уровней поддержки, сопротивления, разворотов в привязке к торговым сессиям. Тезис индикатора может быть выражен так: «Уровни поддержки и сопротивления, несомненно, сформированы психологическими барьерами участников рынка и оказывают влияние на дальнейшее поведение цены. Но эти барьеры различны у разных групп трейдеров и могут быть сгруппированы по территориальному признаку или по времени проведения торгов». Следуя тезису, индикатор обнаруживает уровни и обр

Если вы торгуете по заранее расставленным уровням, таким как: горизонтальные уровни, трендовые линии и каналы, то этот индикатор поможет вам. Вам не придется целый день смотреть на график. Просто нарисуйте все уровни, каналы, линии, которые вам нужны, и когда цена будет подходить к ним, индикатор сообщит вам об этом (путем звукового сигнала или push-уведомления через телефонный MetaTrader). Есть возможность уведомлять только об определенных уровнях. Индикатор очень прост в использовании. У него

Monster Harmonics Indicator is a harmonic pattern indicator. It recognizes Gartley, Bat, Crab, Butterfly, Cypher, White Swan, Black Swan, Shark and AB=CD patterns. Projected patterns that are not yet completed are recognized, too. Monster even shows the PRZ (Potential Reversal Zone). Users can add their own user defined patterns to Monster. Besides the current pattern, Monster also shows all patterns in the symbols history. Monster will provide alerts for developing patterns. Introduced by H.M.

Call/Put Ratio является одним из самых известных индикаторов настроения толпы (сантимента). Индикатор был разработан Мартином Цвейгом, и его работа основывается на учете реальных объемов опционного рынка CBOE. Известно, что опцион Call дает право владельцу купить базовый актив по заранее фиксированной цене. Опцион Put, напротив, дает право его продать. Таким образом, увеличение объемов по Call-опционам указывает, что спрос на товар начинает увеличиваться. Когда растет объем Put-опционов, предлож

Версия для MetaTrader 4 доступна здесь: https://www.mql5.com/ru/market/product/25793 FFx Pivot SR Suite PRO - это полный набор инструментов для построения уровней поддержки и сопротивления. Поддержка и сопротивление - самые используемые уровни во всех видах торговли. Их можно использовать для поиска разворотов тренда, установки уровней тейк-профита и стоп-лосса и т.д.
Индикатор можно полностью настроить непосредственно с графика Выбор из 4 периодов для расчетов: 4-часовой, дневной, недельный и

Индикатор сочетает разворотные паттерны "Двойное дно" и "Двойная вершина" с индикатором определения расхождения между графиком цены и осциллятором MACD.
Особенности С легкостью определяет сильные сигналы разворота Позволяет использовать паттерны "Двойное дно" и "Двойная вершина" и сигналы расхождения MACD вместе или по отдельности Получайте уведомления по электронной почте и/или на мобильное устройство при обнаружении сигнала Можно использовать пользовательские цвета Индикатор не перерисовывает

Для любого трейдера результатом анализа рынка является правильное определение точек входа и выхода из рынка. Насколько правильно они будут выбраны, настолько прибыльной будет торговля. Индикатор SmartArrows не выводит никакой лишней информации, которая может отвлекать или вводить в заблуждение трейдера, а только самое главное. Индикатор очень прост в применении, при появлении стрелочки вниз, нужно открывать сделку SELL, при появлении стрелки вверх необходимо открывать сделку BUY. Индикатор Smart

Обязательный инструмент для любой стратегии, основанной на обнаружении дивергенций. 10 различных осцилляторов можно использовать для нахождения дивергенций, а также сочетать их с паттернами "Двойное дно" и "Двойная вершина" для подтверждения сигналов на разворот. СКАНЕР включен. Теперь со Scanner вы можете легко и быстро находить торговые возможности и настройки.
Особенности С легкостью определяет сильные сигналы разворота Для обнаружения дивергенций доступны 10 различных осцилляторов Обнаружен
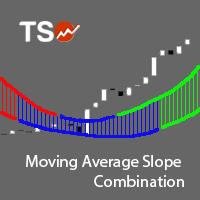
Индикатор Moving Average Slope (MAS) вычисляется путем сравнения значения скользящей средней n периодов назад с ее текущим значением. Это позволяет отображать тренд скользящей средней на линии скользящей средней. Этот индикатор позволяет сравнить наклоны двух скользящих средних (быстрой и медленной) для уменьшения шума и формирования более качественных сигналов на вход и выход.
Особенности Позволяет одним взглядом определить растущий и падающий тренд. Поддерживает множество методов расчета скол
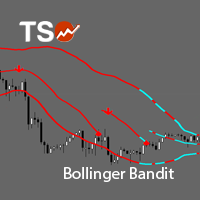
Индикатор TSO Bollinger Bandit Strategy основан на торговой стратегии Bollinger Bandit, описанной в книге Дж. Прюитта и Дж. Р. Хилла Построение выигрышных торговых систем с TradeStation .
Особенности Полноценная стратегия с входами и выходами для трендового рынка. При появлении сигнала на вход отправляет уведомления по email/push-уведомления. Индикатор не перерисовывается. Можно использовать в составе советника (смотрите раздел Для разработчиков )
Условия входа Стратегия использует полосы Болл

Индикатор отображает на графике ключевые уровни поддержки и сопротивления. Важность уровней заключается в том, что при их прохождении цена может развернуться или усилить движение; так как уровни формируются в следствии естественной реакции участников рынка на движение цены, в зависимости от того, какие позиции они заняли или не успели занять. Психология возникновения уровней: всегда есть те, кто купил, продал, не решился войти или рано вышел. Если цена отбивается от уровня поддержки и идёт вверх

Индикатор "Gap on chart" позволит увидеть ценовые разрывы на графике. Уровни разрывов протягиваются во времени до тех пор, пока цена не перекроет ценовой разрыв. Индикатор позволяет настраивать чувствительность - какой размер разрыва в пунктах показывать и какую глубину истории анализировать. Для использования в автоматической торговле используется нумерация ценовых разрывов по методу ЛИФО, т.е. последний образовавшийся ценовой разрыв имеет номер 1.
Настройки InpBars - указывается количество ба

Анализирует активность рынка, измеряя частоту поступающих тиков. Бычьи и медвежьи тики анализируются раздельно, информируя о превалирующем в текущий момент настроении на рынке. По наблюдениям, увеличение частоты тиков (паника) свидетельствует о начале сильных изменений цены, а увеличение частоты тиков в конкретном направлении не только сопровождает изменение цены в данном направлении, но и зачастую предвосхищает его. Индикатор незаменим при скальпинге.
Отличительные особенности Бóльшая чувствит

Индикатор является мультитаймфреймовой торговой стратегией, имеет уровни стоп-лосса, тейк-профита и точку входа. Так же уровни ордеров могут быть выбраны самостоятельно. Индикатор использует закономерность рынка, проявляющуюся на всех инструментах, и не требует подстройки параметров. В стратегии используется авторский подход к определению: тренда, волатильности, иерархии важности временных периодов, размера периода истории (количество свечей), который важен для принятия торгового решения. Индика

Профиль Рынка (Market Profile) помогает трейдеру распознать поведение крупных игроков на рынке и обозначить зоны их интересов. Ключевая особенность - это отображение в понятном графическом формате диапазона ценового действия, в котором произошло 70% торговли. Понимание расположения области накопления объема может помочь трейдерам увеличить вероятность на успех. При этом данный инструмент может служить как самостоятельной системой, так и использоваться в сочетании с другими индикаторами и система
Индикатор отображает тренд 3-х временных периодов: старший временной период; средний временной период; младший (текущий) временной период, на котором запущен индикатор. Индикатор нужно запускать на графике меньшем, чем средний и старший временной период. Идея заключается в том, чтобы использовать силу тренда при открытии позиций, благодаря объединению 3 временных периодов (младший, средний, старший) достигается следование тренду на всех уровнях инструмента. Для расчетов используются старшие врем
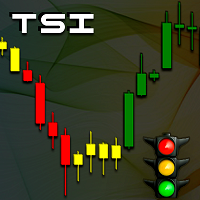
Трендовый семафорный индикатор TSI
Рабочий инструмент для отображения силы движения. Этот инструмент был разработан для трендследящих стратегий. Рекомендуется для любого стиля торговли. Может использоваться на любом инструменте и рынке. Работает на любом таймфрейме. Обозначение тренда при помощи разноцветных свечей.
Новый тренд Сигнал о новом тренде подается путем изменения цвета свечей на графике. Индикатор показывает восходящие тренды зеленым цветом, а нисходящие - красным. Слабые движения,

Einstein Pivot Point indicator shows you hourly, weekly or monthly pivot points and support and resistance levels. You can choose 3 different formula for the support and resistance levels (Classic Formula, Woodie Pivot Points and Fibonacci Pivot Points). Einstein Pivot Point will automatically calculate the p ivot point and support and resistance levels on the basis of market data.
Trading requires reference points (support and resistance), which are used to determine when to enter the

Индикатор отображает несколько индикаторов по нескольким таймфреймам и символам, чтобы дать исчерпывающий обзор рынка. Уникальной особенностью является настройка индикаторов и работа с пользовательскими индикаторами, даже в формате ex4 или купленными в Маркете. Доступен выбор стандартных индикаторов. По умолчанию указаны: ADX, CCI, рыночная цена выше/ниже Moving Average (MA), Moving Average Cross (MAX), MACD, Momentum (MOM), OsMA, RSI, Parabolic SAR, William's Percentage Range (WPR). Нажмите кно

Индикатор BuySellArrows не имеет входных параметров, что делает его простым в использовании как для новичков, так и для продвинутых и профессиональных трейдеров. Его основная цель – обнаружение и обозначение стрелками локального тренда. Это важнейшая задача трейдера независимо от стиля торговли. Алгоритм индикатора включает в себя расчет скорости и направления изменения цены. Индикатор отображает стрелки на покупку (голубого цвета) и продажу (пурпурного цвета), когда ожидается соответствующий тр
Индикатор вычисляет и рисует линии на графике. Существует два типа каналов: Канал A: основная линия отрисовывается по локальным минимумам для восходящих трендов и по локальным максимумам - для нисходящих. Канал Б: основная линия отрисовывается по локальным максимумам для восходящих трендов и по локальным минимумам — для нисходящих. Параллельные линии обоих типов строятся с использованием максимального фрактала между базовыми точками основной линии. Нужно, чтобы ситуация полностью удовлетворяла н

При пользовании осциллятором CCI (Commodity Channel Index) , в зависимости от таймфрейма, ожидание следующего сигнала может занимать достаточно большое время. Поэтому чтобы не пропустить следующий нужный вам сигнал данного индикатора, и создан индикатор CCI Alerts. Это дополнение или, скорее, замена стандартного индикатора CCI . Теперь, как только появится сигнал индикатора CCI на нужном вам уровне, - индикатор вас оповестит звуковым сообщением или push-уведомлением на мобильное устройство и вы

Все трейдеры сталкиваются с серьезным вопросом: Как оценить эффективность торговой стратегии и контролировать риск в режиме реального времени? Несмотря на тестирование на истории и оптимизацию в тесте стратегии трейдеру приходится иметь дело с так называемой подгонкой, потому что оптимизированный результат основан только на определенном наборе имеющихся исторических данных. Этот индикатор собирает информацию о сделках на исторических данных, затем строит кривые баланса и эквити, а также рассчиты

Индикатор Bollinger R (Bollinger Reversals) предназначен для определения на графике прибыльных краткосрочных противотрендовых паттернов. Эта система сочетает в себе полосы Боллинджера и возврат к среднему значению для определения точек, в направлении которых потенциально может развернуться рынок. Это версия индикатора Bollinger R для MetaTrader 5.
Описание Полосы Боллинджера хорошо известны в торговом сообществе. Основной принцип торговли по полосам Боллинджера заключается в том, чтобы продават
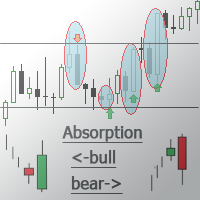
Индикатор находит свечной паттерн "Поглощение" и рисует соответствующий сигнал для входа рынок.
Особенности Работает для всех валютных пар и любых таймфреймов. Индикатор рассматривает комбинацию из 2-х или 3-х свечей в зависимости от настроек. Большое количество заранее просчитанных баров на истории (сигналов). Есть возможность получать уведомление о найденном сигнале. Имеется возможность фильтровать сигналы путем настройки количества свечей одного цвета (тренда) до образования паттерна. Присут
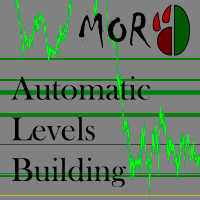
Индикатор предназначен для автоматического построения уровней поддержки\сопротивления. Индикатор рассчитывает плотность распределения цены в указанном временном диапазоне и создает таблицу объемов по каждой цене. Уровни строятся от минимального до максимального объемов, указанных пользователем. Некоторые входные параметры можно изменять с помощью горячих клавиш, не открывая окно настроек.
Входные параметры StartPoint - номер начального бара Range - длина уровня в барах (временной диапазон) Volu
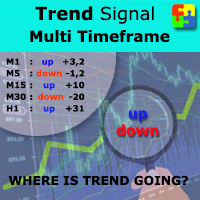
Вы хотите всегда знать, куда пойдет цена, всего лишь взглянув на нее? Вы устали постоянно переключаться между таймфреймами, чтобы понять это направление? Возможно, этот индикатор - как раз то, что вы искали. Trend Signal Multitimeframe показывает то, является ли текущая цена выше или ниже цены N свечей назад на разных таймфреймах. Он всегда отображает количество пипсов, на которое текущая цена выше или ниже цены N свечей назад. Число N можно настроить Данные отображаются в окне, которое можно пе
EFW Analytics исходит из принципа "Мы торгуем, потому что на финансовом рынке есть закономерности". EFW Analytics - набор инструментов для повышения эффективности торговли путем обнаружения повторяющихся фрактальных геометрических паттернов на финансовом рынке (пятая закономерность). EFW Analytics - один из нескольких инструментов, поддерживающих торговую логику без необходимости тестирования на истории. Инструмент состоит из трех частей: Equilibrium Fractal Wave Index - индекс равновесной фракт

Индикатор «TickDelta» показывает разницу в количестве колебаний лучших цен за единицу времени. Единицей времени в данном случае будет установленный таймфрейм (М1, М2, М5, М15 и т.д.). Этот показатель косвенно говорит нам о «настроении» рынка. Индикатор ввиду его «тиковой» природы целесообразнее будет применить для скальперских стратегий. Применяя совместно с реальными объемами и наблюдая за графиком на разных инструментах, можно выделить некоторые разворотные сетапы. Возможно, в некоторых случая
Тип: осциллятор Модификация известного индикатора вершин и впадин Gekko. Находите важные вершины и впадины на графике любого символа или таймфрейма на основе набора конфигураций, которые подстраивают индикатор к торгуемому инструменту.
Входные параметры Calculate Tops and Bottoms for the past X Bars: количество баров, для которых индикатор будет строить вершины и впадины. Чем меньше значение, тем быстрее скорость работы. At Least Two Bars Making New Highs or Lows to Confirm: true - учитывать но

Этот мульти-таймфрейм и мультисимвольный индикатор идентифицирует паттерны прорыва с высокой вероятностью. Для этого он определяет сильные симметричные вымпелы и треугольники. Этот образец НЕ появляется очень часто на старших таймфреймах. Но когда это происходит, это очень высокая вероятность. Индикатор также включает в себя сканер внутренних баров. Например, его можно использовать для обнаружения особого типа формирования внутренних баров, которые формируются из основной свечи (MC), за

Этот мульти-таймфрейм и мультисимвольный индикатор может определять следующие 5 крестов: когда быстрая скользящая средняя пересекает линию медленной скользящей средней. когда цена достигла единственной скользящей средней (закрылась выше / ниже или просто отскочила). когда образовалась тройная скользящая средняя (все 3 MA: с последовательным выравниванием) когда основная линия MACD пересекает сигнальную линию. когда сигнальная линия пересекает нулевую (0) линию MACD. В сочетании с вашими собствен

Версия 2.0 2018.10.20 1. Добавлен расчет коэффициента ранговой корреляции Спирмена.
2. При наведении курсора на показатель таблицы появляется всплывающая подсказка (Расхождение RSI, направление сделок, информация о свопе). Table of currency pairs - разработана в помощь трейдеру торгующему на рынке Форекс по методу основанному на корреляционной зависимости валютных пар. Корреляционная зависимость между двумя инструментами рассчитывается через коэффициент К. Пирсона. Основная функция таблицы - в
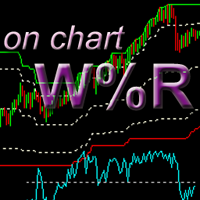
Это модификация индикатора Процентный Диапазон Вильямса ( Williams' Percent Range ), которая строит верхний / нижний / средний диапазон и уровни перекупленности / перепроданности непосредственно на графике, где цена закрытия последней свечи соответствует значению %R. Преимущество такого представления в том, что становится возможным точно увидеть достижение ценой экстремумов (уровни 0 и -100), а также текущую цену в отношении состояний перекупленности/перепроданности. Кроме того, этот индикатор п

Индикатор Gekko Strong Bars генерирует сигналы при обнаружении сильного бычьего или медвежьего бара. При поиске применяются три условия: 1 - текущий бар выше/ниже последних x баров (x - входной параметр), 2 - размер текущего бара выше среднего размера последних x баров (x - входной параметр) и 3 - у текущего бара короткий хвост (тень).
Входные параметры Plot Strong Bar Arrows for the past X Historical Bars: число предыдущих баров для отрисовки индикатора. Чем ниже значение, тем выше быстродейст
MetaTrader Маркет - единственный магазин, где можно скачать демоверсию торгового робота и подвергнуть его проверке и даже оптимизации на исторических данных.
Прочитайте описание и отзывы других покупателей на заинтересовавший вас продукт, скачайте его прямо в терминал и узнайте, как протестировать торгового робота перед покупкой. Только у нас вы можете получить представление о программе, не заплатив за неё.
Вы упускаете торговые возможности:
- Бесплатные приложения для трейдинга
- 8 000+ сигналов для копирования
- Экономические новости для анализа финансовых рынков
Регистрация
Вход
Если у вас нет учетной записи, зарегистрируйтесь
Для авторизации и пользования сайтом MQL5.com необходимо разрешить использование файлов Сookie.
Пожалуйста, включите в вашем браузере данную настройку, иначе вы не сможете авторизоваться.