Смотри обучающее видео по маркету на YouTube
Как купить торгового робота или индикатор
Запусти робота на
виртуальном хостинге
виртуальном хостинге
Протестируй индикатор/робота перед покупкой
Хочешь зарабатывать в Маркете?
Как подать продукт, чтобы его покупали
Технические индикаторы для MetaTrader 5 - 28

Smart Trend pro New - Advanced Trend Indicator with Interactive GUI Professional trend-following indicator with comprehensive visualization and control panel Key Features: Advanced Trend Detection Reliable Half Trend algorithm for precise trend identification Color-coded trend lines (Blue for bullish, Orange for bearish) Customizable amplitude parameter for different trading styles Interactive GUI Panel Real-time market strength visualization (Bulls vs Bears) Current signal display (Buy/Se
FREE

True TrendLines MT5 - Smart Trend Detection & Alerts Overview True TrendLines MT5 is a professional-grade technical analysis tool that automatically identifies and plots high-probability trend lines on your MetaTrader 5 charts. Using a sophisticated swing point detection algorithm, it helps traders visualize key market structure and potential reversal points with precision. Key Features Automatic Trend Line Detection Identifies valid swing highs and lows based on your chosen strength paramet
FREE

The Supertrend indicator is a very versatile and and accurate trend detection system. It can also be used an an reversal indicator. Therefor you can use it either as entry or as an exit signal. Depending on your settings it is also good for trend confirmation. This version is slightly enhanced from the original version from mladen. The Supertrend of Averages Histogram Version contains: 11 different price options Averaging period
18 different averaging types ATR period and ATR multiplier Shows re
FREE

This is a usefull utility for monitoring spread and also for recording informations to a file. (Files will be placed into "Common\Files\Spread Monitor"). There is the possibility to let the indicator calculate high/low into the past thanks to downloading ticks. (It's a slow and approsimate thing! The best way to use it is to attach to a chart and let it recording spread in real time). There is also a buffer with the average of spread in latest X periods.
Easy and effective.
FREE

The Fisher Transform is a technical indicator created by John F. Ehlers that converts prices into a Gaussian normal distribution. The indicator highlights when prices have moved to an extreme, based on recent prices. This may help in spotting turning points in the price of an asset. It also helps show the trend and isolate the price waves within a trend. The Fisher Transform is a technical indicator that normalizes asset prices, thus making turning points in price clearer. Takeaways Turning poi
FREE

Magic Trend
This MT5 indicator is a Moving Average with 3 signal colors. The 3 input parameters on this Indicator give you a chance to set any Moving Average of choice. A combination of 2 different exponential moving averages, relative strength index, commodity channel index, and William's percent range provide the signals.
White color = Null/No/Exit Signal Green color = Buy Signal Red color = Sell Signal
Point To Note: Confirm the color change only after the current candle closes to avoid
FREE

Индикатор VeMAs — это инновационный торговый инструмент, предназначенный для улучшения вашей торговой стратегии за счёт анализа динамики объёма и рыночной структуры. Независимо от того, новичок вы или опытный трейдер, VeMAs дает вам преимущество. Индикатор VeMAs доступен всего за 50 $. Первоначальная цена индикатора 299 $ ПРЕДЛОЖЕНИЕ ОГРАНИЧЕННОЕ ПО ВРЕМЕНИ. Свяжитесь со мной после покупки для получения персонального бонуса! Вы можете получить абсолютно бесплатно крутую утилиту (VeMAs Utility MT
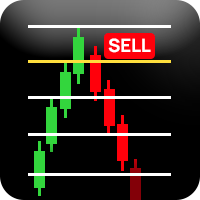
️ ВАЖНО: ОЦЕНОЧНАЯ ВЕРСИЯ - ОГРАНИЧЕННАЯ ПОДДЕРЖКА СИМВОЛОВ Данный индикатор доступен только для ОЦЕНКИ и поддерживает только: EURUSD Volatility 50 (1s) Index Индикатор не будет работать на других торговых символах. Индикатор Richchild Quarters Theory ОЦЕНКА Профессиональный инструмент анализа рыночной структуры Обзор Это профессиональный торговый индикатор, предназначенный для анализа рыночной структуры с использованием динамических расчетов диапазонов и анализа на основе четвертей. Индика
FREE

Have you ever wondered which currency is the strongest at any particular time? Or which currency pair is trending the most. Well, the currency strength meter helps with just that. It compares USD , EUR , AUD , CHF , GBP , CAD and NZD depending on the timeline you have chosen in settings, and ranks them on the number of pips each has moved compared to the rest. N/B: All currency charts of the above pairs must have loaded. You can do this by highlighting all major and minor currencies in
FREE

Indicador com regra de coloração para estratégias que utilizam Inside Bar! Quando rompe a barra inside, se for para cima, compra e posiciona o stop loss na mínima da barra inside. Se romper para baixo, vende e posiciona o stop loss na máxima da barra inside. Pode ser aliada a tendências de outros tempos gráficos e outros filtros.
Grupo de sinais gratuito no telegram: https://t.me/InsideBarRST
FREE

Мультитаймфреймовый индикатор Pivot Points уровней. Каждый закрытый дневной период имеет свою так называемую опорную точку - Pivot Point, которая задает уровень для более мелких, внутридневных таймфреймов следующего дня. Существующие в базе кодов индикаторы Pivot Points не имеют возможности показать динамику изменения опорных уровней на исторических данных графика цены. Формула расчета Pivot Point. Pivot=(High + Low + Close) /3 High — максимум вчерашнего дня; Low — минимум вчерашнего дня; Close
FREE

Trendy Stock is a price following indicator that uses Stochastic to show when the price is out of the oversold or overbought areas. The algorithm allows you to stay longer in a trend where the bulls or bears are in control. The indicator changes color immediately the price exits oversold/overbought state. In short, the downtrend [red] bars start to paint when the buying pressure decreases while the uptrend [green] bars form as the buy pressure kicks in. For MT4 version, follow :: https://www
FREE

Keltner Channels Enhanced - Professional Indicator with Alerts
Full Description:
Keltner Channels Enhanced is a professional-grade technical indicator that brings the classic Keltner Channels to a new level with advanced features and complete customization.
KEY FEATURES
Advanced Calculation Exponential Moving Average (EMA) based middle line. Average True Range (ATR) for dynamic channel width. Customizable price type (Close, Open, High, Low, Median, Typical, Weighted). Horizontal shift o
FREE

**“Multi Trendline Channel With Regression Bands” – Каналы линейной регрессии + полосы стандартного отклонения (MT5)**
Этот индикатор автоматически строит многопериодные каналы линейной регрессии вместе с полосами стандартного отклонения, обеспечивая трейдерам мгновенную ясность относительно направления тренда, ценового разброса и ключевых зон поддержки/сопротивления. Преобразуя сложный анализ в простую и интуитивную визуализацию, он даёт дискреционным трейдерам чёткое понимание рыночного ко
FREE

This indicator identifies and highlights market inefficiencies, known as Fair Value Gaps (FVG), on price charts. Using a custom algorithm, the indicator detects these areas of imbalance where the price moves sharply, creating potential trading opportunities. Indicator Parameters: Bullish FVG Color (clrBlue) : Color used to highlight bullish inefficiencies. The default value is blue. Bearish FVG Color (clrRed) : Color used to highlight bearish inefficiencies. The default value is red. Bullish FVG
FREE
Eight indicator for 3 day/session/week setups. Check out our other products for fxer.net:
https://www.mql5.com/en/market/product/114888
https://www.mql5.com/en/market/product/114890
Indicator daily features: Daily close/high/low Weekly open/high/low/close Tokyo/London/New York sessions Alerts Signals and alerts for First Green days First Red days Inside days Outside days 3x days of breakout up 3x days of breakouts down Do not be stupid and take every signal. Learn 3day setups first.
FREE

My other indicators https://www.mql5.com/en/market/product/156702 https://www.mql5.com/en/market/product/153968 (FREE) https://www.mql5.com/en/market/product/153960 (FREE)
MyFXRoom Vortex – Equal Highs & Lows Detector Recommended Settings Bars Between Touches: 6 Level Tolerance: 10
(A balanced starting point for most pairs/timeframes — adjust to match volatility and how you define “equal highs/lows.”) What it does
MyFXRoom Vortex automatically detects, validates, and draws Equal Highs and E
FREE

This Indicator represents the standard Heikin Ashi Candle converter from normal candles. They are applied on a different chart, so you can identify easily both prices. You can also change candles to your favourite colours. If you want to, you can use this indicator into an iCostum, so you can apply other indicators over this on, because there are excellent indicators combined with this type of candles
FREE
ZigZag Reversal Detector Signals This is a technical indicator based on the ZigZag principle, designed to automatically detect market reversal points and generate clear buy and sell signals. Customizable Parameters ️: Level : Determines the sensitivity of the ZigZag to price changes. Ecart : Sets the minimum distance between two ZigZag points. Rebond : Adjusts the confirmation threshold for a reversal. Alerts & Notifications : Enable or disable according to your needs. Pe
FREE

Spike Phantom is a specialized indicator for PainX and GainX synthetic indices that generates trading signals with automatic alert notifications.
Features The indicator analyzes market conditions using proprietary algorithms and displays buy/sell arrows directly on the chart. It works specifically with PainX and GainX indices on M5 timeframe. Signal generation combines multiple technical analysis methods to identify potential trading opportunities. The system provides two TP levels and SL cal

Разблокируйте потенциал вашего трейдинга с индикатором AlphaWave! Принесите спокойствие в ваш трейдинг: Индикатор AlphaWave разработан для придания спокойствия вашему трейдингу, сглаживая график и обеспечивая точность определения направления тренда. Принятие четких торговых решений стало легче прежде. Революционная технология сглаживания с 10 режимами: Опыт гладкой и четкой демонстрации графика с индикатором AlphaWave. Революционная технология сглаживания предлагает не один, а целых 10 режимов,

Ukeita Spike detector for All Gain and Pain Indices
Ukeita Spike Detector is a trend-sensitive indicator specially designed for Gain and Pain Indices
Gain and Pain synthetic indices are available 24/7 on Weltrade , similar to synthetic indices (Boom and Crash) offered by Deriv Broker .
This powerful tool helps detect incoming spike for Gain and Pain indices with high accuracy, making it a great addition to any strategy aimed at trading spikes safely.
Features
1) Detects incoming spikes f

Полезный и удобный инструмент для трейдеров при анализе рынка и принятии решения.
Особенность
Главная особенность данного индикатора - это быстрый алгоритм . Выигрыш скорости расчета полинома и его значения среднеквадратического отклонения в сравнении с классическими алгоритмами достигает несколько тысяч раз. Также в данный индикатор внедрен Тестер стратегий с наглядной визуализацией сделок, графиком эквити и одновременным подсчетом и выводом в виде таблицы следующих данных: прибыль (в п

The Color Candles Indicator uses custom colors to highlight candles that follow the main market trend, based on the Moving Average. This simplifies the analysis of price movements, making it clearer and more direct. When the price is above the rising Moving Average, candles are highlighted indicating a BUY opportunity. When the price is below the declining Moving Average, candles are highlighted indicating a SELL opportunity.
Input Parameters : Period Method Applied Price
The moving averages
FREE

Based on Brazilian trader André Moraes' Difusor de Fluxo theory, the indicator is a more reliable version of the original MACD. It is a great confirmation indicator for Swing Trading and also can be used as a Day Trading tool. If you are not familiar with the concept or André's trading strategies, I strongly recommend his excelent book named "Se Afastando da Manada" in which he explains in detail how this indicator is used. Even if you don't know the Portuguese language it is not difficult to un
FREE
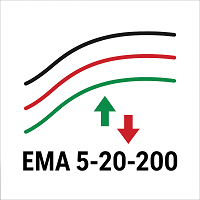
Description (English) EMA 5-20-200 Cross Alerts (Fixed Alerts, No Repaint) This indicator combines three popular EMAs (5, 20, and 200) to help traders identify short-term, mid-term, and long-term trends.
With visual arrows on the chart and automatic alerts (popup & push notification) , it allows traders to catch entries and trend confirmations without constantly monitoring the screen. Key Features: Plots EMA 5, EMA 20, and EMA 200 directly on the chart. Generates Buy/Sell signals (EMA5 vs
FREE

The TrendOscillator Indicator is an upgraded version of the traditional Stochastic Oscillator. It comprises two lines: %K and %D. The %K line represents the current market position. In contrast, the %D line is a moving average of the %K line used to generate signals and identify potential entry or exit points. The good thing is the indicator works on all timeframes like the traditional Stochastic. However, to avoid any false signals, applying the indicator on longer timeframes is better
FREE

За основу идеи алгоритма и отображения взят индикатор Currency Power Meter, отличия данной версии в снятии ограничений на количество отображаемых валют, код более компактный и быстрый, есть возможность получения значений для текущего бара через буферы индикатора. Что показывает индикатор : тонкая полоса и верхнее число напротив валюты показывает индекс относительной силы за последние N часов (N задаётся переменной Hours в параметрах), более широкая полоса показывает дневной индекс. Чем больше ва
FREE

Description Overview : Session Sentinel Pro is a lightweight, chart-based indicator that watches your account equity live and presents a clear view of daily trading performance. It provides closed and floating P&L, session and per-day maximum drawdown, symbol-level breakdowns, and automatically persists daily summaries to the MT5 Files folder so you can review recent performance across days.
Why it helps : The indicator helps traders stay disciplined by clearly showing intraday performance, max
FREE

Are you tired of trading without a clear direction ? Do market fluctuations and noise leave you feeling overwhelmed ?
Here is the solution you've been searching for! Imagine an indicator that simplifies trading, cuts through market noise, and provides crystal-clear signals. The Heiken Ashi OHLC Indicator does just that!
What does the Heiken Ashi OHLC Indicator do? It transforms traditional candlestick charts into a trader's dream. Instead of dealing with erratic price movements, you'll witn
FREE
The Smart Trend Tracker (OTT) is a technical analysis tool designed to help traders identify the direction and strength of a market trend. This indicator functions as an optimized moving average that adapts to market volatility, thereby providing dynamic support and resistance levels. The primary goal of the OTT is to smooth out price action and offer visual cues about potential changes in the trend. Core Components of the Indicator When you add the indicator to your chart, you will see two main
FREE

Статистика панели управления учетной записью
Это инструмент, который поможет вам иметь сфокусированное представление, чтобы узнать о прибылях и убытках вашего счета, чтобы вы могли отслеживать их, а также проводит анализ просадки, чтобы узнать полученный риск. Скачав и активировав его в личном кабинете, вы должны привязать его к любому символу например EURUSD H1, тогда с этого момента инструмент начнет отслеживать вашу статистику
панель полностью расширена, ее можно скрыть и переместить куда
FREE
Overview The Angle Market Structure indicator for MetaTrader 5 is a powerful analytical tool designed to automatically identify and visualize key market structure elements directly on your trading chart. It helps traders understand price action by highlighting significant Pivot Highs and Pivot Lows, detecting Break of Structure (BOS) events, and projecting potential deviation levels. This indicator provides a dynamic visual representation of market trends and potential turning points, aiding in
FREE

Currency Strength Chart is a powerful Forex indicator designed to track and visually represent the strength of individual currencies within a basket of the 8 major currencies: USD, EUR, GBP, JPY, AUD, NZD, CAD, and CHF. By calculating the relative strength of each currency, the indicator provides traders with a comprehensive overview of how each currency is performing against the others in real-time. This indicator helps traders identify potential trading opportunities by highlighting strong cur
FREE

LogVar — это индикатор, который вычисляет и отображает логарифмическое изменение цены , более точный способ измерения процентных изменений между периодами. Он сравнивает текущую цену закрытия с ценой закрытия n периодов назад (параметр iPeriod ) и отображает результат на увеличенной логарифмической шкале, что упрощает визуализацию силы и направления движения. Цвет линии меняется автоматически в зависимости от знака изменения: Зелёный: цена выше логарифмического эталона (восходящий тренд). Красны
FREE

Ulimate MTF Support & Resistance - 5 Star Best Seller New Year Sale - save $20 (normal price $79) Beginner or Professional our best selling multi-timeframe Pivot Prof will enhance your trading and bring you great trade opportunities with the Support and Resistance levels that professionals use. Pivot trading is a simple effective method for entering and exiting the market at key levels and has been used by professionals for decades and works on all symbols: Forex, Crypto, Stocks, Indicies et

Introducing TrendScope – a versatile trend analysis tool designed for traders who want clear, structured insights into market direction.
TrendScope is built to deliver precise trend identification across multiple markets and timeframes, helping traders filter noise and focus on clean opportunities. Check out our other indicators as well:
Profile: More Indicators
Key Features: Universal Compatibility : Works on Forex, synthetic indices, commodities, indices, and crypto pairs. Multi-Timeframe
FREE

AureX Indicator AureX Indicator is a technical analysis tool for MetaTrader 5.
It is based on a momentum‑style oscillator that measures price accelerates and decelerates. The indicator is designed to: calculate a smoothed internal momentum curve from price data highlight regular, hidden and exaggerated divergence between price and the oscillator mark areas where price movement and internal momentum are not aligned AureX is intended to support your own market analysis and trading plan. It does no
FREE

Daily pivot are relatively important in trading.
This indicator have options to select 5 commonly use pivot point calculations.
User input Choose Pivot Point Calculation (Method Classic, Method Camarilla, Method TomDeMark, Method Fibonacci or Method Woodies.) Choose Applied Timeframe for the calculation (M5, M15, H1, H4, D1, W1 etc) Can be attached to any timeframe Choose color of Pivot point Note:
For MT4, please refer here : https://www.mql5.com/en/market/product/22280
FREE

PLEASE HELP REVIEW/ SUPPORT/ SHARE THIS OTHER INDICATOR HERE https://www.mql5.com/en/market/product/51637 AS YOU DOWNLOAD THIS ONE FOR FREE. THANKS.
This Indicator is based on four moving averages and the PIVOT points. The indicator provides clarity to trading, especially in ranging markets when price is very slow and tight. You can trade intensively daily, every day with this indicator. You may decide to trade with this indicator alone and get the maximum out of the market. The indicator w
FREE

APT – Advance Pivot Trader Indicator for MetaTrader 5 APT – Advance Pivot Trader is a technical indicator developed for MetaTrader 5.
The indicator is based entirely on mathematical and algorithmic calculations and is designed to analyze market structure using pivot-based logic. The indicator does not use grid techniques, martingale strategies, or position sizing methods. It provides analytical information to support structured and disciplined trading decisions. Timeframe and Risk Guidance The
FREE

Free forever simple pip meter for MT5 with customizable font color. Display profit or loss in both points count and currency value. Supports 4 currency symbols ($,€,£ ,¥). For unsupported currencies, it shows a 3-character currency short form. Enhance your trading interface with clarity and precision. Easy to use and tailored for diverse Forex traders. Perfect for MT5!
FREE
The indicator is a line right at yesterday's closing price. With the indicator, there is no need for adding or deleting previous day close lines each new day. T he line gives you an instant visual reference point for support, resistance, and market sentiment. Whether you are day trading or swing trading, this line helps you quickly gauge where the market closed last session and how current price action relates to that level. It works seamlessly across all timeframes - from 1-minute charts to d
FREE

Предыстория:
Несколько лет назад я наткнулся на этот сайт в поисках индикатора для торговли бинарными опционами. Как начинающий трейдер я был настолько же уверен, насколько и наивен, что найду тот самый пресловутый "грааль", который поможет мне зарабатывать каждый день, просто повторяя за стрелками на экране. Я перепробовал, пожалуй, сотни различных индикаторов, платных и бесплатных. Но ни один из них не принёс мне положительного результата. Прошло время, и я вновь вернулся на этот сайт. Только

If you like this product, please give it a 5 star rating as a token of appreciation.
This indicator draws vertical lines marking key Forex trading sessions (Asian, London, New York) for a configurable number of past days. These “Silver Bullet” lines help traders quickly visualize session start and end times on the chart.
DaysToDisplay: How many previous days’ session lines to show. Session colors: Customizable line colors for each session. Session start hours: Local server hours for each sessi
FREE

The TRIXs Indicator is the combination of the TRIX (Triple Exponential Moving Average) indicator with the addition of a SMA (Simple Moving Average) signal. It provides signs of trend continuity and the start of a new trend.
The entry and exit points of operations occur when the indicator curves cross.
It performs better when combined with other indicators.
FREE

Do you want to see the most relevant supports and resistances at a glance? Tired of tracing the levels by hand? Multi Levels Detector is an indicator for MetaTrader that will draw supports and resistances according to the parameters entered, and also offers the possibility of executing an alert every time the price reaches any of its levels.
SETTINGS UsePercentage: Allows you to configure whether the distances between levels will be measured in points, or by a percentage of the asset.
TimeFram
FREE

GEN Ichimoku Signal Developer: gedeegi Overview GEN Ichimoku Signal is a technical indicator for the MetaTrader 5 platform. It combines two different trend analysis systems, Ichimoku Kinko Hyo and HalfTrend, into a single visual tool. The primary function of the indicator is to color the chart's candlesticks based on whether the conditions of these two systems are in alignment. The indicator provides a visual representation of market conditions by displaying one of three colors: one for aligned
FREE

ВВЕДЕНИЕ Индикатор Investment Castle был создан с надеждой на решение следующих проблем:
1. Определите правильное направление тренда на разных таймфреймах.
2. Показывает процент попаданий, процент выигрышей на графике.
3. Этот индикатор не перерисовывает график.
4. Индикатор встроен в советник Investment Castle EA .
* Посетите веб-сайт для получения установленных файлов, обновлений и многого другого: https://www.investmentcastle.com
ОТКАЗ ОТ ОТВЕТСТВЕННОСТИ «Индикатор инвестиционного замк
FREE

This indicator is very useful in observing the direction of the market. It allows users to enter multiple MA lines with specific display method. In addition, it is also possible to change the candle color same to color of the background of chart, so that we only focus on the MA lines. When a signal appears, represented by a red or green dot, we can consider opening a sell (red dot) or buy (green dot) order. Note: it need to set stoploss at the highest value of MA lines (with sell order) or lowe
FREE

Привет трейдерам, HiperCube, я рад представить вам новый индикатор MTF MA! Код скидки на 25% на Darwinex Zero: DWZ2328770MGM HiperCube Multi-Timeframe Moving Average или MTF MA — это индикатор, который позволяет вам отображать MA с более высокого таймфрейма и другого более низкого, так просто.
Особенности: Выберите таймфрейм из выпадающего меню Пользовательский период MA Пользовательский тип MA (EMA, SMA...) Пользовательский цвет MTF MA Для его разработки использовались Chatgpt и ИИ. Вывод Hip
FREE

English
VWAP Daily (Clean) is a simple and lightweight indicator that plots the classic Daily VWAP (Volume Weighted Average Price) directly on your MT5 chart. Features: Classic Daily VWAP calculation Supports real volume (if available) or tick volume Timezone offset option to match your broker’s server time Weekend merge option (merge Saturday/Sunday data into Friday) Clean version → no arrows, no alerts, only VWAP line VWAP is widely used by institutional traders to identify fair value, su
FREE

Ever feel lost in a trade, unsure of your true risk exposure? Have emotional decisions and a lack of discipline cost you dearly? The line between consistent profit and a blown account is drawn by one thing: professional risk management. But calculating and monitoring that risk in real-time is stressful and complex. Introducing Risk Matrix, the definitive visual command center for MetaTrader 5, engineered to bring military-grade discipline and crystal-clear clarity to your trading. Risk Matrix is
FREE
The WaveTrend Oscillator indicator is an enhanced version of the classic WaveTrend Oscillator, a momentum indicator. It is designed to identify overbought/oversold conditions and provide potential trend reversal signals. The core difference in this version is the application of a data "normalization" algorithm. This ensures the indicator's oscillation lines remain balanced around the zero line, causing the indicator window to always stay naturally centered. This is especially useful when trading
FREE

Tyr Bands Indicator (IC MARKETS GOLD). Just drag and drop. This indicators gets you entry points for the market. it is for gold, but you can configure for any other currency. Tyr Band works with BB and 3 different deviations, plus the Stochastic confirmation. So when the price closes below/above the BB Reversal Band (Red) and the Stochcastic is in the confirmation zone, then the arrow (buy/sell) appears. This arrow indicates that we can entry to the market up/down on the next opening. Since it i
FREE

Индикатор находит уровни максимального и минимального ценового объема (профиль рынка) на рабочей гистограмме для указанного количества баров. Композитный профиль. Высота гистограммы полностью автоматическая и адаптируется к любому инструменту и таймфрейму. Используется авторский алгоритм и не повторяет известные аналоги. Высота двух гистограмм примерно равна средней высоте свечи. Умное оповещение (smart alert) поможет вам сообщить о цене, касающейся уровня объема.
Концепция Smart Money. Low Vo

Смысл этого индикатора состоит в том, чтобы находить уровни Мюррея на всех таймфреймах и объединять их в комбо-уровни , включающие сигнальные уровни, основанные на сильных уровнях Мюррея (+2, +1, 8, 4, 0, -1, -2). Чем меньше таймфрейм, тем больше у вас шансов сразу увидеть уровень комбо. Он будет выделен цветом. При наведении курсора на любое число появится подсказка, к какому таймфрейму относится уровень. Но вы всегда будете видеть текущий таймфрейм крайним левым. Умное оповещение помо

Индикатор Market Steps разработан и построен на основе корреляций времени/цены Ганна и оптимизирован по правилам Price Action для рынка Forex. Он использует концепции потока рыночных ордеров для прогнозирования потенциальных ценовых зон для большого объема ордеров.
Индикатор Уровней может быть использован для самостоятельной торговли или в качестве комбинации для фильтрации неверных сигналов других стратегий/индикаторов. Каждый трейдер нуждается в таком мощном инструменте, чтобы иметь на граф
Gold Flux Signal Pro is an advanced MT5 Indicator with Multi-Timeframe Logic, Candle Timer & Structured Signal Panel Smart Scalping & Swing Indicator for MT5
This MT5 indicator is built for traders who value clarity, structure, and precision in decision-making. It provides clean buy and sell signal visualization using a stable logic system designed to maintain consistency after candle close. The interface includes a modern UI panel that displays a real-time candle timer, upcoming candle inform
Simple SuperTrend indicator, similar to that of TradingView's.
It has buffers for buy and sell signal, if you want to integrate this into an EA.
It helps traders easily identify trends by providing clear buy and sell signals based on price movements. Designed for simplicity, it’s easy to use and integrates well with various trading strategies, making it a great option for traders of all levels.
Happy trading!
FREE
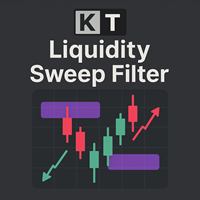
KT Liquidity Sweep Filter выявляет и выделяет ключевые зоны ликвидности. Он сочетает эти зоны с явными отскоками от ценовых уровней и адаптивным фильтром тренда для генерации точных сигналов на покупку и продажу, соответствующих направлению рынка. Индикатор различает основные и второстепенные зоны ликвидности, отмечая основные области большими стрелками, а второстепенные — меньшими, для легкой визуальной идентификации. Большие стрелки: Обозначают сильные сигналы на разворот, исходящие из основны
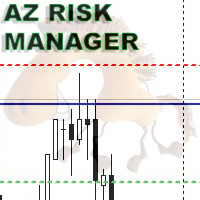
A simple indicator for calculating risk and automatically calculating the take profit line. In the settings, you enter the desired risk to profit ratio, the indicator will automatically calculate the volume for entry and show where to set the take-profit line to maintain the proportion. The risk is calculated based on your balance data. The information panel can be moved around the screen. The stop-loss line can also be moved, this will recalculate the entry volume and the take-profit position.
FREE

CandleScope Pro Demo – Candlestick Pattern Indicator CandleScope Pro Demo is a powerful and easy-to-use indicator for MetaTrader 5 that automatically detects and labels the most popular candlestick patterns directly on your chart. This tool is designed to help traders of all levels quickly identify key reversal and continuation signals, improving decision-making and trading accuracy. Key Features: Automatic Detection: Instantly scans and highlights the following candlestick patterns: Doji Spin
FREE

Version 1.5: manual color change added
This indicator helps to trade price action and momentum strategies like Guerrilla Trading or similar strategies.
The indicator displays: most recent highs and lows number of consecutive breaks past breaks of most recent highs and lows retest lines flag formations manual color change User can change colors. Go to Indictor Properties/Input, set "Auto Color" to false and change the colors. Set "Auto color" back to true to go back to pre-set colors. Please wa
FREE

«HiperCube USD INDEX (DXY /USDX) » — это финансовый бенчмарк, представляющий собой производительность определенной группы активов, таких как акции, облигации или сырьевые товары, стоимость которых выражена в долларах США. Эти индексы помогают инвесторам отслеживать и сравнивать производительность определенных секторов или рынков с течением времени. Выражаясь в долларах США, индекс обеспечивает последовательную меру оценки инвестиций независимо от национальной валюты активов или географического
FREE
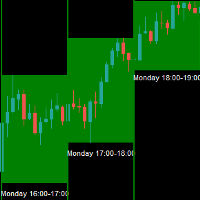
The Entry Signal Analyzer is a sophisticated MetaTrader 5 indicator designed to analyze and identify optimal trading hours based on price movement patterns. The indicator analyzes gold currency only a updated version is currently being developed for other symbol the indicator in the strategy tester is non-functional works on the real chart Statistical Analysis: Analyzes historical price movements for each hour of the trading day Tracks success rates and consistency of movements Calculates poi
FREE

You can configure to show multiple take profit targets based on the current price all based on volatility; I personally use it every day with an script to automate my entries; For example if i want to stop out for 4 volatility level and use an take profit of 10 volatility based on the 2 minutes of the previous 20 bars i can do it with this indicator; You can configure multiple take and multiple stops with different names to show in your symbol, all take profit and stop losses in this indicator i
FREE

Buyer Seller Balance Analyzer предоставляет комплексный обзор силы покупателей и продавцов на разных таймфреймах. Основные компоненты: Таблица Buyer/Seller Balance Отображает соотношение покупателей и продавцов Включает таймфреймы от M1 до MN1 Цветовое различие (зелёный = покупатели, красный = продавцы) Ключевые метрики: Buyers (%) – процентное соотношение покупателей Sellers (%) – процентное соотношение продавцов ️ Balance – разница между покупателями и продавцами

Apex WilliamsR MT5 Looking for sharper entries? This indicator provides the foundation for visual price action. However, specialized markets require specialized tools. If you trade Gold or Indices, check out Gold Master Indicator or Nasdaq Master Indicator , specifically optimized for those assets' unique volatility. Don't just trade; trade with the right edge.
Apex Williams %R MT5 is a professional technical indicator that enhances the traditional Williams %R oscillator with advanced momentum
FREE

Adaptive Session Trend Pro Easy Plug-and-Play Auto-Optimized Session Trend Indicator for MT5 Adaptive Session Trend Pro is a fully automatic, session-aware trend indicator for MetaTrader 5 that intelligently adapts to the symbol, instrument type, and broker trading session — with zero manual configuration required . Simply attach the indicator to any chart and it instantly: Detects the traded instrument (XAUUSD, US30, EURUSD, Forex pairs) Detects broker server time automatically Applies the cor
FREE
MetaTrader Маркет предлагает каждому разработчику торговых программ простую и удобную площадку для их продажи.
Мы поможем вам с оформлением и подскажем, как подготовить описание продукта для Маркета. Все продаваемые через Маркет программы защищаются дополнительным шифрованием и могут запускаться только на компьютере покупателя. Незаконное копирование исключено.
Вы упускаете торговые возможности:
- Бесплатные приложения для трейдинга
- 8 000+ сигналов для копирования
- Экономические новости для анализа финансовых рынков
Регистрация
Вход
Если у вас нет учетной записи, зарегистрируйтесь
Для авторизации и пользования сайтом MQL5.com необходимо разрешить использование файлов Сookie.
Пожалуйста, включите в вашем браузере данную настройку, иначе вы не сможете авторизоваться.