Смотри обучающее видео по маркету на YouTube
Как купить торгового робота или индикатор
Запусти робота на
виртуальном хостинге
виртуальном хостинге
Протестируй индикатор/робота перед покупкой
Хочешь зарабатывать в Маркете?
Как подать продукт, чтобы его покупали
Технические индикаторы для MetaTrader 5 - 40

Exclusive Arrival: Presenting for the First Time . This is your secret weapon for predicting which way the wind will blow with the next market shift. It assists you in developing your trading strategy by predicting the direction of the next candle. Compatible with forex, stocks, and cryptocurrencies on all timeframes, but higher timeframes are recommended. MT4 Version - https://www.mql5.com/en/market/product/108931/ How does it work ? It's pretty neat. The algorithm separates green and red ca
ForexRubyEA is a fully automated trading system designed to simplify your trading. Using forexruby Custome Indicator.
It manages trades with smart logic, risk control, and built-in protection features — all without requiring constant monitoring. Download EA for this indicator: forexrubyaibot DM: https://www.mql5.com/en/users/forexruby/
Key Features Plug & Play – Easy setup, works out of the box. Automated Trading – Places, manages, and closes trades automatically. Risk Management –
FREE

Session Finder – Track Forex Market Sessions with Precision
Stay ahead of the market with Session Finder , a sleek HUB style design for MetaTrader 5. It provides real-time visibility into the world’s major trading sessions—Sydney, Tokyo, London, and New York—so you always know which markets are open, closed, or about to change. Key Features: Live Session Status: See whether a session is currently open or closed at a glance. Countdown Timers: Track exactly how long until a session opens or close

Введение в алгоритм GARCH Improved Nelder Mead GARCH - это сокращение от Generalized Autoregressive Conditional Heteroskedasticity (Обобщенная авторегрессионная условная гетероскедастичность). Представляет собой модель прогнозирования волатильности, обычно применяемую в финансовой сфере. Модель GARCH впервые появилась в работе датского экономиста Тима Петера Боллерслева (Tim Peter Bollerslev) в 1986 году. Лауреат Нобелевской премии 2003 года Роберт Ф. Энгл внес огромный вклад в усовершенствовани
FREE

Scanner Intelligence Hub MT5
**OVERVIEW**
Scanner Intelligence Hub is a professional multi-market analysis indicator designed for traders who need a comprehensive scanning and technical analysis tool. It seamlessly integrates multi-symbol, multi-timeframe analysis with advanced Smart Money Concepts (SMC) into an intuitive, professional interface.
**KEY FEATURES**
**ADVANCED MULTI-MARKET ANALYSIS** - Simultaneous scanning of multiple currency pairs and timeframes - Intelligent 0–10 scori

Pivot eXtreme Pivot adalah level referensi penting yang digunakan trader untuk memetakan potensi support & resistance intraday maupun jangka lebih panjang.
Dalam sistem ini, level pivot dikembangkan menjadi P (Pivot Point utama) , R1–R13 (Resistance) , serta S1–S13 (Support) . Pivot Point (P) Titik pusat utama, dihitung dari rata-rata harga (High + Low + Close) / 3 . Berfungsi sebagai acuan keseimbangan harga : Jika harga di atas P → tren cenderung bullish. Jika harga di bawah P → tren cenderung
FREE

Индикатор Magic LWMA очень помогает в определении направления тренда. Он может стать отличным дополнением к вашей существующей стратегии или основой для новой. Мы, люди, можем принимать лучшие решения, когда лучше видим визуально. Поэтому мы разработали его, чтобы отображать разные цвета для восходящих и нисходящих трендов. Каждый может настроить это так, как ему больше всего подходит. Установив период тренда, мы можем оптимизировать его для более длинных или коротких трендов для нашей стратеги
FREE
Price Edge – Видьте цену раньше, чем рынок двинется В трейдинге одна секунда может стать решающей разницей между прибыльной сделкой и упущенной возможностью .
С Price Edge на MetaTrader 5 (MT5) вы больше никогда не пропустите ни один тик. Price Edge — это не просто индикатор, это ваше преимущество в торговле.
Он обеспечивает обновления цены в реальном времени , чтобы ваши решения были всегда точными, быстрыми и уверенными. Почему выбирают Price Edge Live Price Indicator MT5 – мгновенно отоб
FREE

The Relative Strenght Index presented to the world in 1978 by J. Welles Wilder Jr. in his book " New Concepts in Technical Trading Systems " is widely used around the world in several ways, not only with the traditional approach of Overbought and Oversold states, which in several cases and depending on the assets and timeframes it just simply doesn't work anymore . BUT, this indicator has its value when used, for instance, looking for divergences between its measuring system and the Prices appea

PipTick Volume indicator is a great tool for measuring tick volume or real volume activity. Он помогает трейдерам легко и просто оценить текущий объем. Индикатор для классификации объема применяет скользящую среднюю и ее коэффициенты. Соответственно, участок, где расположен объем (относительно скользящей средней), помечается как сверхнизкий, низкий, средний, высокий, очень высокий или сверхвысокий. Данный индикатор рассчитывает скользящую среднюю четырьмя способами: SMA - простая скользящая сред

Сигнал "Чудесный осциллятор" Билла Вильямса из книги "Торговый хаос 2" на барах. Как правило используется для добавления позиции после входа по сигналу "Отклоняющийся бар" ----------------------------------------------------------------------------------------------------------- Пожалуйста убедитесь, что вы правильно понимаете систему Билла Вильямса прежде чем рисковать настоящими деньгами используя этот индикатор. Идеальный сетап для входа: 1) Дивиргенция с переходом через нулевую линию 2) Откл
FREE

MP Price Change Indicator is a tool to calculate the price movement by percentage. The Value of this indicator can be adjusted to look back of the percent of price change within certain timeframes. This is a powerful tool when used by other indicators as well, such as ATR and ADR, for understanding price fluctuations and tolerance in different strategies. ___________________________________________________________________________________ Disclaimer:
Do NOT trade or invest based upon the analysi
FREE

Мой самый популярный и востребованный продукт здесь https://www.mql5.com/ru/market/product/41605?source=Site+Market+Product+From+Author#
Индикатор отображает свечи заданного старшего таймфрейма, на меньших таймфреймах TF_Bar - выбор старшего таймфрейма, на основе которого будут отображаться свечи на текущем; Number_of_Bars - предельное число баров, до которого будет производиться расчет индикатора; Color_Up - цветовое отображение бычьих свечей; Color_Down - цветовое отображение медвежь
FREE

Рынок Форекс может пройти множество различных ценовых путей к достижению некоей точки в будущем. Будущее динамично. Поэтому, планирование торговли с возможным будущим сценарием является важным шагом для вашего успеха. Для этих целей представляем вашему вниманию Harmonic Pattern Scenario Planner, первый предиктивный инструмент для определения гармонических моделей в своем роде.
Основные характеристики Прогнозирование будущих моделей для анализа сценариев 11 Определение гармонических моделей Авто

Description The Profit and Loss Indicator by Creative Tech Solutions is a robust and comprehensive tool designed to help traders monitor their trading performance in real-time. This indicator provides detailed metrics on profits and drawdowns, ensuring traders are always informed about their trading activities and performance. With customisable alerts and display settings, this indicator is an essential tool for any serious trader. Features Real-Time Metrics : Monitor profit and drawdown percent
FREE
Mystic Pulse V2.0 — это индикатор силы тренда, основанный на системе направленного движения (DI+ / DI−). Он подсчитывает, сколько последовательных свечей показывают усиление бычьего или медвежьего импульса. Рост DI+ увеличивает позитивный счётчик (давление на рост), а рост DI− увеличивает негативный счётчик (давление на падение). При ослаблении импульса счётчики сбрасываются, что даёт ясное визуальное представление о силе тренда и возможных точках разворота. Эта версия MQL5 является конверсией о
FREE
Hi Traders, RSI and Stochastic are among the most popular indicators used to measure momentum and help identify overbought and oversold conditions. This indicator displays two optional RSI and Stochastic values on your chart, helping you save chart space and keep things clean and organized. You can set your desired upper and lower thresholds for RSI and Stochastic to monitor conditions. If the RSI (or Stochastic) value is between the upper and lower thresholds, the text color will remain your de
FREE

About. This indicator is the combination of 3 Exponential Moving averages, 3,13 and 144. it features Taking trades in the direction of trend, and also helps the trade to spot early trend change through Small moving averages crossing Big Moving averages Product features 1. Have built in Notification system to be set as the user desires (Alerts, Popup notification and Push Notification to Mobile devices) so with notification on, you do not need to be at home, or glued to the computer, only set and
FREE

Индикатор основан на стандартном индикаторе объемов Volumes. Он рассчитывает средний объем на основе выбранных последних N баров, и если значение объема превышает указанное среднее значение в %, цвет индикатора изменится. Индикатор отображается в отдельном окне.
Входные параметры Bars used to calculate the average volume - количество баров для расчета среднего объема. Threshold (in %) for changing the color of the Bar - порог в %, при котором цвет бара изменится.
FREE

AliSession Highlight is an indicator that highlights a specific period of time according to your preferences. It can help you gain a clear vision of price movements into a specific session, the range of a session, and also to easily identify the high and low of the session. You can use it on any currency pairs, indices, and any timeframes. Settings: Start Hour: Set the hour to initiate the session highlight. Start Min: Set the minute for the start of the session highlight. End Hour: Specify the
FREE
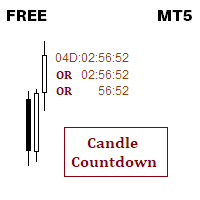
This indicator is about candle countdown timer
You can change timer color 3 colors can be set for different time range You can set font size, you can set font name If you need anything extra, ping me, I will add that functionality.
Thank you :) Always open to feedback and criticism if it helps me provide you more value. - Rahul
My other indicators you may like
[I have been trading forex for last 6 years and i publish every indicator that i build for my personal use so everyone can benefit]
FREE

Индикатор для "скриншотирования" графика с заданным интервалом. Файлы сохраняются в директорию " MQL5\Files\ScreenShots\Symbol TF\ " и именуются датой и временем съемки ( 2017.06.20 23.56.24.png ) Настраивается: Width и Height — ширина и высота сохраняемых скриншотов, IntervalSeconds — интервал сохранения в секундах. Внимание ! Если поставить большой размер скриншотов и высокую частоту съемки, может закончиться место на жестком диске. Не удаляйте папку, в которую пишутся скриншоты, индикатор смо
FREE

** All Symbols x All Timeframes scan just by pressing scanner button ** *** Contact me to send you instruction and add you in "Market Structure group" for sharing or seeing experiences with other users. Introduction: Market structure is important for both new and professional traders since it can influence the liquidity and price action of a market. It’s also one of the most commonly used techniques to understand trends, identify potential reversal points, and get a feel for current mar

Это версия MT5 Вот несколько показателей, которые работают вместе. Он в основном работает с движущихся средних и различных уровней ATR создания динамического канала, через который цена осушенных. Как я всегда рекомендую, вы должны попробовать его, прежде чем использовать его вживую, так что вы понимаете, как это работает. Сигнал входа на рынок похож на другие индикаторы MA, но с этим у вас также есть графический анализ момента, когда тренд найден и динамические уровни, чтобы скорректировать стоп
FREE

PACK 2 do Phi Cubic Fractals com opção para extender os indicadores no FUTURO, para o lado direito do gráfico Este produto contem os indicadores do PACK 2 (ROC full / SAINT 8 / SAINT 17 / SAINT 34 / SAINT 72 ) + MODO FUTURO Phi ROC - indicador do tipo oscilador, semelhante ao MIMAROC, que é capaz de mostrar a direção e a força do mercado, bem como determinar o ponto de entrada ótimo; Phi SAINT - indicador do tipo oscilador, semelhante ao SANTO do Phicube, que é capaz de mostrar a direção e a

Индикатор Fractals отображает на графике только фракталы с заданными параметрами в настройках индикатора. Это позволяет с большей точностью фиксировать разворот тренда исключая ложные развороты. По классическому определению фрактал, это свеча - экстремум на графике, который не пересекала цена 2 свечи до и 2 свечи после появления свечи фрактала. В данном индикаторе есть возможность настройки количества свечей до и после экстремума, а также минимальное количество пунктов терминала ухода цены от э

Professional Histogram MT5 или сокращенно PH - это высокоэффективный и надежный инструмент, который позволяет определить направление и силу тренда. PH прост в использовании и настройке, поэтому подойдет как начинающим так и опытным трейдерам. В отличие от большинства индикаторов, Professional Histogram находит более длительные тренды и дает меньше ложных сигналов. При появлении сигнала на покупку или продажу срабатывает алерт, что позволяет своевременно открыть позицию и не сидеть постоянно у мо
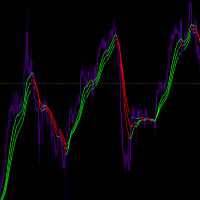
Input Parameters JawPeriod (default=9): Period for the blue line JawShift (default=0): Shift for the blue line TeethPeriod (default=7): Period for the red line TeethShift (default=0): Shift for the red line LipsPeriod (default=5): Period for the green line LipsShift (default=0): Shift for the green line Signals Bullish Conditions When price moves above all lines (all lines turn Lime) Potential buying opportunity Confirms upward momentum Bearish Conditions When price moves below all
FREE

Индикатор строит две простые скользящее средние по ценам High и Low. Линия MA_High отображается, когда скользящая направлена вниз. Она может быть использована для выставления стоп ордера для позиции на продажу. Линия MA_Low отображается, когда скользящая направлена вверх. Она может быть использована для выставления стоп ордера для позиции на покупку. Индикатор используется в эксперте TrailingStop . Параметры Period - период расчета скользящей среднейю Deviation - коэффициент сдвижения/раздвижен
FREE

MEMA TrendHunter is a multifunctional dual moving average trading indicator specifically designed for the MT5 platform. It deeply integrates the synergistic advantages of the Simple Moving Average (MA) and Exponential Moving Average (EMA), helping traders quickly identify market trends and trading signals, while offering highly flexible custom configurations and multi-dimensional reminder systems. Core Functions: One-Stop Coverage from Data Calculation to Trading Decisions 1. Dual Moving Av
FREE

Inicialmente este indicador foi elaborado e pensado para rastrear pontos ou velas onde há força de tendência. Como nas grandes descobertas, cheguei ao indicador que mostra principalmente velas de reversão, pontos de tensão, alta liquidez, resistência. O indicador traz simplificação ao gráfico, indicando todos os pontos onde possivelmente teríamos lta´s, ltb´s, médias móveis, bandas, ifr alto. O indicador não faz o gerenciamento de risco, apenas mostra as velas onde podem ocorrer reversão. Lembre
FREE

Bollinger Bands % or Bollinger Bands Percentage is one of the indicators used in the Sapphire Strat Maker - EA Builder .
It is calculated using the following formula:
Perc = (CLOSE_PRICE - LOWER_BOLLINGER) / (UPPER_BOLLINGER - LOWER_BOLLINGER) * 100
Thus, by taking the difference between closing price to the lower band and dividing it by the difference of the upper and the lower price levels of a Bollinger Bands indicator, we can calculate this indicator.
It shows how far the price is from
FREE

The BandsFill Indicator is a modified Bollinger Bands with a colored cloud. It has two adjustable parameters: Period Deviation The cloud is colored as follows: If the price crosses the upper band, the cloud is blue. If the price crosses the lower band, the cloud is pink. Thanks to this, the BandsFill Indicator provides traders with an easy opportunity to detect various features and patterns in price dynamics that are invisible to the naked eye. Based on this information, traders can predict
FREE

Hi there! Since I am starting commercial and non-commercial product publishing I would highly appreciate: If you like this product, please rate it. That will help to promote not only this product, but indirectly another ones. So, such promotion will help to make some money from commercial products. Thus, I will have opportunity to fund my another directions of trading researches like bot development using mql4 and mql5 programming languages as well as python written products like crypto bots. If
FREE
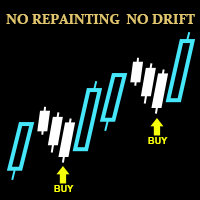
Декларация: НЕ ПЕРЕРИСОВЫВАЕТСЯ, НЕТ ЗАДЕРЖКИ, НЕТ СМЕЩЕНИЯ – СИГНАЛЫ НИКОГДА НЕ ПРОПАДАЮТ! Руководство по использованию индикатора (Простое и Эффективное): (1) Красная зона + Стрелка ВВЕРХ → Открывайте LONG
(2) Зеленая зона + Стрелка ВНИЗ → Открывайте SHORT
(3) Чередование Красной/Зеленой зон → Фаза консолидации (НЕ ТОРГУЙТЕ!) Параметры по умолчанию оптимизированы для надежных сигналов, но могут быть настроены при необходимости. Инструкция : (1) Данный индикатор подходит для любых

Highly configurable Relative Vigor Index (RVI) indicator.
Features: Highly customizable alert functions (at levels, crosses, direction changes via email, push, sound, popup) Multi timeframe ability ( higher and lower timeframes also) Color customization (at levels, crosses, direction changes) Linear interpolation and histogram mode options Works on strategy tester in multi timeframe mode (at weekend without ticks also) Adjustable Levels Parameters:
RVI Timeframe: You can set the lower/higher t
FREE

Индикатор рисует линии поддержки и сопротивления на важном участке графика, для принятия решений. После того как появилась линия тренда, можно торговать на пробой или отбой от неё, а также выставлять ордера вблизи неё. Устаревшие линии тренда удаляются автоматически. Таким образом, мы всегда имеем дело с самыми актуальными линиями. Индикатор не перерисовывается .
Настройки:
Size_History - размер рассчитываемой истории. Num_Candles_extremum - количество свечей с каждой из сторон экстремума

Trend flow ICT helps you quickly assess the strength and direction of the trend on the chart. *Note: Free indicator included - https://www.mql5.com/en/market/product/149447
Configuration guide Score: The length of the scoring window. Smaller → more sensitive, prone to noise. Larger → smoother, less signals. ATR: ATR period to standardize fluctuations. Trend threshold: Threshold to confirm a trend. Strong trend: Strong trend threshold. Min Body (x ATR): Minimum candle body to confirm a breakou
FREE

This is the Full Version, to get the free version please contact me. The free version works on “USDJPY” charts. All symbols and time frames scanner. Contact me after payment to send you the User-Manual PDF File. OVER and UNDER
Over & Under pattern is an advanced price action trading concept in the trading industry. The Over & Under pattern is more than a confluence pattern or entry technique than a trading strategy. It is a reversal pattern that is created after a significant obvious trend. It

Highly configurable Force Index indicator. Features: Highly customizable alert functions (at levels, crosses, direction changes via email, push, sound, popup) Multi timeframe ability Color customization (at levels, crosses, direction changes) Linear interpolation and histogram mode options Works on strategy tester in multi timeframe mode (at weekend without ticks also) Adjustable Levels Parameters:
Force Index Timeframe: You can set the current or a higher timeframes for Force Index. Force Ind
FREE

Nem Nem is super accurate mt5 indicator it is working with any pair any time frame it will show and provide you with high Winrate signal you can use for forex pairs , gold and any other pairs it is easy to use also you can see the white lines for starting and end of signals it will help you to read the chart and enter and make correct decisions in trades. also it will be clear for you when to enter and exit from any trades
FREE

Visualize seu histórico de negociações de forma estruturada e detalhada, com taxas de acertos e lucro separados por dia, semana, mês e total, além de detalhes sobre o ativo, horário do servidor e posições/ordens em andamento. Este painel foi criado visando o uso em contas do tipo HEDGE, porém pode ser utilizado em contas do tipo NETTING sem nenhum problema. Na versão PREMIUM deste Painel você tem opção de utilizar uma micro boleta com botões para facilitar o tratamento e execução de ordens em an
FREE

The "Standardize" indicator is a technical analysis tool designed to standardize and smooth price or volume data to highlight significant patterns and reduce market noise, making it easier to interpret and analyze.
Description & Functionality: Standardization : The indicator standardizes price or volume values by subtracting the mean and dividing by the standard deviation. This converts the data into a distribution with zero mean and standard deviation of one, allowing different data sets t
FREE
The Percentage Average True Range (ATR) indicator measures market volatility by calculating the ATR of a selected asset and expressing it in one of three customizable formats: Percentage (%) relative to the current price, enabling easy comparison across assets with different price ranges. Basis Points (bps), where 1 bps equals 0.01%. Real ATR values, representing the raw ATR in price terms. By normalizing ATR values using percentage or basis points, this indicator allows for direct comparison of
FREE

This indicator shows when user set sessions are active and returns various tools + metrics using the closing price within active sessions as an input. Users have the option to change up to 4 session times.
The indicator will increasingly lack accuracy when the chart timeframe is higher than 1 hour.
Settings
Sessions
Enable Session: Allows to enable or disable all associated elements with a specific user set session.
Session Time: Opening and closing times of the user set session in the

AP Session Boxes — Asian / London / NY Range Overlay (MT5 Indicator) Clean session boxes on your chart.
This lightweight indicator draws the Asian , London , and New York time windows directly on the chart, including each box’s high and low as dashed lines. It’s perfect for quick context, breakout planning, and clean screenshots. Instant structure: See where the market ranged during key sessions. Breakout prep: Use the hi/lo lines as reference for pending orders or alerts fr
FREE

Doji Engulfing Paths enables to get signals and data about the doji and the engulfing patterns on charts. It makes it possible to get opportunities from trends, and to follow the directional moves to get some profits on the forex and stocks markets. It is a good advantage to take all the appearing opportunities with reversal signals and direct signals in order to obtain some profits on the forex market. With the demo version, only the signals starting with the 20th candle or bar are available.
FREE

The EMA Engulfing Cross indicator is an indicator for the MetaTrader 5 platform that signals potential buy and sell opportunities based on an engulfing candle pattern after a recent exponential moving average cross. You can adjust how recently the trend change must have occurred using the PASTemaCROSS input. The RSI oversold/overbought function is used to confirm the signals generated by the moving averages. It takes into account the previous bar before the engulfing bar, and it is best used wi
FREE

Non-proprietary study of Joe Dinapoli used for trend analysis. The indicator gives trend signals when the fast line penetrates the slow line. These signals remain intact until another penetration occurs. The signal is confirmed at the close of the period. It is applicable for all timeframes. Inputs lnpPeriod: Period of moving average. lnpSmoothK: %K period. lnpSmoothD: %D period. ********************************************************************************
FREE

IDixie - это индикатор, показывающий значения открытия и закрытия индекса американского доллара DXY или "Дикси". Индикатор рассчитывается из взвешенных значений 6 основных символов: EURUSD, USDJPY, GBPUSD, USDCAD, USDSEK и USDCHF. Помимо значений "Дикси", индикатор также показывает скользящую среднюю. Вы можете задать период скользящей средней. Когда бары индикатора пробивают скользящую среднюю, это создает хорошие сигналы для входа в рынок. Как правило, сигналы индикатора надежнее, чем похожие
FREE

When prices breakout resistance levels are combined with momentum oscillator breaks out its historical resistance levels then probability emerges to record farther higher prices. It's strongly encouraged to confirm price breakout with oscillator breakout since they have comparable effects to price breaking support and resistance levels; certainly short trades will have the same perception. Concept is based on find swing levels which based on number of bars by each side to confirm peak or trough
FREE
Этот индикатор — продвинутый монитор убыточных позиций , разработанный, чтобы помочь вам своевременно реагировать и защищать ваш капитал. Он в реальном времени анализирует все открытые сделки по текущему символу, рассчитывает волатильность с использованием ATR на нескольких таймфреймах и определяет, насколько близко цена находится к вашему стоп-лоссу (Stop Loss). Он отображает визуальные линии ( динамический стоп-лосс и точку безубыточности ) и панель в стиле Bloomberg с ключевой информацией по
FREE

This is the Full Version, to get the free version please contact me.
The free version works on “AUDNZD” and “XAUUSD” charts.
All symbols and time frames scanner
Head and Shoulder
One of the most popular Price Action patterns is the Head and Shoulders pattern. The pattern has three local tops that resemble the left shoulder, head, and right shoulder. The head and shoulders chart pattern appears in all kinds of markets, including Forex, cryptocurrency, commodities, stocks, and bonds. The head

Hyper DM, Moving Distance from Moving Averages is an indicator that allows you to define the distance in points of the upper and lower bands in relation to the moving average in the middle.
Its operation is simple, it has configuration parameters of the moving average of the middle and based on it and the defined distance parameters of the upper and lower bands, it is plotted in the graph.
FREE

The utility draws pivot levels for the selected timefram in classic method. Pivot = (high + close + low) / 3 R1 = ( 2 * Pivot) - low S1 = ( 2 * Pivot) - high R2 = Pivot + ( high - low ) R3 = high + ( 2 * (Pivot - low)) S2 = Pivot - (high - low) S3 = low - ( 2 * (high - Pivot)) you can change the timeframe, colors and fontsize. also you can change the text for the levels.
Have fun and give feedback...
FREE
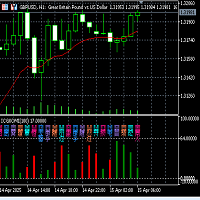
Fuxi Guaxiang Dual-color Oscillation Indicator Function and Usage Instructions (V2.1)
Fuxi Guaxiang Dual-color Oscillation Indicator Instructions: (1) This Guaxiang change indicator is based on the Yin-Yang transformation thought of the "Book of Changes" philosophy in ancient Chinese culture, integrating the results of the long-short game in each candlestick K-line period of the financial trading K-line chart, using China's oldest predictive coding method, in the form of the 64 Guaxiang of the
FREE
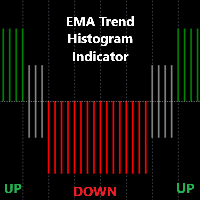
Detailed Description: The EMA Trend Histogram Indicator is a powerful tool for traders seeking clear trend identification based on the widely-used Exponential Moving Averages (EMAs).This indicator provides an easy-to-interpret histogram and helps you simplify trend identification by using the 50 EMA and 200 EMA on two crucial timeframes: H1 and H4. By observing the relationship between short-term and long-term EMAs on multiple timeframes, this indicator provides a quick and clear view of mark
FREE

Сканер Панели CCI для MT5 Сканер Панели CCI для MT5 — это инструмент, который помогает отслеживать уровни Индекса Товарного Канала (CCI) на различных временных интервалах и инструментах, а также предоставляет оповещения в реальном времени, когда обнаруживается новый сигнал. Он удобен в использовании и не требует больших вычислительных ресурсов, что обеспечивает плавную работу на любом компьютере. Ключевые функции Автоматическая группировка инструментов : Сканер собирает все инструменты из вашего
FREE

Highly configurable MFI indicator. Features: Highly customizable alert functions (at levels, crosses, direction changes via email, push, sound, popup) Multi timeframe ability Color customization (at levels, crosses, direction changes) Linear interpolation and histogram mode options Works on strategy tester in multi timeframe mode (at weekend without ticks also) Adjustable Levels Parameters:
MFI Timeframe: You can set the current or a higher timeframes for MFI. MFI Bar Shift: you can set the
FREE
Данный индикатор определяет каналы по которым движутся цены на истории торговли. Существует много торговых стратегий, которые основаны на торговле в каналах на прорыве границы канала. Этот индикатор может рисовать ценовые каналы, считывая информацию сразу с нескольких таймфреймов (с текущего, со второго и третьего). Можно настроить цвет и толщину линий для каждого таймфрейма. Также, можно устанавливать различное расстояние между максимумами и минимумами для построения каналов или линий. Есть и

Clever Parabolic RSI Умный осциллятор, объединяющий Parabolic SAR и RSI для точных торговых сигналов Этот осциллятор сочетает в себе силу двух популярных индикаторов — Parabolic SAR и RSI , создавая интеллектуальную систему, которая наглядно отображает состояние рынка , силу тренда и предоставляет четкие сигналы на покупку или продажу . Как это работает: Зелёная квадратная точка — начало восходящего тренда Красная квадратная точка — начало нисходящего тренда После первого сигнала

The new version of MirrorSoftware 2021 has been completely rewriten and optimized.
This version requires to be loaded only on a single chart because it can detect all actions on every symbol and not only the actions of symbol where it is loaded.
Even the graphics and the configuration mode have been completely redesigned. The MirrorSoftware is composed of two components (all components are required to work): MirrorController (free indicator): This component must be loaded into the MASTER
FREE

Индикатор Magic SMA очень помогает в определении направления тренда. Он может стать отличным дополнением к вашей существующей стратегии или основой для новой. Мы, люди, можем принимать лучшие решения, когда лучше видим визуально. Поэтому мы разработали его, чтобы отображать разные цвета для восходящих и нисходящих трендов. Каждый может настроить это так, как ему больше всего подходит. Установив период тренда, мы можем оптимизировать его для более длинных или коротких трендов для нашей стратегии
FREE

ATR Индикатор на основе Heiken Ashi – это уникальный инструмент анализа волатильности, который сочетает Средний Истинный Диапазон (ATR) с расчетами свечей Heiken Ashi , обеспечивая более плавное и надежное измерение рыночной волатильности. В отличие от традиционного ATR, который использует стандартные свечи, этот индикатор применяет формулу Heiken Ashi, чтобы исключить рыночный шум и предоставить более точные сигналы.
Основные особенности: • ATR на основе свечей Heiken Ashi – более
FREE

MT5 Alert Indicator Please add Ema moving averages 60/100/200 & Rsi period 10 levels 30/70 to your chart. This indicator alert on a trend reversal strategy were - ema 60 > 100&200 - ema 100 < 200 And the Rsi is below 30 FOR BUY SIGNAL
Use this strategy in confluence with a larger timeframe trend in the same direction. This strategy identifies great entry opportunities to enter an early trend.
FREE
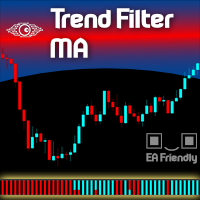
One of the best tools category for an Expert Advisor is the Filtering System . Using a filter on your entries will take your metrics to the good side. And even when you trade manually a filtering system is more than welcome. Let us present a commonly used filtering system based on Exponential Moving Averages - in fact, you can choose the type of the MAs as you wish and also mix them all up - we called this indicator Filter Trend MA . We present this indicator as a colored strip you can use at th

Индикатор Hyper Force, первоначально созданный в 1984 году Дэвидом Вейсом, в форме волны показывает силу тренда символа.
Чем больше волна, тем сильнее тренд.
Маленькие волны означают слабый тренд или рынок без тренда.
В волне, чем больше разница между одним баром и другим, тем сильнее тренд.
Когда расстояние между одним баром и другим начинает уменьшаться, это означает, что волна начала терять свою тенденцию.
Поэтому ловить волну с сильной силой и выходить из нее, когда она ослабевает, иде
FREE

Индикатор " Pure View" предназначен для быстрого отображения и скрытия индикаторов на графике. Особенности
1. На текущий момент Pure View работает с индикаторами Stochastic, MACD, RSI 2. Отображение и скрытие индикаторов осуществляется при помощи горячих клавиш 3. Комбинация клавиш Shift + C отобразит на графике или скроет с него индикатор " Stochastic" 4. Комбинация клавиш Shift + V отобразит на графике или скроет с него индикатор " RSI" 5. Комбинация клавиш Shift + B отобразит на графике или с
FREE

If you love this indicator, please leave a positive rating and comment, it will be a source of motivation to help me create more products <3 Key Takeaways Generates buy and sell signals earlier than regular MA This indicator can detect a trend when it is just starting Filter : A special parameter that is useful for filtering out spikes without causing lag. However, like all indicators, it isn't foolproof, to avoid false signals, it's best to use the Dots indicator with other indicators. Te
FREE
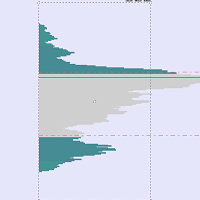
ВАЖНОЕ УВЕДОМЛЕНИЕ – ТРЕБУЕТСЯ ЛИЦЕНЗИЯ И АКТИВАЦИЯ
Инструкции по активации:
После завершения покупки, пожалуйста, немедленно свяжитесь с нами, чтобы получить ключ лицензии, пароль или данные для активации. Без них программное обеспечение не будет работать. Мы здесь, чтобы обеспечить бесперебойный процесс активации и помочь вам с любыми вопросами.
Многоязычная настройка
Чтобы улучшить ваш торговый опыт, мы предлагаем полную настройку программного обеспечения на нескольких языках. Наша
MetaTrader Маркет - единственный магазин, где можно скачать демоверсию торгового робота и подвергнуть его проверке и даже оптимизации на исторических данных.
Прочитайте описание и отзывы других покупателей на заинтересовавший вас продукт, скачайте его прямо в терминал и узнайте, как протестировать торгового робота перед покупкой. Только у нас вы можете получить представление о программе, не заплатив за неё.
Вы упускаете торговые возможности:
- Бесплатные приложения для трейдинга
- 8 000+ сигналов для копирования
- Экономические новости для анализа финансовых рынков
Регистрация
Вход
Если у вас нет учетной записи, зарегистрируйтесь
Для авторизации и пользования сайтом MQL5.com необходимо разрешить использование файлов Сookie.
Пожалуйста, включите в вашем браузере данную настройку, иначе вы не сможете авторизоваться.