Смотри обучающее видео по маркету на YouTube
Как купить торгового робота или индикатор
Запусти робота на
виртуальном хостинге
виртуальном хостинге
Протестируй индикатор/робота перед покупкой
Хочешь зарабатывать в Маркете?
Как подать продукт, чтобы его покупали
Технические индикаторы для MetaTrader 5 - 8

The Volume Delta Indicator is a technical analysis tool that combines volume analysis with price action to identify potential trading opportunities. This indicator analyzes the difference between buying and selling pressure through candle structure analysis. Key Features Volume Delta Calculation : Measures buy/sell volume difference using candle structure analysis EMA Smoothing : Applies exponential moving average to smooth volume data Breakout Detection : Identifies price breakouts with volume
FREE

Linear Regression Channel Pro The ultimate tool for statistical trend analysis. Automatically identifies the "Fair Value" of price and volatility extremes. Overview Linear Regression Channel Pro is a professional-grade indicator that automatically draws and updates the Linear Regression Channel for the current market trend. Unlike standard indicators that curve like Bollinger Bands, this tool draws precise straight-line channels based on the "Least Squares" mathematical method. It is designed fo
FREE

Представляем Koala FVG для MT5 – ваш профессиональный индикатор Fair Value Gap (FVG) Pattern. Koala FVG: ваш путь к точной торговле на MT5 Разблокируйте мощь паттерна Fair Value Gap (FVG) с Koala FVG – передовым индикатором, разработанным для MetaTrader 5. В течение ограниченного времени получите бесплатный доступ к этому профессиональному инструменту, прежде чем он станет платным. Основные функции: Обнаружение паттерна FVG: Koala FVG интеллектуально выявляет квалифицированные паттерны FVG на о
FREE

Большинство сигналов «мгновенной дивергенции RSI» неверны Если вы когда-либо использовали индикаторы дивергенции RSI, вы, вероятно, сталкивались с этим:
дивергенция появляется в реальном времени, сначала выглядит убедительно,
а через несколько свечей исчезает.
Когда вы смотрите на график позже, исторические сигналы уже не совпадают с тем, что вы видели изначально. Это не ошибка пользователя.
Это логическая проблема. Дивергенция, основанная на неподтвержденных вершинах или низах, по своей природе
FREE

98%-ные точные торговые сигналы Точные входы, четкие выходы | Мультитаймфрейм | Все рынки
Как это работает за 3 простых шага 1️⃣ ВХОД В СДЕЛКИ (правила покупки/продажи) Сигнал триггера: две линии (X) пересекаются за пределами цветной зоны (красная для покупки/синяя для продажи).
Подтверждение: ценовая свеча должна коснуться креста (во время или в течение 1-5 свечей после).
Альтернативный вход (без касания):
Сигнал продажи (синяя зона): цена остается выше креста (касание не требуется).
Сигн

Индикатор стабилен на шумовых колебаниях цены и быстро реагирует на тренд. Основан на алгоритме из системы гиперболических функций, позволяющей агрессивно сглаживать флэт с минимальной задержкой на тренде. Его можно применить непосредственно к ценовому графику, к самому себе и к другим индикаторам с целью устранения ложных сигналов. Основное предназначение индикатора — максимально сгладить небольшие пилообразные движения цены. Чем больше параметр Hyperbolic, тем сильнее сглаживание. Но алгоритм
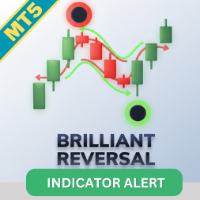
Повысьте точность своей торговли с помощью Brilliant Reversal Indicator MT5 , сложного инструмента, разработанного для выявления потенциальных разворотов тенденций путем анализа исторических ценовых моделей и формаций баров. Основанный на передовых алгоритмах обнаружения разворотов, этот индикатор выделяется в сообществе форекс благодаря своей неперерисовывающей природе, обеспечивая стабильность сигналов даже после закрытия баров. Популяризированный на платформах, таких как MQL5, IndicatorsPot и

Официальная цена релиза 65$ только за первые 1 0 экземпляров, следующая цена 125$ Gold Scalper System — это многофункциональная торговая система, объединяющая стратегию прорыва ключевых уровней ликвидности с подтверждением и встроенный модуль Smart DOM Pro, для анализа рыночной глубины. Система определяет зоны скопления лимитных ордеров, отслеживает активность на уровнях поддержки и сопротивления и генерирует сигналы в момент их прорыва. Smart DOM Pro визуал

Коробка Ганна (или Квадрат Ганна) — метод анализа рынка по статье Уильяма Ганна «Математическая формула для предсказания рынка» (W.D. Gann "Mathematical formula for market predictions"). Этот индикатор может строить три модели Квадратов: 90, 52(104), 144. Шесть вариантов сеток и два варианта дуг. Вы можете построить, одновременно, несколько квадратов на одном графике.
Параметры Square — выбор модели квадрата: 90 — квадрат 90 (или квадрат девяти); 52 (104) — квадрат 52 (или 104); 144 — универса
Версия Советника Если вы предпочитаете автоматическую торговлю вместо ручных сигналов, вы можете найти версию этого индикатора в виде Советника по следующей ссылке: https://www.mql5.com/en/market/product/148310
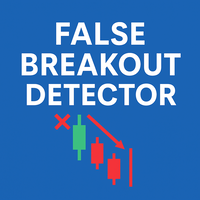
False Breakout Detector — это индикатор, предназначенный для автоматического определения ситуаций, когда цена временно пробивает недавний уровень поддержки или сопротивления, но затем быстро возвращается обратно. Эти ложные пробои могут быть полезны в рамках контртрендовых стратегий или
FREE

Представляем Market Structure Break Out для MT5 — ваш профессиональный индикатор MSB и Unbroken Zone. Версия для MT4 также доступна, ознакомьтесь здесь: https ://www .mql5 .com /en /market /product /109958 Этот индикатор постоянно обновляется. Мы стремимся предоставлять точные точки входа и выхода на основе структуры рынка. Сейчас у нас версия 1.1, и ниже перечислены последние изменения, если вы присоединитесь к нам: Цели покупки и продажи: Получите чёткое представление о лучших уровнях фикса

Azimuth создан для трейдеров, ориентированных на структуру, которые ищут полный анализ рыночного цикла в одном профессиональном пакете.
В то время как большинство индикаторов ZigZag показывают только крупные свинги, Azimuth отображает 4 вложенных уровня свингов одновременно (L1/L2/L3/L4) — обеспечивая ранние входы в цикл, предупреждения о позднем цикле и полный структурный контекст. В сочетании с VWAP, привязанным к свингам (без произвольных дневных сбросов), MTF ZigZag свингами и автоматическ
FREE
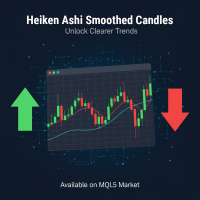
Индикатор Heiken Ashi Smoothed для MT5 Продвинутый Heiken Ashi с фильтром сглаживания. Убирает шум, ложные сигналы и определяет тренды заранее. Идеален для Forex, индексов и крипты на H1-D1. Как работает и как сглаживается? Традиционный Heiken Ashi рассчитывает свечи, усредняя значения открытия, закрытия, максимума и минимума предыдущих периодов, что уже снижает влияние мелких колебаний. Однако Heiken Ashi Smoothed поднимает этот подход на новый уровень, применяя дополнительный фильтр сглаживани
FREE

Smart Money Breakout Channels Indicator
The Smart Money Breakout Channels indicator is a powerful technical analysis tool designed to identify potential breakout opportunities in financial markets by detecting consolidation channels based on price volatility. Built for MetaTrader 5 (MT5), it overlays dynamic channels on the price chart, highlighting areas of low volatility that often precede significant price movements. This indicator is inspired by smart money concepts, focusing on institution
FREE

Индикатор отображает линии пивот, уровни максимума, минимума и закрытия предыдущего дня, а также минимум и максимум предыдущего часа. Нужно просто установить этот индикатор на график, чтобы отобразить все эти важные линии, нет необходимости настраивать множество отдельных индикаторов.
Почему важны определенные линии Максимум и минимум предыдущего дня : эти уровни используются для торговли на дневном графике. Очень часто, если цена становится выше или ниже минимума/максимума предыдущего дня, про
FREE

Этот индикатор отображает волновую структуру рынка в виде нескольких волновых уровней, вложенных друг в друга. Для каждого из этих уровней создается автоматическая предварительная (черновая) разметка волн в стиле Эллиотта (123..., ABC ... и т.д.). Эта разметка является полностью автоматической и абсолютно однозначной. Индикатор особенно полезен для начинающих волновых аналитиков, поскольку среди всех возможных вариантов волновой разметки позволяет сразу взять за основу наиболее адекв
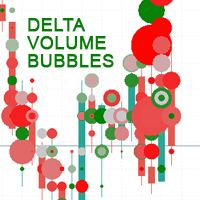
Delta Volume Bubbles is an advanced MetaTrader 5 indicator designed to visually display buy and sell pressure through dynamic, colored bubbles plotted directly on the price chart.
It calculates the net volume delta (difference between buy and sell volume) and represents it as bubbles of different sizes and colors giving traders a clear, intuitive picture of order flow activity. This indicator provides a visual form of order flow analysis , allowing traders to interpret market pressure even with
FREE
Индикатор Candle_Timer_and_Spread показывает на одном графике время до конца свечи и процент изменения цены вместе со спредом по выбранным символам.
Таймер времени до конца свечи по текущему таймфрейму и изменение цены в процентах относительно цены открытия дня по умолчанию расположен в правом верхнем углу графика. Панель показывает спред и процент изменения текущей цены относительно открытия дня для выбранных символов. Панель располагается по умолчанию в левом верхнем углу.
Входные настройки
FREE

Trend Entry Indicator Your Trading will Be easier with this indicator!!! This Indicator is Developed To make our trading life easier. Get an Arrow for Entry with Take Profit and Slop Loss marks on chart. - Indicator is Based on trend, because thats what we all want we want to follow the trend "it's our friend". - Based on Levels, price action and oscillators. - It works on all currency pairs, all indices, metals and stock. - it works on all pairs/indexes on Deriv including Boom and Crash. - Tim

Institutional Liquidity Sweep & Stop Hunt Detector The FAKEOUT MATRIX PRO is a professional-grade analytical tool designed to identify the exact moments when institutional players "trap" retail traders. By monitoring session extremes and detecting high-probability Liquidity Sweeps, this indicator provides the technical edge needed to trade reversals with precision. The Institutional Logic Large financial institutions require significant liquidity to fill their orders. They often find this liquid
FREE
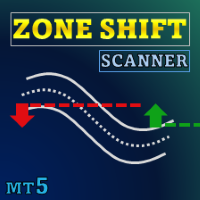
Специальное предложение : ALL TOOLS , всего по $35 за каждый! Новые инструменты будут стоить $30 в течение первой недели или для первых 3 покупок ! Канал Trading Tools на MQL5 : присоединяйтесь к моему каналу MQL5, чтобы получать последние новости от меня Zone Shift — это инструмент для идентификации тренда, который использует диапазоны на основе EMA/HMA для обнаружения смены тренда и отображения ключевых уровней реакции. Он показывает направление тренда через цвет свечей и отмечае

Benefits and Usage of the Volume Bubble Tool This tool, (one of my favorites by Algo Alpha, from Tradingview) provides an advanced method of volume analysis by moving beyond traditional histograms. It leverages statistical normalization (Z-score) on lower-timeframe data to identify and classify statistically significant volume events, visualizing the dynamic between "Smart Money" (institutional) and "Retail" participants. Core Benefits Intuitive On-Chart Visualization: By plotting volume as bub
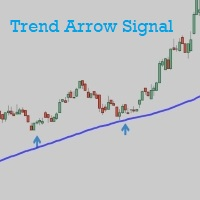
Trend Arrow Signal gives buy/sell signals and alerts with up and down arrow at potential reversal of a pullback or a trend continuation pattern. As the name indicated, this is an indicator which gives signals based on trend => It works best in trend market with the principle is to ride on the trend not trade against the trend. The main trend is determined by EMA 50 and can be changed manually to suit your preference. Trend arrow signal can work on all time frames. It gives signal at close of th
FREE

Профессиональный инструмент для торговли - индикатор дивергенции между RSI и ценой, позволяющий своевременно получать сигнал о развороте тренда или ловить движения откатов цены (в зависимости от настроек). Настройки индикатора позволяют регулировать силу дивергенции за счет угла наклона пиков RSI и процентного изменения цены, что даёт возможность тонко настроить силу сигнала. Код индикатора оптимизирован и в составе советника очень быстро тестируется. Индикатор не перерисовывает, стрелки для н
FREE

Этот индикатор находит и отображает фигуры технического анализа "Двойное дно" и "Двойная вершина". Сигнализирует (выводит сообщение на экран), если фигура была сформирована недавно. Часто после появления этих паттернов, тренд поворачивает обратно или происходит коррекция. Чтобы не искать их самостоятельно, или не пропустить их появления, достаточно добавить индикатор на график. Индикатор можно использовать на разных таймфреймах и валютных парах, есть настройки для лучшего поиска на определённой
FREE

This is Heiken Ashi smoothed version, where you can choose on what type smoothness you want to make your strategy base. You can choose between EMA or MA, on the period you want. And you can choose colors.
Definition:
The Heikin-Ashi technique averages price data to create a Japanese candlestick chart that filters out market noise. Heikin-Ashi charts, developed by Munehisa Homma in the 1700s, share some characteristics with standard candlestick charts but differ based on the values used to cre
FREE
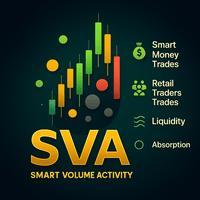
Smart Volume Activity [SVA] is an advanced analytical indicator designed for MetaTrader platforms. It reveals how institutional (Smart Money) and retail traders operate by analyzing volume behavior across multiple timeframes . Unlike ordinary volume tools, SVA automatically adapts to any chart timeframe and highlights zones of absorption — moments when large market participants absorb liquidity from weaker hands. By detecting abnormal volume spikes far beyond typical market noise, it distinguish

VISUAL ATR CANDLESTICK SCANNER PRO - Расширенное Распознавание Паттернов Visual ATR Candlestick Scanner Pro — это индикатор, разработанный для автоматического выявления и фильтрации распространенных свечных паттернов, предоставляя более четкое представление о потенциальных рыночных разворотах или продолжениях. I. Основные Характеристики и Функциональность 1. Автоматическое Распознавание Свечных Паттернов Индикатор автоматически распознает более 25 профессиональных свечных паттернов, классифицир

KT HalfTrend — это индикатор тренда на основе скользящих средних, который отображает зоны. Он сигнализирует о смене тренда путём отображения зон отмены бычьего и медвежьего направлений на графике. Он также показывает силу сигналов на покупку и продажу с помощью стрелок на основном графике. Если тренда нет, индикатор будет плоским — это может означать зону накопления, временной консолидации или распределения цены. Если тренд присутствует, индикатор будет иметь наклон в соответствующем направлении

The SuperTrend Strategy is a widely-used technical indicator based on the Average True Range (ATR), primarily employed as a trailing stop tool to identify prevailing market trends. The indicator is designed for ease of use while providing reliable insights into the current market trend. It operates based on two key parameters: the period and the multiplier . By default, it uses a period of 15 for the ATR calculation and a multiplier of 3 . The Average True Range (ATR) plays a crucial role in th
FREE

MACD Intraday Trend PRO - это индикатор, разработанный на основе адаптации оригинального MACD, созданного Джеральдом Аппелем в 1960-х годах.
За годы торговли было замечено, что, изменяя параметры MACD с пропорциями Фибоначчи, мы достигаем лучшего представления непрерывности движений тренда, что позволяет более эффективно обнаруживать начало и конец ценового тренда.
Благодаря своей эффективности в обнаружении ценовых тенденций, также можно очень четко идентифицировать расхождения вершин и осно
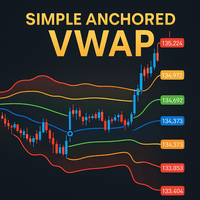
Simple Anchored VWAP is a lightweight yet powerful tool designed for traders who want precise volume-weighted levels without complexity.
This indicator lets you anchor VWAP from any point on the chart and instantly see how price reacts around institutional volume zones. MT4 Version - https://www.mql5.com/en/market/product/155320
Join To Learn Market Depth - https://www.mql5.com/en/channels/suvashishfx Using VWAP bands and dynamic levels, the tool helps you understand where real buying and s
FREE

Ichimoku Trend Alert is the Ichimoku Kinko Hyo indicator with Alerts and signal filters.
Ichimoku Trend Alert features: Optional check of Ichimoku cloud, Tenkan sen(Conversion Line), Kijun sen(Base Line), Senkou span A, Senkou span B, and Chikou span relative to price, and more. Popup, email, and phone notification alerts for selected symbols and timeframes.
There are 9 classic Ichimoku trend filters you can enable/disable in settings: Price/Cloud Order: Checks the price position relative to
FREE
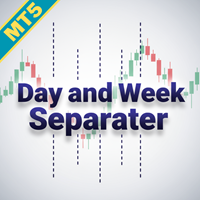
Оптимизируйте анализ торгов с помощью Day and Week Separator MT5 — интуитивно понятного инструмента, предназначенного для построения настраиваемых линий разделения дней и недель, идеально подходящего для трейдеров, сталкивающихся с разницей во временных зонах брокера. Этот индикатор высоко ценится в торговых сообществах, таких как Forex Factory и Reddit (r/Forex), за свою простоту и эффективность, решая распространенную проблему синхронизации таймфреймов графика с местным или рыночным временем,
FREE

Индикатор Price Action Finder это индикатор точек входа, который предназначен для поиска и отображения паттернов системы Price Action на графике цены. Индикатор оснащён системой трендовых фильтров, а также системой алертов и пуш уведомлений. Инструкция/Мануал ( Обязательно читайте перед приобретением ) | Версия для МТ4 Преимущества
1. Паттерны: Пин бар, Внешний бар, Внутренний бар, PPR, Бар силы, Повешенный, Перевёрнутый молот
2. Система фильтрации паттернов. Убирает с графика контртрендовые пат

Индикатор ищет консолидацию(флэт) на рынке в определенное время, строит коробку-канал и отмечает уровни с отступом от него на пробой. После пересечения одного из уровней индикатор отмечает зону для тейкпрофита и считает соответствующий профит или убыток в направлении данного входа на панели. Таким образом, индикатор, подстраиваясь под рынок, находит флэтовый участок с началом трендового движения для входа в него. Версия для MT4: https://www.mql5.com/ru/market/product/57466 Преимущества:
уникаль
FREE

Phoenix Trend Strength Meter (MT5)
Анализатор рыночного режима и силы тренда для MetaTrader 5. Объединяет ADX, RSI и Directional Movement в одной панели для классификации рыночных условий в режиме реального времени.
Назначение
Большинство трейдеров терпят неудачу не из-за плохих входов, а потому, что применяют неправильную стратегию к неправильному рыночному режиму. Индикатор Phoenix Trend Strength Meter помогает трейдерам мгновенно определить, находится ли рынок в диапазоне, развивает ли он
FREE

This is a simple order block locator. Searched for the existence of order blocks only at extremums. If you want multi criteria order block location check my other indicator which is more powerful here These order blocks are ICT order blocks without any buttering.
The indicator can be a useful tool for detecting reversals, continuations. You can also use the indicator as confluence with your other tools
FREE

Общее описание Этот индикатор — усовершенствованная версия классического канала Дончия с добавлением практических функций для реальной торговли.
Помимо стандартных трёх линий (верхняя, нижняя и средняя), система определяет пробои и отображает их на графике стрелками, показывая только линию, противоположную текущему направлению тренда для более чистого восприятия. Индикатор включает: Визуальные сигналы : цветные стрелки при пробое Автоматические уведомления : всплывающие окна, push и email Фильтр
FREE

Good old UT BOT converted from TradingView script by ' QuantNomad ', initially by ' Yo_adriiiiaan ' and ' HPotter ' - so you can bet this is powerful tool. If you know, you know. This is top of the line, while keeping it really simple.
Main function: trend identification with trend switch points , created by EMA(source) and ATR -source is CLOSE PRICE with option to use HEIKEN ASHI chart instead, for this you need "Heiken Ashi" indicator - its available as free download by MetaQuotes
One of th
The Omega Trend Indicator is an advanced tool that has been specifically designed to detect market trends early, and follow them efficiently. The indicator draws two lines. The main (thicker) Trend Line represents the presumed lower or upper volatility limits of the current market trend. A break in the main Trend Line indicates a potential reversal or shift in the movement of the trend. The Trend Line also indicates the best point to place a stop loss order. In Omega Trend Indicator, the Trend L
FREE
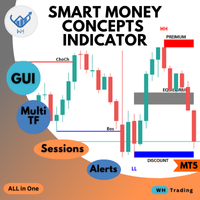
Welcome to the ultimate Smart Money Concepts indicator ,, this indicator is All-in-One package the only thing you need to empower
all the Smart Money Concepts in one place with interactive advanced gui panel with all the features and customization you need. MT4 Version : WH SMC Indicator MT4 *This Price For Limited Number of Copies.
Features: Main Section: User-Friendly Panel (GUI): Designed for traders of all experience levels, the indicator integrates seamlessly into your MT5 platform

Cybertrade Auto Fibonacci retraction and projection - MT5
Auto Fibonacci is an indicator that automatically plots the Fibonacci retracement and projection based on the number of bars you select in the indicator setting. You can customize nine different levels of retraction and three levels of projection. It works on periods longer than the period visible on the chart. All values are available in the form of buffers to simplify possible automations. This indicator is the same one we use in ou
FREE
REVERSAL POWER PRO
The ONLY Indicator That Shows You Where Markets WILL Reverse - BEFORE They Move
WELCOME TO THE NEXT LEVEL OF TRADING PRECISION
Tired of guessing where the market will turn? Missing entries because you don't know where support/resistance REALLY is? Getting stopped out at "fake" levels? Wondering if your bias is correct before entering?
What if you had: Crystal-clear Supply/Demand Zones that markets RESPECT Daily Bias Engine telling you market directio
FREE
ICONIC Reversal Engine Качество важнее количества. Торгуйте только те развороты, которые действительно имеют значение. Проблема: шум, перегруз, ложные сигналы Большинство индикаторов усыпают график стрелками, игнорируя контекст.
«Молот» на сильном даунтренде — несущественен. Поглощение без объёма — ловушка.
Итог: паралич анализа, упущенные движения, дорогие ошибки. Решение: ваш аналитический второй пилот ICONIC Reversal Engine — это не «ещё одна стрелка». Он объясняет, почему сетап важен.
Каждый
FREE

This indicator is specifically designed for boom 1000 index. The indicator contains optimised trend filters to target buy spikes in an uptrend. The indicator also add a grid buy signal to recover some loss of the first buy signal. The indicator also provides exit signals for delayed spikes which can help with risk management .Also it analyses signals for historical data and displays percentage of good signals provided by the indicator. KEY FEATURES Non-lagging indicator. Non-repaint. Enable/d
FREE

Special offer : ALL TOOLS , just $35 each! New tools will be $30 for the first week or the first 3 purchases ! Trading Tools Channel on MQL5 : Join my MQL5 channel to update the latest news from me Раскройте силу концепции Inversion Fair Value Gap (IFVG) от ICT с помощью индикатора Inversion Fair Value Gaps Indicator ! Этот современный инструмент поднимает Fair Value Gaps (FVG) на новый уровень, выявляя и отображая инверсированные зоны FVG — ключевые области поддержки и сопротивлен

Позвольте представить вам Golden Sniper Indicator — мощный инструмент MQL5, разработанный для трейдеров, желающих улучшить свой опыт торговли. Этот индикатор, созданный командой опытных трейдеров с более чем 6-летним стажем , предлагает надежный метод для выявления торговых возможностей с выдающейся точностью. Основные характеристики : Сигналы и стрелки : Golden Sniper Indicator предоставляет своевременные сигналы и визуальные стрелки, помогая вам выявлять развороты тренда. Управление рисками :

Price Volume Trend (PVT) Oscillator Description: The PVT Oscillator is a volume indicator that serves as an alternative to the standard On-Balance Volume (OBV). While ordinary volume indicators can be noisy and hard to read, this tool converts volume flow into a clear Histogram Oscillator, similar to a MACD, but for Volume. It is designed to detect first Trend Reversals and Divergences by analyzing the difference between a Fast and Slow PVT moving average. Why is this better than standard OBV?
FREE

Мультивалютный и мультитаймфреймовый индикатор Bollinger Bands. На панели вы можете видеть прорывы и касания (ценой) линий Боллинджера. В параметрах можете указать любые желаемые валюты и таймфреймы. Также индикатор может отправлять уведомления при касании Полос Боллинджера. По клику на ячейке будет открыт данный символ и период.
Параметры Настройки Bollinger Bands Averaging period — период усреднения для вычисления индикатора. Standard deviations — количество стандартных отклонений от основно
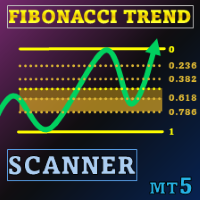
Специальное предложение : ALL TOOLS , всего по $35 за каждый! New tools will be $30 for the first week or the first 3 purchases ! Trading Tools Channel on MQL5 : Join my MQL5 channel to update the latest news from me В условиях волатильной торговой среды мощный и интуитивно понятный инструмент анализа поможет вам быстро воспользоваться новыми возможностями. Fibonacci Trend Scanner не только объединяет в себе функции традиционного индикатора Fibonacci и SuperTrend, но и расширяет во

Projective SR – Прогнозируемые Уровни Поддержки и Сопротивления в Реальном Времени Projective SR — это продвинутый индикатор, который автоматически определяет ключевые точки поддержки и сопротивления на графике и прогнозирует их диагонально и динамически на будущее, предвосхищая потенциальные зоны, где цена может отреагировать. В отличие от традиционных индикаторов, которые показывают только фиксированные уровни, Projective SR анализирует геометрию цены , выявляет наиболее значимые пивоты и черт
FREE

The Hydra Multi Trend Dashboard is a powerful market scanning tool designed for MetaTrader 4 and MetaTrader 5. It monitors up to 25 currency pairs or assets simultaneously across all 9 standard timeframes (M1 to Monthly). Using a proprietary Special Trend Formula , the dashboard filters out market noise and provides clear, visual Bullish or Bearish signals, allowing traders to identify trend alignments at a glance without switching charts. Setup & Guide:
Download MT4 Version here. Exclusivel

Индикатор для ручной торговли и технического анализа для Forex.
Состоит из трендового индикатора с уровнем открытия торгового дня и стрелочного индикатора для определения точек входа.
Индикатор не перекрашивается, работает по закрытию свечи.
Содержит несколько типов оповещений для сигнальных стрелок.
Можно настроить для работы на любом графике, торговом инструменте или тайм-фрейме.
Стратегия работы базируется на поиске движений цены по тренду.
Для совершения сделок " Buy ": Трендовая линия д
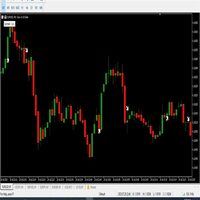
hello,
king binary sureshot mt5 binary indicator,
1 minute candle
1 minute expire
Alright. This indicator works on MT5 and is very easy to use. When you receive a signal from it, you wait for that candle with the signal to close and you enter your trade at the beginning of the next new candle. A red arrow means sell and a green arrow means buy. All arrows comes with a long dotted like for easy identification of trade signal. Are you okay with that?
FREE
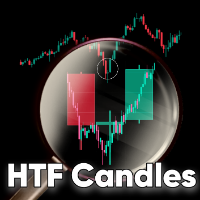
HTF Candles is an indicator which plots the outline of the higher time-frame candles on the lower candle. The indicator gives you the option to choose whether or not to view live current HTF candle, with no lag or repainting. Features No objects drawn on chart: The indicator does not plot any lines or rectangle objects on the chart, it simply draws the htf candles. This keeps your chart simple and clean. MTF Selection: The indicator allows you to choose all the different higher time-frames for e

Этот мульти-таймфрейм и мультисимвольный индикатор идентифицирует двойную или тройную вершину / основание или последующий прорыв линии шеи (подтвержденная вершина / основание). Он предлагает RSI, пин-бар, поглощение, пинцет, утренние / вечерние звездные фильтры, а также параметры фильтра дивергенции, которые позволяют отфильтровать только самые сильные настройки. Индикатор также можно использовать в режиме одиночного графика. Подробнее об этой опции читайте в разделе продукта. блог . В

Trendline Targets Dashboard MT5 Trendline Targets Dashboard MT5 — это индикатор для MetaTrader 5, который отображает полный визуальный торговый план: сигнал , точку входа (Entry) , Stop Loss и Take Profits , автоматически рассчитанные в коэффициентах риска R . Индикатор не открывает сделки. Это инструмент визуального анализа и управления, а не торговый робот. Специальное предложение: при покупке вы получаете 1 индикатор в подарок на выбор из моего профиля MQL5. Исключение: бонус не распространя

Peak Trough Analysis - отличный инструмент для обнаружения пиков и впадин на графике. Peak Trough Analysis может использовать три разных алгоритма обнаружения пиков и впадин. Эти три алгоритма включают в себя оригинальный индикатор Fractals Билла Вильямса, модифицированный индикатор Fractals и индикатор ZigZag. Вы можете использовать этот инструмент анализа пиков и впадин для обнаружения паттернов, составленных Равновесным Фрактально-Волновым процессом. Для дальнейшего использования имеется хоро
FREE
Умный помощник для точных и своевременных входов в рынок. Индикатор подаёт звуковой сигнал и оповещения, когда цена достигает уровней. Вы можете устанавливать уровни поддержки и сопротивления вручную или доверить это алгоритму. В момент, когда цена достигает уровня, дополнительно размечаются свечные паттерны. Уникальные свечные паттерны являются симбиозом классических паттернов и моделей пробоя и отбоя уровней. Для высоко-прибыльной торговли на бирже в большинстве случаев установки ордеров недос
FREE

Position Size Calculator PRO MT5 (v2.20) Position Size Calculator PRO — это профессиональный инструмент управления рисками для MetaTrader 5, который рассчитывает рекомендуемый размер лота на основе вашего риска на сделку, расстояния Stop Loss и спецификаций символа (стоимость тика, размер тика, мин/макс объем, маржа). Без торговых операций: этот индикатор не открывает и не закрывает ордера и не управляет позициями. Это инструмент поддержки принятия решений для стандартизации вашего мани-менеджме

Sigma Indicator is used by Sigma Expert advisor for plotting the zones but now its available for members to apply their stratagies on Sigma supply and demand levels.
Instructions:
1- Donot Change time frames instead run several pairs with different time frames with sigma indicator 2- For exness : Search for smaller zone = True
For other brokers keep it False
3- Maximum zone size = 0
4- Minimum zone size = 0
5 - Back candles = 300

Мультивалютный и мультитаймфреймовый индикатор ZigZag. Отображает текущее направление рынка, высоту последнего движения, количество баров в этом движении и пробитие предыдущей точки ЗигЗага.
В параметрах вы можете указать любые желаемые валюты и таймфреймы. Также панель может отправлять уведомления при изменении направления ЗигЗага или когда произошел пробой предыдущей точки. По клику на ячейке с периодом будет открыт данный символ и период
Параметры Depth — минимум свечей, на котором индикат

Мультивалютный и мультитаймфреймовый индикатор Inside Bar (Внутренний Бар). В параметрах вы можете указать любые желаемые валюты и таймфреймы. Индикатор отображает последний найденный паттерн Внутреннего Бара, текущее положение цены и пробитие уровней Материнского и Внутреннего Баров. Вы можете устанавливать размер и цвет для баров и текста в ячейках. Также индикатор может отправлять уведомления при пробитие уровней. По клику на ячейке с периодом будет открыт указанный символ и период.
Парамет

Детектор поддержки и сопротивления Phoenix (MT5)
Профессиональный инструмент для определения уровней поддержки и сопротивления для MetaTrader 5. Автоматически определяет самые сильные уровни S&R на более высоком таймфрейме и отображает комплексный анализ силы с помощью визуальной панели инструментов.
Обзор
Phoenix Support & Resistance Detector определяет три самых сильных уровня поддержки и сопротивления с помощью анализа пивотов более высокого таймфрейма (по умолчанию H4, настраиваемый). Сис
FREE

Индикатор находит на графике свечные паттерны на основе книги Грегори Л. Морриса «Японские свечи. Метод анализа акций и фьючерсов». При обнаружении модели индикатор выдает сообщение при закрытии бара. Если вы торгуете с помощью терминала MetaTrader 4, то вы можете скачать полный аналог индикатора " Candle Pattern Finder for MT4 "
Список распознаваемых моделей: Бычья / Медвежья (в скобках возможные настройки параметров) : Молот / Падающая Звезда (с подтверждением / без подтверждения*) Перевернут

Это индикатор торговых сессий который может отображать все уровни ( Open-High-Low-Close ) для четырех сессий. Сессии могут быть нарисованы линиями или с заливкой как свечи, линии могут быть продлены до следующей сессии. Вы можете легко скрывать/показывать каждую сессию нажатием на горячие клавиши. Также вы можете видеть ASR (средний диапазон сессий) (горячая клавиша по умолчанию «A»). Это похоже на расчет ADR, только он рассчитывается на основе последних X-сессий, что позволяет увидеть пот

MA 3 Trend – это хороший трендовый индикатор на трех МА. Преимущества индикатора: И ндикатор выдает сигналы с высокой точностью.
Подтвержденный сигнал индикатора не исчезает и не перерисовывается.
Торговать можно на торговой платформе MetaTrader 5 любого брокера.
Торговать можно любыми активами (валюты, металлы, крипто валюты, акции, индексы и т.д.).
Торговать можно на любых таймфреймах ( M 5- M 15 скальпинг и дейтрейдинг / М30-Н1 среднесрочная торговля / Н4- D 1 долгосрочная торговля
FREE

Indicador gratuito para Metatrader 5 que muestra en pantalla una caja rectangular para cada una de las sesiones de mercado "Londres, New York y Tokio". Se puede establecer la zona horaria de forma automática o mediante un valor de offset. Parámetros de configuración para cada una de las sesiones. Visible / No visible Hora Inicial Hora Final Caja sólida o transparente. Estilo del borde de la caja. Grosor del borde de la caja. Color.
FREE

Smart Volume Box is designed to give MetaTrader users a powerful, analytical tool for uncovering the hidden dynamics in the market. This precision-built tool, complete with user-friendly settings, integrates essential volume insights and advanced features like Volume Profile, VWAP (Volume Weighted Average Price), and Point of Control (POC) levels. Unlike typical indicators, Smart Volume Box doesn’t provide specific trade signals but instead offers a clearer perspective on market trends, makin
А знаете ли вы, почему MetaTrader Market - лучшее место для продажи торговых стратегий и технических индикаторов? Разработчику у нас не нужно тратить время и силы на рекламу, защиту программ и расчеты с покупателями. Всё это уже сделано.
Вы упускаете торговые возможности:
- Бесплатные приложения для трейдинга
- 8 000+ сигналов для копирования
- Экономические новости для анализа финансовых рынков
Регистрация
Вход
Если у вас нет учетной записи, зарегистрируйтесь
Для авторизации и пользования сайтом MQL5.com необходимо разрешить использование файлов Сookie.
Пожалуйста, включите в вашем браузере данную настройку, иначе вы не сможете авторизоваться.